Prognostics of Transformer Paper Insulation using Statistical
Particle Filtering of On-Line Data
Key words: transformer, prognostics, paper insulation, life estimation, condition monitoring
V. M. Catterson(1), J. Melone(2), and M. Segovia Garcia(2),
(1) Institute for Energy and Environment, University of Strathclyde, UK (2) Power Network Demonstration Centre, University of Strathclyde, UK
Prognostics of transformer remaining life can be achieved through a statistical technique called particle filtering, which gives a more accurate prediction than standard methods by quantifying sources of uncertainty.
Introduction
The adoption of prognostics for critical assets has the potential to advance asset management in the power industry significantly. While diagnostic techniques can identify the presence of incipient faults, prognostics aims to predict the future state of a given asset [1], [2]. Prognostics can thereforebe used to estimate the remaining useful life (RUL) of the asset, andhelp plan maintenance while minimizing the risk of failure in service.
Prognostics requires a good model of the process of deterioration, from inception through to failure [1]-[3]. Deterioration may be due to aging, as in the case of paper insulation, or it may be due to a fault. Regardless of the cause of deterioration, prognostics is useful only if the deterioration is slow enough that maintenance (repair or replacement) can be scheduled during the predicted RUL. Thus prognostics is not superior todiagnostics if the deterioration is so rapid that failure cannot be prevented.
A deterioration model can take the form of a physics-of-failure (PoF) model, or it can be derived from data [3]. Within the power industry, a major difficulty of the latter is ‘hazard censoring’, where little data relating to asset failures is available because most assets are removed from service before failure. A PoF model may be preferable since it can offer some quantitative support for the RUL prediction. In either case, there is always some uncertainty about an asset’s future deterioration.
A prognostics system should ideally quantifythis uncertainty as well as modeling the deterioration.
particle filtering [10]-[12]. Of the latter, a statistical filtering technique called the particle filter is one of the most versatile, as it places few constraints on the form of the deterioration function, and incorporates explicit handling of uncertainty. It should be noted that, in this context, a “particle” is a system simulation, not a physical particle (impurity) in transformer oil.
Prognostics is more widespread in industries where the safety-related nature of the application leads to higher levels of component monitoring than in the power industry. In particular, the particle filtering approach has been applied to mechanical faults in aerospace assets, e.g., crack growth propagation [10] and impeller wear [11]. However, with growing volumes of data being collected from power networks, following increased adoption of smart grid technologies and lower costs of sensors and storage, online prognostics is now becoming more commonfor electrical assets.
In this article the particle filter as a method of prognostics for transformer paper aging is described. The PoF model of deterioration at the core of the particle filter is derived from the widely accepted IEEE standard C57.91. The key advantage of the particle filter approach is that it quantifies various sources of uncertainty in the paper aging process, from uncertainty in the measurements used to derive hotspot temperature to uncertainty in the activation energy required to break cellulose chains in the insulation paper of a given transformer. Over the course of a transformer’s service life, these small sources of uncertainty may lead to significant prognostic error. By adding a probabilistic layer of analysis to the deterministic equations in C57.91, the particle filter can provide a utility with a more informative but less precise estimate of remaining paper lifetime.
The Particle Filter
A particle filter is a probabilistic simulation of a system—in the case of prognostics, the deterioration of a component [13]. Within the filter, a large number of simulations (called ‘particles’) are run in parallel with slightly different initial conditions and probabilistic state transitions. Each particle captures one possible fault trajectory. Once one or more measurements of the system have been made, each particle is given a weighting based on the likelihood of it representing the true state of the system. The prediction of the time to reach a given state, e.g., failure, emerges through agreement between the majority of highly-weighted particles.
The system is modeled as two parts, namely the process model f and the measurement model h [14]:
𝑥! =𝑓(𝑥!!!,𝑢!) (1)
𝑦! =ℎ(𝑥!,𝑣!) (2)
immediate previous state and current conditions, and not on historical states [13]. The measurement model h represents the difference between measurements and the true state of the system, due to noise or known biases in the instrumentation, or because the system state is not directly observable and must be inferred from proxy variables.
At each time-step, two calculations are made for each particle i :
1. Simulation of the new system state 𝑥!!, given the previous system state 𝑥 !!!!:
𝑥!! = 𝑓 𝑥
!!!! ,𝑢! ∀𝑖 (3)
2. Weighting of the particle likelihood 𝑤!!, given the probability of new measurement values occurring if this particle represents the true system state 𝑝 𝑦! 𝑥!!), combined with the weight of this particle at the previous
timestep 𝑤!!! !:
𝑤!! =𝑝 𝑦
! 𝑥!! × 𝑤!!!!∀𝑖 (4)
Equation (3) providesprognostic capability, as it predicts the next timestep. Equation (4) is a diagnostic step, as it uses measurements to adjust the probability of each particle representing the true current state of the system. Predictions at longer times can be generated by repeated use of (3), with predicted outputs being fed back as inputs for subsequent timesteps.
The result generated by the particle filter is derived from the state of all particles. A common approach is to look at the spread of possible states at a given future time, as in [11]. In that case all particles simulate health in, say, a year’s time, and the expected distribution of RUL values at that time is calculated from individual RUL values in each particle. Important parameters of this distribution include the median RUL (the 50th percentile), and expected upper and lower limits on RUL such as the 5th and 95th percentile bounds.
Application to Transformer Paper Aging
Transformers are the most expensive single asset in the power system, and are critical to network performance targets being met. It can therefore be cost-effective to install monitoring equipment and track the condition of key transformers, with the aim of delaying repair or replacement until they are essential. As a result, a large body of research and practice has focused on transformer monitoring and
degradation mechanisms, so that significant scope for the application of prognostics to transformers now exists.
factors with most influence paper DP are thought to be temperature, moisture and oxygen content, and to a lesser extent acid and contaminant content [16],[17].
The main mechanisms of paper breakdown are hydrolysis, oxidation, and pyrolysis, which occur at different rates depending on temperature, moisture, and oxygen levels within the paper [16]. Pyrolysis requires extreme temperatures (greater than 140 oC), and can therefore be largely discounted under normal operation [16],[17]. Oxidation requires the presence of oxygen, and may therefore be considered highly important for free-breathing transformers and less so for sealed units [16]. However, over the life of a sealed transformer, oxidation can play an important role because it leads to the generation of acids, which catalyze deterioration [16]. Hydrolysis is dependent on temperature and the presence of moisture. Since the paper is dried during transformer construction and moisture levels tend to increase during service, the rate of hydrolysis is generally expected to increase as the transformer ages [16].
For a newly-built sealed transformer, the main deterioration mechanism is hydrolysis, and the rate of aging on a day-to-day basis is dominated by changes in temperature rather than by changes in moisture content. A model which relates temperature to rate of change of paper DP is found in IEEE Standard C57.91 [18], which defines an aging acceleration factor 𝐹!!
𝐹!! = 𝑒
!"###
!"! !
!"###
!"#!!! (5)
where Θ! is the temperature (in oC) of the transformer hotspot. C57.91 states that
the transformer paper will reach end-of-life DP after 180,000 hours at 110 oC. Aging is faster and lifetime is shorter at higher temperatures.
(5) can be rearranged by converting it into a recurrence relation for remaining paper lifetime:
𝑙! =𝑙!!!−exp (15000+𝑢!) !"!! − !"#! !!
!! (6)
where 𝑡 is the time in service in hours, 𝑙! is the RUL at time 𝑡, Θ!! is the hotspot
temperature at time 𝑡, and 𝑢! is process noise. There are two main sources of uncertainty in this model, namely the initial condition 𝑙!, which is the initial number of hours of expected service life corresponding to the initial DP of the paper, and the process noise which is the slight variation in lifetime reduction for a given hotspot temperature. The latter is due to small differences in the activation energy required to break cellulose (paper) chains.
ΔΘ!"/! relative to Θ!, and a known hot spot temperature rise ΔΘ!/!" relative to
top oil temperature ΘTO :
Θ! = Θ! +ΔΘ!"/! +ΔΘ!/!" (7)
The steady-state top oil temperature rise over ambient can be calculated as:
ΔΘ!"/! = ΔΘ!",! !!!!!!!! ! (8)
where ΔΘ!",! and 𝛾 are respectively the top oil temperature rise over ambient at the transformer rated load and the ratio of load loss at rated load to loss at zero load, 𝐾 is the ratio of measured load to rated load (𝐿/𝐿!), and 𝑛 is a constant for a given cooling mode.
The hotspot temperature rise over top oil can be calculated as:
ΔΘ!/!" = ΔΘ!,! × 𝐾!! (9)
where ΔΘ!,! is the transformer design parameter hotspot temperature rise over top oil at rated load, 𝐾 is as defined immediately above, and 𝑚 is another constant for a given cooling mode.
Hotspot temperature can be calculated from measurement of ambient temperature and load, in combination with a number of design parameters and constants. The final step in building a particle filter measurement model is to incorporate the sensor noise 𝑣! and 𝑣! superimposed on measurements of ambient temperature and load respectively:
Θ! = (Θ! +𝑣!)+ΔΘ!",! ! !!!! !!!
!
+ΔΘ!,! × 𝐾!!,𝐾=(!!!!!!) (10)
This measurement model assumes that a simulation time-step is long enough for the hotspot temperature to be taken as its steady state value.
Case Study Example
The Power Networks Demonstration Centre (PNDC) is an 11kV/400V test facility located near Glasgow, UK, used for trial and demonstration of smart grid technologies. It was built to resemble a distribution network of the future, with significant levels of automation and communications, embedded generation, and the capability to generateresistive balanced and unbalanced faults [19].
Table 1: Transformer parameters for measurement model
Parameter Value
Rating 2 MVA
Cooling mode ONAN
Oil temperature rise over 40 oC ambient 60 oC No load losses 3100 W Load losses at rated current 21000 W
The particle filter will now be used to examine two cases, firstly the aging to September 2015 of the transformer in service, followed by its expected aging over the next five years.
Aging to date
The PNDC site was commissioned in January 2014. The on-site load is atypical for a distribution feeder, since it is limited almost entirely to weekday business hours. Due to the testing of equipment, including novel protection devices, the network may experience a higher number of faults than a utility would consider acceptable. However, the duration of fault current is limited by standard backup protection schemes, and consequently will not cause significant heating in the transformer.
A data setof load and temperature between January 2015 and September 2015 was generated. Load was measured using a measurement class 1 current transformer, with automatic logging initiated in January 2015. Prior to this, logging was initiated manually and consequently some service data were not recorded. However, no significant transformer loading occurred in 2014 as the site went through stages of equipment commissioning. Ambient temperature data were collected from a nearby airport weather station. Minimum, mean, and maximum were logged at both daily and hourly intervals.
The network is usuallyde-energized overnight, with experimental work beginning at 0900h. It is used for various experiments until the working day ends at 1700h, when it is again de-energized. The current measured at the isolation transformer is typically 20–30 A, and fluctuates due to network reconfiguration and changing loadbank settings. On multiple occasions current peaked at 80-105 A, and interruptions occurreddue to introduction of faults.
The measurement noise 𝑣! superimposed on the ambient temperature measurement was chosen to be 𝒩(0,1), with a standard deviation of 1 oC to account for the temperature being measured nearby rather than on site. The noise
𝑣! superimposedon load current measurements is due to the measurement class 1 current transformers used to determine the transformer loading. The process noise 𝑢, chosen as 𝒩 0,20 on the basis of an assumed uncertainty ΔEA up to 0.5 kJ/mol
in the activation energy of the paper degradation process, causes a variation in the constant 15,000 in equation (6). That variation could be up to
∆𝐸! 𝑅 =
0.5
8.314 × 10!! = 60.1 Κ
where 𝑅 is the universal gas constant. The value of 60.1 Kwas assumed equivalent to three standard deviations in the value of the mean activation energy (accounting for over 99% of events). Thus the process noise u was drawn from a normal distribution with a standard deviation of one third of 60.1 K.
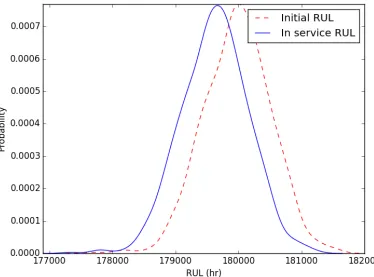
[image:7.595.99.473.449.726.2]Starting from these initial conditions, the service condition data were filtered to give a diagnosis of the health of the transformer paper in September 2015. Figure 1 shows the resulting probability distribution functions of the RUL, derived from the predictions of all 1000 particles. The median RUL at the start of life is just below the mean, at 179,986 hours, and is estimated to have dropped to 179,631 hours by September 2015.
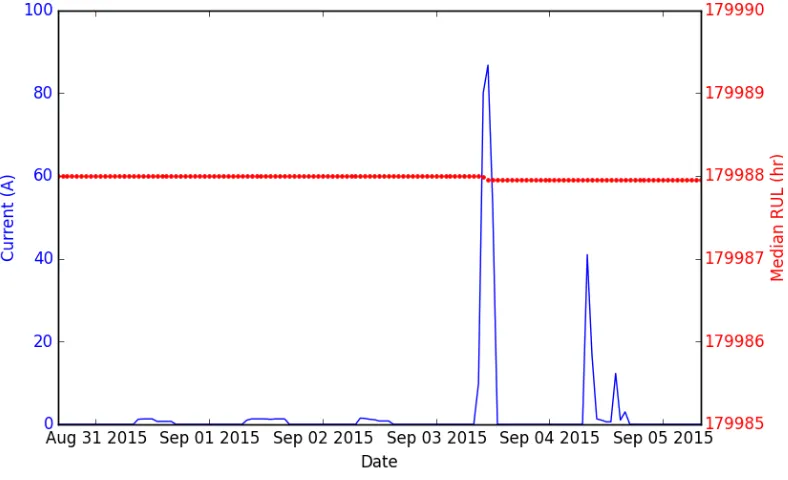
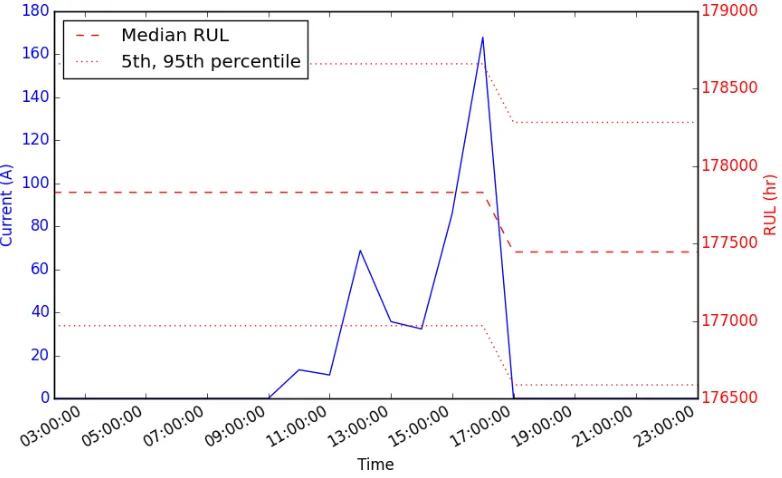
The relatively light loading of this transformer compared to its rated load means that the life consumption of itspaper is slow, although step changes in RUL can be seen when the load current approaches its rated value. Figure 2 shows a typical nine-day period of relatively light loading compared to rated load, where the decrease in median value of RUL can hardly be seen. In contrast, Figure 3 shows a much higher load on 3 September, with a readily visible reduction in RUL.
Figure 2: A typical nine day period of transformer load current (blue), with the corresponding RUL (red).
[image:8.595.113.507.513.753.2]Prognostics Under Normal Conditions
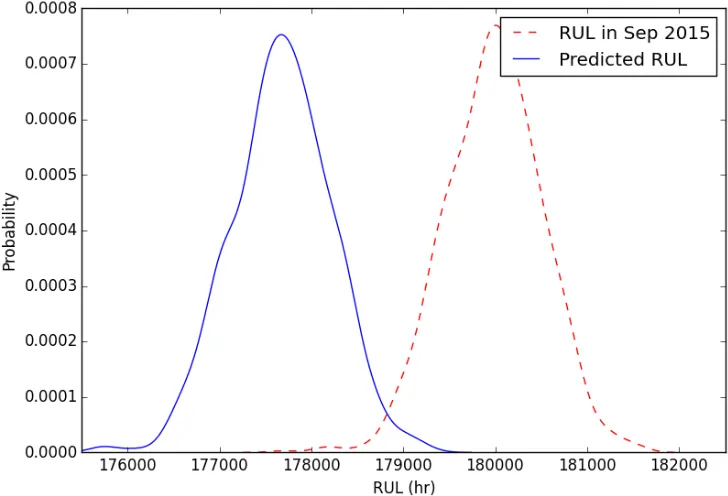
[image:9.595.101.465.282.530.2]After determining RUL to September 2015, the particle filter was used to predict remaining life after a further five years of operation. The existing loading data were assumed to be representative of future loading, and the weather data for all of 2014 were assumed to be representative of future weather conditions. Figure 4 shows the probability density function (PDF) of the RUL in September 2015 in red, and the PDF of the predicted RUL infive years’ time in blue. It can be seen that the overall shape of both distributions remains roughly the same, with similar variance, skew, and kurtosis. The median RUL is predicted to drop by 1,952 hours to 177,679 hours.
Figure 4: Probability density functions of RUL in September 2015 (red), and predicted after a further five years of service (blue).
Prognostics Under Overload Conditions
Figure 5: Load profile over a 20-hr period containing an overload, with corresponding reduction in RUL.
Discussion
The particle filter is a statistical tool which can predict the future health of assets under different operating regimes. While the IEEE equations for transformer paper aging given in C57.91 provide estimates of the effects of load and temperature, they do not include uncertainty estimates. On the other hand the particle filter can enhance the information available by accounting for uncertainty in the precise rate of degradation and in the measurements.
The approach shown here can be extended to include the effects of factors other than temperature on paper aging. Thus an increase in the moisture content of the paper would affect the activation energy of the deterioration process, and therefore the constant value 15,000 in (6). The statistical particle filtering approach could be modified to take account of online moisture sensor data through an appropriate expansion of (6).
The output of the filter is a probability density function, which captures the range of possible values and their probabilities. A deterministic model such as that described in C57.91 will provide a very precise estimate, i.e., a single value, which may however be in error. The probabilistic approach gives a range of values, which is likely to contain the true remaining life value. Further, the probabilistic prediction can be set to be pessimistic, such as taking the 5th percentile, in order to err on the side of avoiding a failure in service.
Prognostic information can assist with various types of decision making within a utility. Most obviously, asset management can benefit from the predicted window of time in which maintenance can successfully avoid a failure. However, prognostics can also be useful in an operational context, by giving extra information about the effects of a possible overload on the health of the assets. Adopting prognostics within a utility offers clear gains over relying on expert judgment, and this topic is expected to drive further fundamental research, case studies, and adoption by industry over the coming years.
Acknowledgment
The authors thank the anonymous reviewers for their insightful comments and their guidance on the quantification of process noise in this application.
References
[1] A. K. S. Jardine, D. Lin, and D. Banjevic, "A review on machinery diagnostics and prognostics," Mechanical Systems and Signal Processing, vol. 20, 2006. [2] G. Vachtsevanos, F. L. Lewis, M. Roemer, A. Hess, and B. Wu, Intelligent Fault
Diagnosis and Prognosis for Engineering Systems: Wiley, 2006.
[3] J. I. Aizpurua and V. M. Catterson, "Towards a Methodology for Design of Prognostic Systems," presented at the Annual Conference of the Prognostics and Health Management Society, Coronado, California, USA, 2015.
[4] K. Goebel, B. Saha, and A. Saxena, "A comparison of three data-driven techniques for prognostics," presented at the Machinery Failure Prevention Techonologies, 2008.
[5] J. Liu, V. Vitelli, R. Seraoui, and E. Zio, "Dynamic Weighted PSVR-Based Ensembles for Prognostics of Nuclear Components," presented at the PHM Europe, Nantes, France, 2014.
[6] S. Rudd, V. M. Catterson, S. D. J. McArthur, and C. Johnstone, "Circuit Breaker Prognostics Using SF6 Data," presented at the IEEE Power and Energy Society General Meeting, Detroit, USA, 2011.
[8] Y. Ling, "Uncertainty quantification in time dependent reliability analysis," PhD, Vanderbilt University, 2013.
[9] M. J. McGhee, G. Galloway, V. M. Catterson, B. Brown, and E. Harrison, "Prognostic Modeling of Valve Degradation within Power Stations," presented at the Annual Conference of the Prognostics and Health Management Society, Fort Worth, USA, 2014.
[10] M. E. Orchard and G. J. Vachtsevanos, "A particle-filtering approach for on-line fault diagnosis and failure prognosis," Transactions of the Institute of Measurement and Control, vol. 31, pp. 221-246, 2009.
[11] M. Daigle, B. Saha, and K. Goebel, "A Comparison of Filter-based Approaches for Model-based Prognostics," presented at the IEEE Aerospace Conference, Big Sky, USA, 2012.
[12] V. M. Catterson, "Prognostic modeling of transformer aging using Bayesian particle filtering," presented at the Conference on Electrical Insulation and Dielectric Phenomena, Des Moines, USA, 2014.
[13] J. Liu and M. West, "Combined parameter and state estimation in simulation-based filtering," in Sequential Monte Carlo Methods in Practice, A. Doucet, N. de Freitas, and N. J. Gordon, Eds., ed: Springer-Verlag, 2001, pp. 197-223. [14] M. S. Arulampalan, S. Maskell, N. Gordon, and T. Clapp, "A tutorial on particle
filters for online nonlinear/non-Gaussian Bayesian tracking," IEEE
Transactions on Signal Processing, vol. 50, pp. 174-188, February 2002 2002. [15] A. Van Schijndel, P. A. A. F. Wouters, and J. M. Wetzer, "Modeling of
replacement alternatives for power transformer populations," IEEE Transactions on Power Delivery, vol. 27, pp. 506-513, April 2012 2012. [16] Task Force D1.01.10, "323: Ageing of Cellulose in Mineral-Oil Insulated
Transformers," CIGRE, 2007.
[17] N. Lelekakis, W. Guo, D. Martin, J. Wijaya, and D. Susa, "A Field Study of Aging in Paper-Oil Insulation Systems," IEEE Electrical Insulation Magazine, vol. 28, pp. 12-19, 2012.
[18] IEEE, "C57.91-2011 IEEE Guide for Loading Mineral-Oil-Immersed
Transformers and Step-Voltage Regulators," ed: IEEE Power & Energy Society, 2011.
[19] C. D. Booth, F. Coffele, and G. M. Burt, "The Power Networks Demonstration Centre: An environment for accelerated testing, demonstration and
validation of existing and novel protection and automation systems," presented at the 12th IET International Conference on Developments in Power System Protection, Copenhagan, Denmark, 2014.
Victoria M. Catterson (SM'12) received the B.Eng. and Ph.D. degrees from the University of Strathclyde, Glasgow, U.K. in 2003 and 2007 respectively. She is currently a Lecturer in the Institute for Energy and Environment, University of Strathclyde, and is the Chair of the IEEE DEIS Technical Committee on Smart Grids. Her research interests include data analytics for condition monitoring, diagnostics, and prognostics in the power industry.
Joseph Melone is an R&D engineer at the Power Networks Demonstration Centre, which is a joint venture between the University of Strathclyde, Scottish Enterprise, the Scottish Funding Council, and UK-based Distribution Network Operators. He obtained a PhD in Nuclear Physics in 2005 from the University of Glasgow and worked as a postdoc developing hardware and software systems for a range of physics experiments. In 2011 he shifted focus to energy systems as part of the Renew-Net Knowledge Exchange initiative, and in 2014 he started work on