1
Cover Page
A Mixed-Method Approach to Extracting the Value of Social Media Data
Hing Kai Chan#
Nottingham University Business School China, University of Nottingham Ningbo China, Ningbo 315100, China.
Tel: +86 574 8818 0964
Email: [email protected]
Xiaojun Wang
Department of Management, University of Bristol,
Bristol BS8 1TN, UK. Tel: +44 (0)117 3310789
Email: [email protected]
Ewelina Lacka
Business School,
University of Strathclyde, Glasgow G4 0QU, UK. Tel: +44 (0)141 548 4801
Email: [email protected]
Min Zhang
2
Abstract
In the last decade, social media platforms have become important communication channels between businesses and consumers. As a result, a lot of consumer-generated data are available online. Unfortunately, they are not fully utilised, partly because of their nature: they are unstructured, subjective, and exist in massive databases. To make use of these data, more than one research method is needed. This study proposes a new, multiple approach to social media data analysis, which counteracts the aforementioned characteristics of social media data. In this new approach the data are first extracted systematically and coded following the principles of content analysis, after a comprehensive literature review has been conducted to guide the coding strategy. Next, the relationships between codes are identified by statistical cluster analysis. These relationships are used in the next step of the analysis, where evaluation criteria weights are derived on the basis of the social media data through probability weighting function. A case study is employed to test the proposed approach.
Keywords: Social media, mixed-method, product innovation, business intelligence, analytics. Received: January 2014; accepted: April 2015 by Jason Choi after four revisions.
1. Introduction
3
from different disciplines, will explore the true value of online data. Those multiple methods of so-called ‘Big Data’ analysis should not only employ OM data analysis techniques, but also combine them with techniques used in disciplines such as marketing or management, which are well-known for their end consumer empirical, and sometimes qualitative, data analysis. Such multiple approaches allow researchers not only to address the need to make use of online data, but also incorporate interdisciplinary knowledge into OM research. Furthermore, the multiple approaches to social media data analysis also allow researchers to respond to recent call for data-driven research in the OM discipline (Simchi-Levi, 2014). This is the first study to propose such a mixed-method approach to handle qualitative social media data for quantitative decision-making.
Section 2 of this study presents a review of social media data research, and Section 3 provides a detailed summary of the above-mentioned data analysis steps. In Section 4, a case study is employed which tests the proposed mixed-method approach for new product development decision-making. The case study is based on data extracted from the SAMSUNG Mobile Facebook page (https://www.facebook.com/SamsungMobile), and is therefore used to develop a product innovation model for smartphone devices. The study concludes with Section 5.
2. Social Media Data Research
2.1 The nature of social media data
4
Social media data are freely available. Collecting it does not require effort or a budget (Hanna et al., 2011). The data are supplied by end users (i.e. customers) who voluntarily share their views and opinions online in the form of qualitative comments (Xiang and Gretzel, 2010). Utilising these comments for business and research purposes, however, is not satisfactory. Gu and Ye (2014) report that, to date, “little research has been done to understand how management should respond to customer reviews in online social media”. Thus, more effort has to be put into the analysis of end users’ comments in order to fully explore the potential of the data. This has recently become particularly important as it is predicted that consumer power will rise due to the availability of social media sites (Labrecque et al., 2013). Thus, companies should not ignore the importance of social media platforms and the value of social media data. On the contrary, they should find an efficient and effective way to analyse and interpret such data in order to react to the information it contains in a timely manner. This, however, is not an easy task due to the inherent pitfalls of social media data – the unstructured, qualitative and subjective views and opinions of end consumers posted on social media platforms (Jang et al., 2013; Malthouse et al., 2013).
Some researchers claim that the above drawbacks can be effectively addressed by systematic analysis of social media datasets, where a hierarchical model is employed to group online comments (Anderson and Joglekar, 2005; Tripathy and Eppinger, 2013). However, defining such a hierarchical model for social media data is a challenge, which this study sets out to address. In particular, this study aims to develop a hierarchical model and test it for a decision-making process in which social media data are used for new product development.
2.2 Social media data and new product development
5
product requirements, preferences and needs is often cited in the literature as a key factor for successful NPD (Von Hippel, 1986; Katila and Ahuja, 2002; Piller and Walcher, 2006). Thus, many researchers (Nambisan, 2002; Hoyer et al., 2010; Fuchs and Schreier, 2011) promote the idea of empowering customers to take a much more active role in the NPD process. This has become more feasible on online (i.e. social media) platforms , where consumers are provided with a “sense of empowerment” (Hoyer et al., 2010) so that they can interact and exchange their views and opinions about the existing product online, while influencing NPD at the same time (Nasbisan, 2002; Sawhney et al., 2005; Piller and Walcher, 2006; Füller et al., 2006).
These online interactions and exchanges of comments online have become a point of interest for NPD researchers. Nasbisan (2002), for instance, develops a theoretical model of customers’ NPD roles (i.e. source and user, or co-creator) in a virtual environment. By comparing it to a traditional perspective on customer involvement in new product development, Sawhney (2005) examines how the Internet can serve as a powerful platform for collaborative innovation with customers. Piller and Walcher (2006) propose Internet-based toolkits for idea competition, in order for manufacturers to access innovative ideas and solutions from users. Through a case study of Audi, Füller et al. (2006) illustrate the applicability of online communities as a platform for customer interaction in order to attain valuable input for NPD.
Despite this noticeable increase in the use of digital technologies to engage customers in the NPD process, very limited attention has been given to social media platforms as a means of extracting customer-generated data to support the NPD process. The study attempts to fill this gap while accomplishing two goals. First, it aims to develop a hierarchical model which, by drawing from different research disciplines, is able to extract true value from end consumer data. Second, it aims to test a developed model for NPD decision-making employing social media data.
2.3 Quantifying social media data
6
systematically coded. This part of the research is exploratory, and is thus facilitated by content analysis, a widely used research method in marketing and management disciplines to analyse qualitative datasets (Carley, 1993; Hsieh and Shannon, 2005; Davies and Joglekar, 2013). This technique is also employed in many social media research studies to convert codified information into a more usable format (e.g. Denecke and Nejdl, 2009; Li et al., 2011).
In line with the principles of content analysis, prior to the analysis of a social media dataset a list of codes is created, based on a comprehensive literature review of the research field. This approach to coding is selected as it is believed to be more objective and more comprehensive than, for example, an expert opinion, or a survey from a consultancy. The list of factors, or codes, serves as a guideline for the social media data coding.
At this stage the limitations of social media data, for example its lack of structure or its subjectivity, must be overcome in order to accurately interpret it and thus extract its actual value (Trusov et al., 2009). To achieve this goal, statistical cluster analysis is conducted to form a hierarchical decision-making model. Through cluster analysis, similar codes are grouped together for later decision-making analysis. This procedure is called relational analysis, and is similar to the decomposition method for conceptual product design proposed by Mullens et al. (2005). Although Mullens et al. (2005) make use of the “Quality Function Deployment” model, and this research makes use of the Multi-Criteria Decision-Analysis (MCDA) method, the final output of both methods is similar. This is confirmed by Anderson and Joglekar (2005), who also use a hierarchical model for NPD.
7
hierarchical model is formed by means of the clusters. The corresponding importance weight between factors is evaluated using the PWF, as discussed above. An MCDA method is then applied to evaluate alternative new product designs.
Based on the above procedure, this study proposes a mixed-method approach to address the challenge of extracting the true value of social media data for decision-making. There are a number of theoretical and managerial implications in doing so. First, the proposed approach for social media data mining overcomes the limitations of data generated by end consumers on social media platforms, converting it to useful information for decision-makers. Moreover, it applies the PWF with regards to social media data. Finally, this is the first study which uses social media data (i.e. customer inputs) to help construct a decision-making model for NPD. The details of the integrated methodology are discussed in Section 3.
3. Research methodology
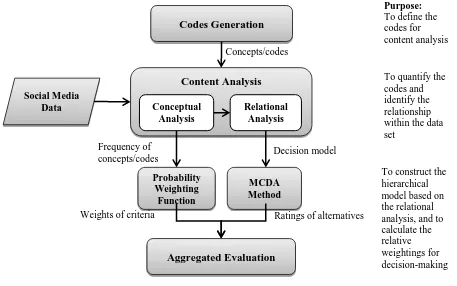
As discussed in Section 2, the proposed approach to social media data analysis incorporates the following steps: a comprehensive literature review, content analysis of social media data; a probability weighting function; and a MCDA method. The proposed procedure is presented in Figure 1 and its details are discussed in the subsequent sections below.
3.1 Codes generation
A literature review is defined by Fink (1998) as “a systematic, explicit, and reproducible design for identifying, evaluating, and interpreting the existing body of recorded documents”. Tranfield et al.
8
[image:8.595.65.522.116.402.2]review is a reliable means to identify key themes in a field of study, which in turn can guide qualitative data analysis.
Figure 1.Illustration of proposed methodology
In this approach to social media data analysis a comprehensive literature review is used to identify key themes relevant to product innovation management and, later, factors related to each theme. The identified factors will be used as codes for the content analysis of the social media data set. This first step of the proposed approach is of particular importance, as it aims to organise data according to codes identified in the literature, thus addressing the limitations of social media data deriving from its unstructured nature.
3.2 Content analysis of social media data
Although factors identified on the basis of a literature review are often used as decision model constructs, in this study they are used as codes for content analysis and further cluster analysis. This aims to preserve consumers’ ‘sense of empowerment’, where consumers’ views and opinions are taken into consideration when developing new research models. Thus, by incorporating content
Codes Generation
Content Analysis
Conceptual Analysis
Relational Analysis
Probability Weighting
Function
MCDA Method
Aggregated Evaluation Social Media
Data
Concepts/codes
Decision model Frequency of
concepts/codes
Weights of criteria Ratings of alternatives
Purpose: To define the codes for content analysis
To quantify the codes and identify the relationship within the data set
9
analysis of social medal data in the development of the decision model, this research addresses the limitations of previous models, which do not consider consumer input into decision-making.
The content analysis consists of two parts. The first, conceptual analysis, is used to establish the existence and frequency of factors in the dataset, and thus involves the selective reduction of comments into meaningful units (codes). It is followed by the second part, relational analysis, which examines relationships between codes. In order to statistically verify these relationships, the Pearson Correlation Coefficient is used to represent the similarity indexes between pairs of factors. The complete linkage clustering approach, one of the hierarchical clustering methods, is employed to evaluate the data based on the similarity and frequency of occurrence (so called the “distance” between clusters) when clusters are combined. Initially, each factor is in a cluster of its own, and then clusters with the shortest “distance” are merged (Peng and Liu, 2015). The outcome of this part is a hierarchy of clusters, which can then be adopted for later MCDA.
3.3 Weights calculation using the probability weighting function (PWF)
After the relational analysis, it is imperative to measure the importance of decision factors based on the social media dataset. There are many weighting methods to facilitate this process including MCDA approaches such as Analytic Hierarchy Process (AHP) or Analytical Network Process (ANP), and text representation approaches such as term frequency/inverse document frequency (TF-IDF) or Latent Sematic Indexing (LSI). In this research, the probability weighting function (PWF) is used to calculate the weights of evaluation criteria.
A PWF, w(p), allows probabilities to be weighted non-linearly. Previous empirical studies of the weighting function show that w(p) is regressive (first w(p) > p, then first w(p) < p), s-shaped (first concave and then convex), and asymmetrical (Tversky and Kahneman, 1992; Wu and Gonzalez, 1996; Prelec, 1998). There are many versions of PWF. In this study, Prelec (1998) PWF is adopted and is expressed as:
10
Here, [ ] is the probability of occurrence of a relevant factor in the studied dataset, and α (0< α <1)is the standard parameter in PWF. The Prelec (1998) PWF has the following merits: parsimony; consistency with much of the available empirical evidence; and an axiomatic foundation. For a decision criterion, Ci, that contains n items, the criterion weight can be calculated as:
∑ ( ) (2)
in which pij is the probability of concurrence of jth item in criterion Ci.
This method is particularly useful for assigning a weight to each criterion while analysing social media data, because it does not require an individual decision-maker to rank the criteria. As a result, decision makers can use real data from end consumers to calculate the weights. In comparison to other MCDA approaches, which require expert judgement in determining relative weightings, this is a more effective weighting technique, since the calculation is based on frequency of occurrence of relevant user comments. Moreover, it is more appropriate in studies that aim to retain a “consumer sense of empowerment” in the decision-making process.
3.4 Evaluating alternatives using MCDA methods
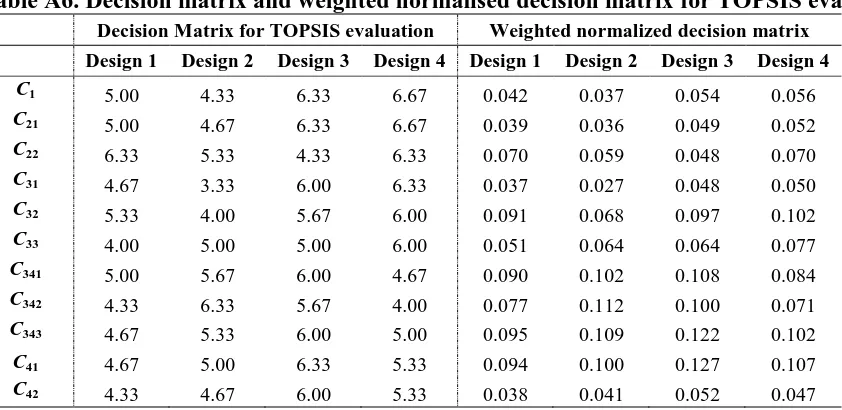
After constructing a decision model and estimating evaluation criteria weights, the preference between alternative options has to be determined. In order to incorporate all the decision criteria in the evaluation, it is essential to know how good one alternative is over another in relation to a particular evaluation criterion. At this stage many MCDA methods can be applied, such as AHP, fuzzy AHP, Technique for Order Preference by Similarity to Ideal Solution (TOPSIS), and so on. However, without Steps 3.1 to 3.3 outlined in previous sub-sections, one is unable to apply the methods for making any decisions. This is also the main contribution of this paper.
11
main concept of TOPSIS is to define the positive ideal solution and the negative ideal solution. The most preferred alternative should be closest to the positive ideal solution and furthest from the negative ideal solution. The mathematical procedures of the three MCDA methods have been well reported in the literature (Saaty, 1980; Van laarhoven and Pedrycz, 1983; Buckley, 1985; Hwang and Yoon, 1981; Chamodrakas et al., 2009). The authors would like to stress that the proposed approach is not limited to using AHP, Fuzzy AHP or TOPSIS. The authors simply make use of them as demonstration, and results from these three methods are listed in the next section.
4. Case Study
In order to test the proposed approach to social media data analysis for NPD decision-making, social media data from the official Samsung Mobile Facebook page was extracted using the NCapture tool of NVivo 10 software. Two months’ worth of data in the form of consumer comments were downloaded for the analysis; in total, 86,055 comments were downloaded. These ranged from general enquiries by Samsung consumers to queries related to a particular Samsung smart phone model, and included comments posted in all languages. In order to keep the focus of this research project on NPD, it was decided to extract comments related to the latest Samsung smart phone model, the Samsung Galaxy S4. To ensure a good understanding of the comments and thus accurate content analysis, only comments posted in English were considered, as English is the common language shared with the researchers. With this imposed control, 1,674 comments in English related to the Samsung Galaxy S4 model were used for the final analysis.
4.1 Selecting the proper factors for new product development
12
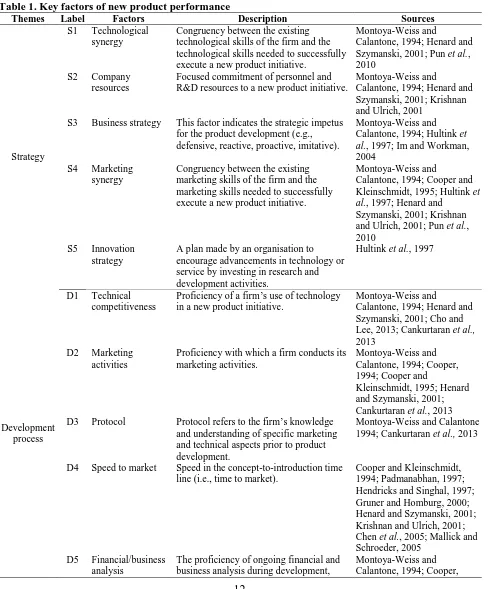
[image:12.595.58.549.195.784.2]five concepts as the five main themes to which specific factors (codes) are integrated. Focusing on the relevant literature in the last twenty years, a comprehensive list of evaluation criteria was generated for the purpose of new product performance measurement. The review results are displayed in Table 1. The list of NPD factors is used as a guideline for conducting content analysis considering consumer input.
Table 1. Key factors of new product performance
Themes Label Factors Description Sources
Strategy
S1 Technological synergy
Congruency between the existing technological skills of the firm and the technological skills needed to successfully execute a new product initiative.
Montoya-Weiss and
Calantone, 1994; Henard and Szymanski, 2001; Pun et al., 2010
S2 Company resources
Focused commitment of personnel and R&D resources to a new product initiative.
Montoya-Weiss and
Calantone, 1994; Henard and Szymanski, 2001; Krishnan and Ulrich, 2001
S3 Business strategy This factor indicates the strategic impetus for the product development (e.g., defensive, reactive, proactive, imitative).
Montoya-Weiss and Calantone, 1994; Hultink et al., 1997; Im and Workman, 2004
S4 Marketing synergy
Congruency between the existing marketing skills of the firm and the marketing skills needed to successfully execute a new product initiative.
Montoya-Weiss and
Calantone, 1994; Cooper and Kleinschmidt, 1995; Hultink et al., 1997; Henard and
Szymanski, 2001; Krishnan and Ulrich, 2001; Pun et al., 2010
S5 Innovation strategy
A plan made by an organisation to encourage advancements in technology or service by investing in research and development activities.
Hultink et al., 1997
Development process
D1 Technical competitiveness
Proficiency of a firm’s use of technology in a new product initiative.
Montoya-Weiss and
Calantone, 1994; Henard and Szymanski, 2001; Cho and Lee, 2013; Cankurtaran et al.,
2013 D2 Marketing
activities
Proficiency with which a firm conducts its marketing activities.
Montoya-Weiss and Calantone, 1994; Cooper, 1994; Cooper and
Kleinschmidt, 1995; Henard and Szymanski, 2001; Cankurtaran et al., 2013 D3 Protocol Protocol refers to the firm’s knowledge
and understanding of specific marketing and technical aspects prior to product development.
Montoya-Weiss and Calantone 1994; Cankurtaran et al., 2013
D4 Speed to market Speed in the concept-to-introduction time line (i.e., time to market).
Cooper and Kleinschmidt, 1994; Padmanabhan, 1997; Hendricks and Singhal, 1997; Gruner and Homburg, 2000; Henard and Szymanski, 2001; Krishnan and Ulrich, 2001; Chen et al., 2005; Mallick and Schroeder, 2005
D5 Financial/business analysis
The proficiency of ongoing financial and business analysis during development,
13
prior to commercialisation and full-scale launch.
1994; Carrillo, 2005 D6 Cost Development cost, including measures of
production, R&D or marketing cost overruns or expenditures.
Cooper, 1994; Carrillo, 2005; Chen et al., 2005; Mallick and Schroeder, 2005; Pun and Chin, 2005
D7 Design and testing
Product design, and performance testing and validation.
Krishnan and Ulrich, 2001; Pun and Chin, 2005; Cankurtaran et al., 2013 D8 Process
development and improvement
Employment of formalised product development procedures.
Pun and Chin, 2005; Pun et al., 2010
D9 Well-defined plan/roadmap
Well-defined plan roadmap to developing new product(s).
Cooper and Kleinschmidt, 1995; Carrillo, 2005; Pun and Chin, 2005; Cho and Lee, 2013
D10 Customer input Incorporation of customer specifications into a new product initiative
Henard and Szymanski, 2001; Ernst, 2002;Pun et al., 2010; Cankurtaran et al., 2013 D11 Product launch Proficiency with which a firm launches the
product
Hendricks and Singhal, 1997; Hultink et al., 1997;
Padmanabhan et al., 1997; Gruner and Homburg, 2000; Henard and Szymanski, 2001; Krishnan and Ulrich 2001; D12 Process
concurrency
Synchronization of activities of multiple processes, requireing good communication between processes.
Chen et al., 2005; Cankurtaran
et al., 2013
Market environment
M1 Market potential Anticipated growth in customers/customer demand in the marketplace.
Montoya-Weiss and Calantone, 1994; Hultink et al., 1997; McGrath, 1997; Boer, 1998; Henard and Szymanski, 2001 M2 Market
competition
Degree, intensity or level of competitive response to a new product introduction.
Montoya-Weiss and Calantone, 1994; Hultink et al., 1997; Slater and Narver, 1998; Henard and Szymanski, 2001; Cankurtaran et al., 2013 M3 Market turbulence The factor refers to the rate of change in
the composition of customers’ needs and preferences.
Montoya-Weiss and
Calantone, 1994; Henard and Szymanski, 2001; Carrillo, 2005; Chen et al., 2005; Pun et al.,2010
M4 Entry barriers The factor refers to obstacles that make it difficult to enter a given market.
Slater and Narver, 1998; Cho and Lee, 2013; Cankurtaran et al.,2013
M5 Customer needs Expectations and requirements from customers when purchasing the product.
Mishra et al., 1996; Henard and Szymanski, 2001; Pun and Chin, 2005; Cho and Lee, 2013
M6 Legal regulation This factor refers to regulations that could affect the product development, e.g. environmental issues.
Cho and Lee, 2013
M7 Technological turbulence
This factor refers to the rate of change associated with technology used to develop new products in an industry.
Chen et al.,2005; Cankurtaran
et al., 2013
Organisational
O1 Internal and external relations
This factor refers to the coordination and cooperation within and between firms.
Montoya-Weiss and
14
and across departments in a new product initiative.
Ernst, 2002; Pun and Chin, 2005
O3 Experience and competencies
An organisation’s experience and alignment with core competencies.
Cankurtaran et al., 2013 O4 Organisational
support
Degree of senior management support for a new product initiative.
Montoya-Weiss and
Calantone, 1994; Souder and Song, 1998; Henard and Szymanski, 2001; Ernst, 2002; Bastic, 2004; Cankurtaran et al., 2013
O5 Organisational integration
Degree of multiple-department
participation in a new product initiative.
Ernst, 2002; Chen et al., 2005; Cankurtaran et al., 2013 Q6 Organisational
structure
This includes measures of organisational climate, size, centralisation, reward structure and job design.
Montoya-Weiss and Calantone, 1994; Pun and Chin, 2005; Cankurtaran et al., 2013
Product
P1 Quality The product’s ability to perform its primary function.
Gruner and Homburg, 2000; Pun and Chin, 2005; P2 Product
advantage
Superiority and/or differentiation over competitive offerings.
Montoya-Weiss and Calantone, 1994; Hultink et al., 1997; Henard and Szymanski, 2001; Pun and Chin, 2005
P3 Product price Perceived price-performance congruency (i.e. value).
Hultink et al., 1997; Henard and Szymanski, 2001 P4 Product meets
customer needs
Extent to which a product is perceived to satisfy the desires/needs of the customer.
Gruner and Homburg, 2000; Henard and Szymanski, 2001 P5 Product
technological performance
Perceived technological sophistication (e.g., high-tech, low-tech) of the product.
Gruner and Homburg, 2000; Henard and Szymanski, 2001; Mallick and Schroeder, 2005 P6 Product
innovativeness
Perceived newness/originality/uniqueness/ radicalness of the product
Hultink et al., 1997; Henard and Szymanski, 2001 4.2 Content analysis results
For the purpose of this research a two-step content analysis was carried out, as described in Section 3.2 above. First, the conceptual analysis was conducted. Factors revealed during the comprehensive literature review served as codes to guide the conceptual analysis. Next, to avoid subjectivity of the analysis, the definition of each factor/code was provided (see Table 1).
15
conducting the conceptual analysis has extensive knowledge and skills in carrying out qualitative research.
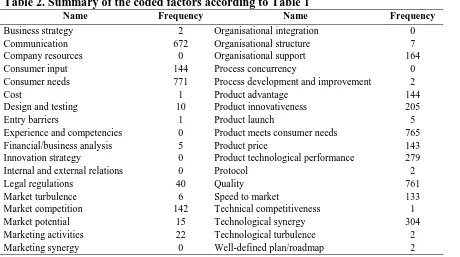
[image:15.595.53.513.227.484.2]Following this methodology, data in the form of consumer-generated comments extracted from Samsung Mobile’s Facebook page were analysed. Each comment was analysed individually. The conceptual analysis of 1,674 comments revealed the following frequency of concepts (see Table 2). This serves as a base for a hierarchical evaluation model.
Table 2. Summary of the coded factors according to Table 1
Name Frequency Name Frequency
Business strategy 2 Organisational integration 0
Communication 672 Organisational structure 7
Company resources 0 Organisational support 164
Consumer input 144 Process concurrency 0
Consumer needs 771 Process development and improvement 2
Cost 1 Product advantage 144
Design and testing 10 Product innovativeness 205
Entry barriers 1 Product launch 5
Experience and competencies 0 Product meets consumer needs 765
Financial/business analysis 5 Product price 143
Innovation strategy 0 Product technological performance 279
Internal and external relations 0 Protocol 2
Legal regulations 40 Quality 761
Market turbulence 6 Speed to market 133
Market competition 142 Technical competitiveness 1
Market potential 15 Technological synergy 304
Marketing activities 22 Technological turbulence 2 Marketing synergy 0 Well-defined plan/roadmap 2
In the coding process, it was possible to code one comment using multiple codes, as presented in the following examples:
1. ‘Brother plz tell me the update price of galaxy s3 and s4 16 GB version.if there is any kind of
guarantee plz tell me!!’
- Technological synergy –‘update price of galaxy s3 and s4 16 GB version’ – the consumer recognises
congruency between the Samsung Galaxy S3 model and the Samsung Galaxy S4 model.
- Legal regulation – ‘any kind of guarantee’ – the consumer asks about legal restrictions related to product
guarantee
- Product price – ‘tell me the update price’ – consumer asks about the product price
16
- Communication –‘How do I use the video calling on my S4 mini please’ – consumer encourages
communication with the company
- Product Advantage – ‘the video calling on my S4 mini’ – consumer comments on product feature
- Product Technological Performance – ‘use the video calling’ – consumer comment relates to product
performance
- Product Innovativeness – ‘video calling’ – consumer refers to new innovative feature
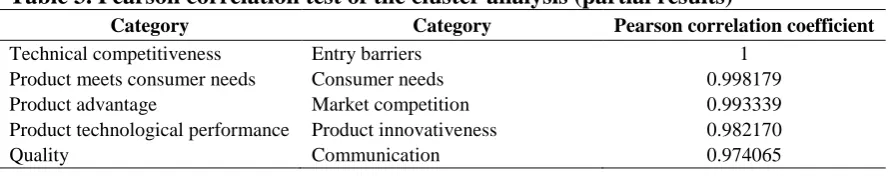
[image:16.595.52.499.687.775.2]Following the conceptual analysis, relational analysis was carried out to examine relationships between concepts with statistical accuracy. At this stage, cluster analysis was employed with the help of NVivo 10 software. The significant results of cluster analysis, assessed on the basis of the Pearson Correlation Coefficient test and scoring 0.9 or above, are presented in Table 3.
As can be seen from the results above, all factors (codes) of new product development are analysed for correlation with each other. Interestingly, when looking at individual factors it is obvious that not all factors are highly correlated with each other. The most closely correlated factors come from the ‘Product’ category: namely ‘Quality’; ‘Product advantage’; ‘Product price’; ‘Product meets consumer needs’; ‘Product technological performance’; and ‘Product innovativeness’. Those items are correlated with two items from the ‘Organisational’ category: ‘Communication’ and ‘Organisational support’. The third category in which items are correlated with the above-mentioned factors is ‘Market environment’: the correlated items are ‘Market competition’; ‘Entry barriers’; ‘Consumer needs’; and ‘Legal regulations’. It was further found that the items within the ‘Organisational’ category, especially ‘Communication’ and ‘Organisational support’, are also correlated with each other. Finally, ‘Technical competitiveness’ within the ‘Development process’ category and ‘Technological synergy’ in the ‘Strategy’ category are also highly correlated.
Table 3. Pearson correlation test of the cluster analysis (partial results)
Category Category Pearson correlation coefficient
Technical competitiveness Entry barriers 1
Product meets consumer needs Consumer needs 0.998179 Product advantage Market competition 0.993339 Product technological performance Product innovativeness 0.982170
17
Product technological performance Product meets consumer needs 0.970961 Product technological performance Consumer needs 0.969917
Quality Consumer needs 0.969344
Quality Product meets consumer needs 0.968672 Product technological performance Communication 0.966433
Consumer needs Communication 0.963858
Product meets consumer needs Communication 0.963807 Quality Product technological performance 0.960613 Product technological performance Consumer input 0.959929 Product innovativeness Consumer input 0.954355 Product meets consumer needs Product innovativeness 0.953120 Product innovativeness Consumer needs 0.950787
Quality Product price 0.950493
Quality Organisational support 0.944644
Product innovativeness Communication 0.943133
Product advantage Consumer needs 0.942616
Product meets consumer needs Product advantage 0.942462
Quality Product advantage 0.940823
Technological synergy Speed to market 0.938727 Product technological performance Product advantage 0.938218
Consumer input Communication 0.936907
Product price Consumer needs 0.935859
Product price Organisational support 0.935111 Product meets consumer needs Consumer input 0.934062 Product meets consumer needs Market competition 0.933809
Market competition Consumer needs 0.933606
Product price Product meets consumer needs 0.932992
Consumer needs Consumer input 0.931519
Quality Market competition 0.931010
Product technological performance Market competition 0.927522
Technological synergy Communication 0.925753
Quality Consumer input 0.924078
Product price Product advantage 0.921377
Technological synergy Consumer input 0.918934 Product advantage Organisational support 0.918029
Quality Product innovativeness 0.917551
Product price Market competition 0.916997
Technological synergy Product technological performance 0.914125 Product innovativeness Product advantage 0.913672 Organisational support Market competition 0.913360 Product technological performance Product price 0.910524
Product price Communication 0.909790
Product advantage Communication 0.905783
Product innovativeness Market competition 0.904221 Technological synergy Product innovativeness 0.902046
18
service, which should be guaranteed. Finally, it is revealed that consumers look for highly innovative products, and are aware of competition in that market.
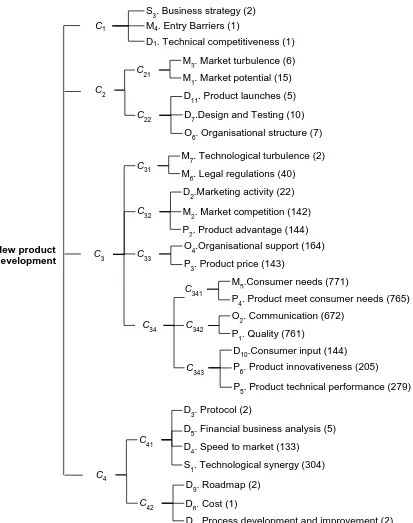
So far, the social media data analysis of the case study makes it apparent that Samsung, while focusing on the development of new products with advanced technology, is likely to meet consumers’ needs and sustain its market position. Effective communication with its consumers and provision of high-quality consumer service is also indicated as a key to competitive advantage. A hierarchical decision model can be developed based on the similarities among, and frequency of occurrence of, the decision factors, which is illustrated in Figure 2.
The advantage of such an analysis is that the number of evaluation criteria can be reduced by removing the items that are not relevant to the selected product, and grouping items that show a high positive relationship with one evaluation criterion. For instance, ‘product meet customer needs’ (P4) is highly related to another measure, namely, ‘customer needs’ (M5) in the marketing category,
as their Pearson Correlation Coefficient (0.998) is very high. The results from the cluster analysis confirm this assertion, as P4 and M5 are grouped as one evaluation criterion.
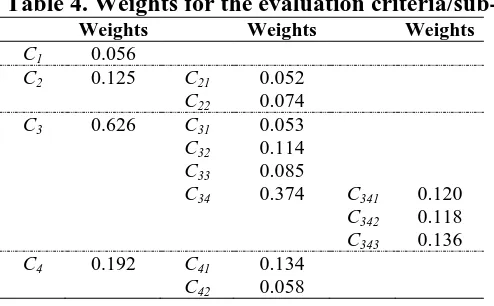
4.3 Weights calculation
Once the decision model is developed, it is essential to know how important each criterion is. Here, the importance weights were calculated using Prelec (1998) PWF discussed in Section 3.3. First,
19
Figure 2. Hierarchical decision model for new product development evaluation
4.4 Evaluation of alternative designs
To demonstrate how MCDA methods can be applied to select alternatives or to make decisions, four alternative design options are considered. While the four designs share some common features, for instance the Android operating system, processor and high resolution screen display, they also display some differences, as described in Table 5.
P4. Product meet consumer needs (765)
New product development
C1
S3. Business strategy (2)
M4. Entry Barriers (1)
D1. Technical competitiveness (1)
C2 C21 C22
D11. Product launches (5)
M3. Market turbulence (6)
M1. Market potential (15)
D7.Design and Testing (10)
O6. Organisational structure (7)
C3 C31 C32 C33
M2. Market competition (142)
P2. Product advantage (144)
O4.Organisational support (164)
P3. Product price (143)
M7. Technological turbulence (2)
M6. Legal regulations (40)
D
2.Marketing activity (22)
C34 C342 C343
O2. Communication (672)
P1. Quality (761)
D10.Consumer input (144)
P6. Product innovativeness (205)
C341
M5.Consumer needs (771)
P5. Product technical performance (279)
C4
C41
D3. Protocol (2)
D5. Financial business analysis (5)
D4. Speed to market (133)
C42
D9. Roadmap (2)
D6. Cost (1)
D8. Process development and improvement (2)
S1. Technological synergy (304)
20
Table 4. Weights for the evaluation criteria/sub-criteria
Weights Weights Weights
C1 0.056
C2 0.125 C21 0.052
C22 0.074
C3 0.626 C31 0.053
C32 0.114
C33 0.085
C34 0.374 C341 0.120
C342 0.118
C343 0.136
C4 0.192 C41 0.134
C42 0.058
Table 5. Key design features between the four design options
Design options Key differences
Design 1 Design 1 is an updated version of the previous model, with a new Android operating system, an improved processor and a higher-resolution screen display, but with no other new features.
Design 2 Design 2 adopts the latest processor technology that provides faster GPU and CPU performance. It enables users to do more, longer and faster than before, but does not add other new features.
Design 3 In addition to the core updated functions, Design 3 also includes other key features that many consumers demand, such as longer battery life and an enhanced camera function that makes it easy to take rich photos and videos.
Design 4 While sharing similar features, Design 4 has subdued processing performance and a less powerful camera. But it is a cheaper option.
Three academics with expert knowledge in operations management, engineering and marketing were asked to complete the questionnaires required for the evaluation of alternative design options, using AHP, fuzzy AHP and TOPSIS respectively. For AHP and fuzzy AHP, the consistency ratio of each judgement was also calculated and checked, to ensure that it is lower than or equal to 0.1. The analysis steps involved in each method are provided in the appendix, and the final results are described in Table 6.
21
Table 6. Evaluation results from three different MCDA approaches
AHP FAHP TOPSIS
AI Rankings AI Rankings AI (Cci) Rankings
Design 1 0.189 4 0.185 4 0.224 4
Design 2 0.228 3 0.224 3 0.260 3
Design 3 0.300 1 0.303 1 0.857 1
Design 4 0.282 2 0.287 2 0.590 2
4.5 Effect of the PWF parameter, α
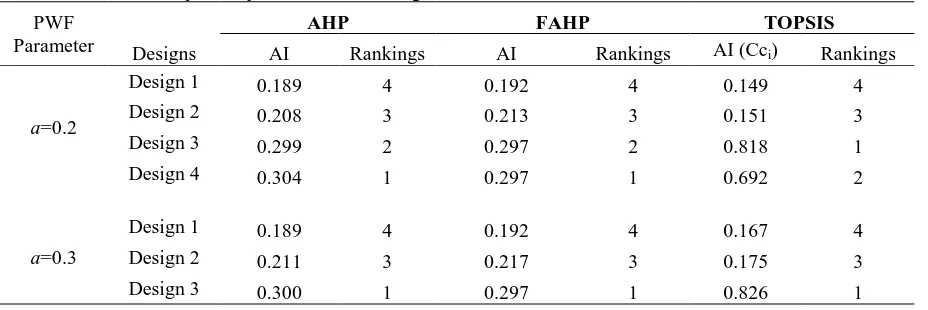
Since the weighting of decision criteria often plays an important role in MCDA problems, further analysis was conducted to examine the influence of probability weighting function parameter α on the evaluation result. Different sets of parameter values were used in the analysis, and the results are presented in Table 7.
The analysis results show that if the variation of the PWF parameter values is not set at too extreme a value, it has little impact on the selection decision of the alternative design options. To be precise, Table 7 indicates that the same decision remains unchanged if α is varied from 0.3 to 0.7 on all MCDA methods. In contrast, it will affect the ranking order if the parameter α significantly deviates from the chosen middle value (i.e. 0.5). In Table 7, this occurs when α is equal to 0.3 and 0.8. More specifically, the results suggest that decision-makers overweigh low probabilities and underweigh high probabilities if the parameter value is low (close to 0). In contrast, the results suggest that decision-makers underweigh low probabilities and overweigh high probabilities if the parameter value is high (close to 1). The recommendation is that α should be set close to 0.5 unless there is a good reason to under- or over-weigh either low or high probabilities.
Table 7. Sensitivity analysis of the PWF parameter
PWF Parameter
AHP FAHP TOPSIS
Designs AI Rankings AI Rankings AI (Cci) Rankings
a=0.2
Design 1 0.189 4 0.192 4 0.149 4
Design 2 0.208 3 0.213 3 0.151 3
Design 3 0.299 2 0.297 2 0.818 1
Design 4 0.304 1 0.297 1 0.692 2
a=0.3
Design 1 0.189 4 0.192 4 0.167 4
Design 2 0.211 3 0.217 3 0.175 3
[image:21.595.56.520.619.774.2]22
Design 4 0.300 2 0.294 2 0.670 2
a=0.4
Design 1 0.187 4 0.191 4 0.191 4
Design 2 0.217 3 0.221 3 0.210 3
Design 3 0.301 1 0.298 1 0.839 1
Design 4 0.295 2 0.289 2 0.638 2
a=0.5
Design 1 0.185 4 0.189 4 0.224 4
Design 2 0.224 3 0.228 3 0.260 3
Design 3 0.303 1 0.300 1 0.857 1
Design 4 0.287 2 0.282 2 0.590 2
a=0.6
Design 1 0.183 4 0.187 4 0.266 4
Design 2 0.235 3 0.237 3 0.333 3
Design 3 0.305 1 0.302 1 0.882 1
Design 4 0.277 2 0.273 2 0.523 2
a=0.7
Design 1 0.180 4 0.185 4 0.312 4
Design 2 0.248 3 0.249 3 0.428 3
Design 3 0.309 1 0.306 1 0.914 1
Design 4 0.264 2 0.260 2 0.432 2
a=0.8
Design 1 0.176 4 0.182 4 0.359 3
Design 2 0.264 2 0.263 2 0.542 2
Design 3 0.313 1 0.309 1 0.947 1
Design 4 0.247 3 0.245 3 0.321 4
5. Conclusions
5.1 Contributions of this study
Application of social media platforms for business purposes is continuously growing. Consumers are encouraged to exchange their views and opinions regarding products and services via such channels. This generates a huge volume of potentially useful data. Unfortunately, the true value of such data has not been realised, and thus companies potentially miss out on opportunities to gain competitive advantages and ensure sustainable growth in highly competitive markets.
23
be leveraged for OM decision-making (e.g. NPD). The proposed approach considers the ‘consumer’s voice’ while making key strategic decisions preserving their ‘sense of empowerment’. This is the first study to address this issue.
Furthermore, this study opens avenues for a new data-driven research stream in the OM research field (Delage and Ye, 2010; Simchi-Levi, 2014). While data-driven research is not a new approach (see, for example, Braca et al. (1997)), it was not possible to apply such approaches easily in the past. This study provides a solution to this problem while utilising data-driven research for social media data analysis. This application of data-driven research is novel and of particular importance today, due to the growing amount of available data and the enhancement in computational power derived from the advancement of digital technology.
Application of the proposed approach also leads to theoretical as well as practical contributions, thus bridging the gap between theoretical research and practical needs. For example, in the case study in this research project, the extension of the proposed model is highly practical, mainly due to the nature of the data source, which is customer-oriented.
5.2 Implications and future research
The purpose of this study was to develop a new approach to facilitate the utilisation of social media data to support OM decisions. By fulfilling this purpose, the study makes significant contributions to several important and interrelated research fields.
First, acquiring information from users/customers about their preferences, requirements and needs is often emphasized as a prerequisite for successful NPD (Katila and Ahuja, 2002; Piller and Walcher, 2006). Traditionally, the collection of such information was costly in terms of both time and money. The proposed approach allows organisations to be more economical, through the utilisation of data freely available online. This research proposes an effective and efficient approach to social media data analysis for decision-making processes.
24
management areas, including product and service innovations, market research and orientation, and organisational learning, where the ‘consumer’s voice’ needs to be heard. Our study explores the capabilities and true value of a mixed-method approach in handling social media data.
Despite the benefits of the proposed approach above, this research has limitations which could lead to future research opportunities. For example, whilst this research develops a mixed-method approach to analyse social media data for OM, there are also opportunities to apply it to other management areas as discussed above. This may require the incorporation of other methods, subject to the nature of the management problem. Moreover, although the probability weighting method has proven to be a more effective weighting method as it is used for calculating weights based on the social media data, decision makers have to make subjective judgements while deciding which alternative design to select. Therefore, one future research direction is to consider a more data-driven evaluation technique, such as Data Envelopment Analysis, to compare alternative design options.
References:
Akar, E., B. Topçu. 2011. An examination of the factors influencing consumers' attitudes toward social media marketing. Journal of Internet Commerce10(1) 35-67.
Anderson, E.G., N.R. Joglekar. 2005. A hierarchical product development planning framework.
Production and Operations Management14(3) 344-361.
Bastic, M. 2004. Success factors in transition countries. European Journal of Innovation Management7(1) 65-79.
Boer, F.P. 1998. Traps, pitfalls and snares in the valuation of technology. Research Technology Management41 45-54.
Braca, J., J. Bramel, B. Posner, D. Simchi-Levi. 1997. A computerized approach to the New York City school bus routing problem. IIE transactions29(8) 693-702.
25
Buckley, J. 1985. Fuzzy hierarchical analysis. Fuzzy Sets and Systems17 233-247.
Cankurtaran, P., F. Langerak, A. Griffin. 2013. Consequences of New Product Development Speed: A Meta‐Analysis. Journal of Product Innovation Management30(3) 465-486.
Carley, K. 1993. Coding choices for textual analysis: A comparison of content analysis and map analysis. Sociological methodology 23 75-126.
Carrillo, J.E. 2005. Industry clockspeed and the pace of new product development. Production and Operations Management14(2) 125-141.
Chamodrakas, I., N. Alexopoulou, D. Martakos. 2009. Customer evaluation for order acceptance using a novel class of fuzzy methods based on TOPSIS. Expert Systems with Applications 36(4) 7409-7415.
Chan, H.K., X. Wang, G. White, Y. Nick. 2013. An Extended Fuzzy AHP approach for the evaluation of green product designs. IEEE Transactions on Engineering Management 60(2) 327-339.
Chen, J., R.R. Reilly, G.S. Lynn. 2005. The impacts of speed-to market on new product success: The moderating effects of uncertainty. IEEE Transactions on Engineering Management 52(2) 199-212.
Cho, J., J. Lee. 2013. Development of a new technology product evaluation model for assessing commercialization opportunities using Delphi method and fuzzy AHP approach. Expert System with Applications40(13) 5314-5330.
Cooper, R.G. 1994. New products: The factors that drive success. International Marketing Review 11(1) 60-76.
Cooper, R.G., E.J. Kleinschmidt. 1994. Determination of timeliness in product development.
Journal of Product Innovation Management, 10, 112-125.
Cooper, R.G., E.J. Kleinschmidt. 1995. Benchmarking the firm's critical success factors in new product development. Journal of product innovation management12(5) 374-391.
26
Evidence from the Solar Energy Industry. Production and Operations Management 22(6) 1494-1508.
Delage, E., Y. Ye. 2010. Distributionally robust optimization under moment uncertainty with application to data-driven problems. Operations Research58(3) 595-612.
Denecke, K., W. Nejdl. 2009. How valuable is medical social media data? Content analysis of the medical web. Information Sciences179(12) 1870-1880.
Ernst, H. 2002. Success factors of new product development: a review of the empirical literature.
International Journal of Management Reviews 4(1) 1-40.
Ellison, N.B. 2007. Social network sites: Definition, history, and scholarship. Journal of Computer‐ Mediated Communication13(1) 210-230.
Fink, A. 1998. Conducting research literature reviews: from paper to the internet, Sage, Thousand Oaks.
Flynn, B.B., S. Sakakibara, R.G. Schroeder, K.A. Bates, E.J. Flynn. 1990. Empirical research methods in operations management. Journal of operations management9(2) 250-284.
Fortun, M., S.S. Schweber. 1993. Scientists and the legacy of World War II: The case of operations research (OR). Social Studies of Science23(4) 595-642.
Fuchs, C., M. Schreier. 2011. Customer empowerment in new product development. Journal of Product Innovation Management28(1) 17-32.
Füller, J., M. Bartl, H. Ernst, H. Mühlbacher. 2006. Community based innovation: How to integrate members of virtual communities into new product development. Electronic Commerce Research 6(1) 57-73.
Gruner, K.E., C. Homburg. 2000. Does customer interaction enhance new product success? Journal of business research49(1) 1-14.
27
Hanna, R., A. Rohm, V.L. Crittenden. 2011. We’re all connected: The power of the social media ecosystem. Business Horizons54(3) 265-273.
Henard, D.H., D.M. Szymanski. 2001. Why some new products are more successful than others.
Journal of marketing Research38(3) 362-375.
Hendricks, K.B., V.R. Singhal. 1997. Delays in new product introductions and the market value of the firm: The consequences of being late to the market. Management Science43(4) 422-436. Hoyer, W.D., R. Chandy, M. Dorotic, M. Krafft, S.S. Singh. 2010. Consumer cocreation in new
product development. Journal of Service Research13(3) 283-296.
Hsieh, H.F., S.E. Shannon. 2005. Three approaches to qualitative content analysis. Qualitative health research15(9) 1277-1288.
Huang, C., P. Chu, Y. Chiang. 2008. A fuzzy AHP application in government-sponsored R&D project selection, Omega36 1038-1052.
Hultink, E.J., A. Griffin, S. Hart, H.S. Robben. 1997. Industrial new product launch strategies and product development performance. Journal of Product Innovation Management14(4) 243-257. Hwang, C.L., K. Yoon. 1981. Multiple attributes decision making methods and applications,
Springer, Berlin.
Im, S., J.P. Jr. Workman. 2004. Market orientation, creativity, and new product performance in high-technology firms. Journal of Marketing68(2) 114-132.
Jang, H.J., J. Sim, Y. Lee, O. Kwon. 2013. Deep sentiment analysis: Mining the causality between personality-value-attitude for analyzing business ads in social media. Expert Systems with Applications40(18) 7492-7503.
Kahneman, D., A. Tversky. 1979. Prospect theory: An analysis of decision under risk.
Econometrica: Journal of the Econometric Society47(2) 263-291.
28
Krishnan, V., K.T. Ulrich. 2001. Product development decisions: A review of the literature.
Management Science47(1) 1-21.
Krohling, R.A., V.C. Campanharo. 2011. Fuzzy TOPSIS for group decision making: A case study for accidents with oil spill in the sea. Expert Systems with Applications38(4) 4190-4197.
Labrecque, L.I., C. Mathwick, T.P. Novak, C.F. Hofacker. 2013. Consumer Power: Evolution in the Digital Age. Journal of Interactive Marketing27(4) 257-269.
Li, Y.M., C.Y. Lai, C.W. Chen. 2011. Discovering influencers for marketing in the blogosphere.
Information Sciences181(23) 5143-5157.
Mallick, D.N., R.G. Schroeder. 2005. An integrated framework for measuring product development performance in high technology industries. Production and Operations Management 14(2) 142-158.
Malthouse, E.C., M. Haenlein, B. Skiera, E. Wege, M. Zhang. 2013. Managing Customer Relationships in the Social Media Era: Introducing the Social CRM House. Journal of Interactive Marketing27(4) 270-280.
McGrath, R.G. 1997. A Real Options Logic for Initiating Technology Positioning Investments.
Academy of Management Review22(4) 974-996.
Mishra, S., K. Dongwook, H.L. Dae. 1996. Factors affecting new product success: cross-country comparisons. Journal of Product Innovation Management13(6) 530-550.
Montoya-Weiss, M.M., R. Calanone. 1994. Determinants of new product performance: a review and meta-analysis. Journal of Product Innovation Management11 397-417.
Mullens, M.A., M. Arif, R.L. Armacost, T.A. Gawlik, R.L. Hoekstra. 2005. Axiomatic based decomposition for conceptual product design. Production and Operations Management14(3) 286-300.
29
Padmanabhan, V., S. Rajiv, K. Srinivasan. 1997. New products, upgrades, and new releases, a rationale for sequential product introduction. Journal of Marketing Research34(4) 456-472. Peng, T., L. Liu. 2015. A novel incremental conceptual hierarchical text clustering method using
CFu-tree. Applied Soft Computing27 269-278.
Piller, F.T., D. Walcher. 2006. Toolkits for idea competitions: a novel method to integrate users in new product development. R&D Management36(3) 307-318.
Prelec, D. 1998. The probability weighting function. Econometrica66(3) 497-527.
Pun, K.F., K.S. Chin. 2005. Online assessment of new product development performance: an approach. Total Quality Management and Business Excellence16(2) 157-169.
Pun, K.F., K.S. Chin, M.Y.R. Yiu. 2010. An AHP approach to assess new product development performance: An exploratory study. International Journal of Management Science and Engineering Management5(3) 210-218.
Saaty, T.L. 1980. The analytic hierarchy process, McGraw-Hill Press, New York.
Sawhney, M., G. Verona, E. Prandelli. 2005. Collaborating to create: The Internet as a platform for customer engagement in product innovation. Journal of Interactive Marketing19(4) 4-17.
Scudder, G.D., C.A. Hill. 1998. A review and classification of empirical research in operations management. Journal of Operations Management 16(1) 91-101.
Seuring, S., M. Muller. 2008. From literature review to a conceptual framework for suitable supply chain management. Journal of Cleaner Production16 1699-1710.
Simchi-Levi, D. 2014. OM Forum-OM Research: From Problem-Driven to Data-Driven Research.
Manufacturing & Service Operations Management 16(1) 2-10.
Singhal, K., J. Singhal. 2012. Imperatives of the science of operations and supply-chain management. Journal of Operations Management 30(3) 237-244.
30
Souder, W.E., X.M. Song. 1998. Analyses of US and Japanese management processes associated with new product success and failure in high and low familiarity markets. Journal of Product Innovation Management15(3) 208-223.
Tranfield, D., D. Denyer, P. Smart. 2003. Towards a methodology for developing evidence-informed management knowledge by means of systematic review. British Journal of Management 14 207-222.
Tripathy, A., S.D. Eppinger. 2013. Structuring Work Distribution for Global Product Development Organizations. Productions and Operations Management22(6) 1557-1575.
Trusov, M., R.E. Bucklin, K.H. Pauwels. 2009. Effects of word-of-mouth versus traditional marketing: Findings from an internet social networking site. Journal of Marketing73(5) 90-102. Tversky, A., D. Kahneman. 1992. Advances in prospect theory: Cumulative representation of
uncertainty. Journal of Risk and uncertainty5(4) 297-323.
Van laarhoven, P.J.M., W. Pedrycz. 1983. A fuzzy extension of Saaty’s priority theory. Fuzzy Sets and Systems11 229-241.
Von Hippel, E. 1986. Lead users: a source of novel product concepts. Management Science 32(7) 791-805.
Wang, Y.-M., Y. Luo, Z. Hua. 2008. On the extent analysis method for fuzzy AHP and its applications. European Journal of Operational Research186(2) 735-747.
Wu, G., R. Gonzalez. 1996. Curvature of the probability weighting function. Management Science 42(12) 1676-1690.
Xiang, Z., U. Gretzel. 2010. Role of social media in online travel information search. Tourism Management31(2) 179-188.
Appendix A
A1. Design evaluation using AHP
The first step is to formulate synthetic pairwise comparison matrices. Using evaluation criterion C1
31
Table A1. AHP pairwise comparison matrix for alternative designs with respect to C1 Design 1 Design 2 Design 3 Design 4
Design 1 1.000 1.587 0.437 0.382 Design 2 0.630 1.000 0.437 0.397 Design 3 2.289 2.289 1.000 0.794 Design 4 2.621 2.520 1.260 1.000 Note: the consistency ratio CI/RI=0.012
[image:31.595.57.541.377.491.2]Following the AHP calculation outlined by Satty (1980), the relative performance ratings of four alternative designs with respect to C1 are obtained as R1=(0.164, 0.131, 0.322, 0.383). By repeating the calculation for other criteria, the performance ratings of alternative designs with respect to other evaluation criteria/sub-criteria can be obtained, as shown in Table A2. An aggregated index (AI) is then calculated by aggregating the performance ratings of each design, with respect to all evaluation criteria and comparative weightings between the criteria/sub-criteria. The highest value of aggregated index, in this case Design 3, is the best design option for the company to select.
Table A2. Evaluation results for four alternative designs using AHP
C1 C21 C22 C31 C32 C33 C341 C342 C343 C41 C42 AI Rank
Weights 0.056 0.052 0.074 0.053 0.114 0.085 0.120 0.118 0.136 0.134 0.058
Design 1 0.164 0.155 0.351 0.186 0.230 0.135 0.190 0.144 0.171 0.167 0.161 0.185 4 Design 2 0.131 0.148 0.189 0.122 0.119 0.194 0.294 0.427 0.228 0.222 0.213 0.224 3 Design 3 0.322 0.297 0.109 0.311 0.261 0.268 0.343 0.303 0.335 0.363 0.362 0.303 1 Design 4 0.383 0.400 0.351 0.381 0.390 0.404 0.173 0.125 0.267 0.248 0.264 0.287 2
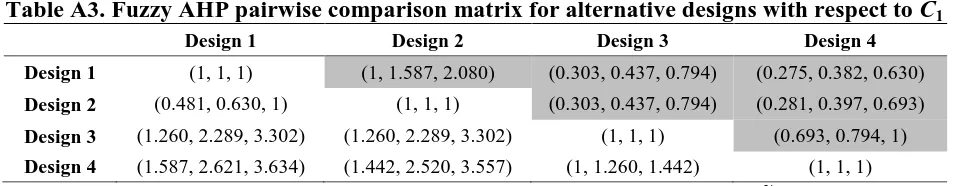
A2. Design evaluation using fuzzy AHP
Similar to AHP, the first step is to formulate fuzzy synthetic pairwise comparison matrices. Table A3 displays the fuzzy synthetic pairwise comparison matrix of the criterion C1, as an example.
Table A3. Fuzzy AHP pairwise comparison matrix for alternative designs with respect to C1
Design 1 Design 2 Design 3 Design 4
Design 1 (1, 1, 1) (1, 1.587, 2.080) (0.303, 0.437, 0.794) (0.275, 0.382, 0.630) Design 2 (0.481, 0.630, 1) (1, 1, 1) (0.303, 0.437, 0.794) (0.281, 0.397, 0.693) Design 3 (1.260, 2.289, 3.302) (1.260, 2.289, 3.302) (1, 1, 1) (0.693, 0.794, 1) Design 4 (1.587, 2.621, 3.634) (1.442, 2.520, 3.557) (1, 1.260, 1.442) (1, 1, 1)
The next step is to calculate the fuzzy geometric mean ( ̃) and fuzzy ratings ( ̃) of four alternative designs. First, the fuzzy ratings of dimensions for the owners group are given as:
[image:31.595.54.533.588.681.2]32
(( ) ( ) ( ) ) ( )
Similarly, we can obtain the remaining ̃, that is: ̃ ( )
̃ ( )
̃ ( )
The ratings of each dimension can be calculated as follows: ̃ ̃ ( ̃ ̃ ̃ ̃ )
( ) (
)
( )
[image:32.595.49.501.416.506.2]Likewise, the remaining fuzzy ratings values of each design can be obtained. The results are displayed in Table A4.
Table A4. Performance ratings of alternative designs with respect to C1 (LRi, MRi, URi)
Non-fuzzy weights
Normalised weights
̃ (0.093, 0.162, 0.312) 0.189 0.170
̃ (0.078, 0.130, 0.266) 0.158 0.142
̃ (0.178, 0.323, 0.561) 0.354 0.318
̃ (0.213, 0.384, 0.641) 0.413 0.371
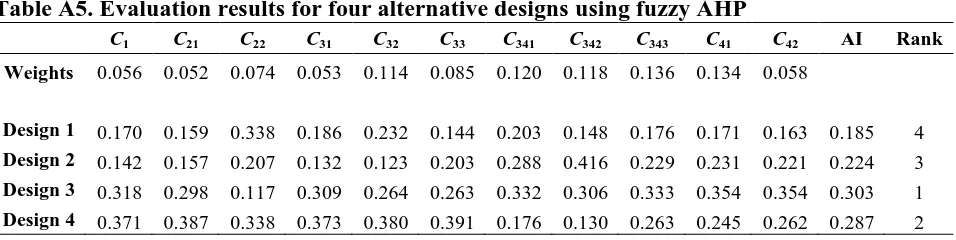
The non-fuzzy value was obtained through the Centre-of-Area method. Similarly, the performance ratings of alternative designs with respect to other evaluation criteria/sub-criteria can be obtained. AIs for all the four alternative designs are then calculated by aggregating the performance ratings of each design with respect to all evaluation criteria. The results are illustrated in Table A5, in which Design 3 has the highest index value.
Table A5. Evaluation results for four alternative designs using fuzzy AHP
C1 C21 C22 C31 C32 C33 C341 C342 C343 C41 C42 AI Rank
Weights 0.056 0.052 0.074 0.053 0.114 0.085 0.120 0.118 0.136 0.134 0.058
[image:32.595.60.538.639.759.2]