City, University of London Institutional Repository
Citation:
Villar, A., Callegaro, M. and Yang, Y. (2013). Where Am I? A Meta-Analysis of
Experiments on the Effects of Progress Indicators for Web Surveys. Social Science
Computer Review, 31(6), pp. 744-762. doi: 10.1177/0894439313497468
This is the published version of the paper.
This version of the publication may differ from the final published
version.
Permanent repository link:
http://openaccess.city.ac.uk/14427/
Link to published version:
http://dx.doi.org/10.1177/0894439313497468
Copyright and reuse: City Research Online aims to make research
outputs of City, University of London available to a wider audience.
Copyright and Moral Rights remain with the author(s) and/or copyright
holders. URLs from City Research Online may be freely distributed and
linked to.
City Research Online:
http://openaccess.city.ac.uk/
[email protected]
Where Am I? A Meta-Analysis
of Experiments on the Effects
of Progress Indicators for
Web Surveys
Ana Villar
1, Mario Callegaro
2, and Yongwei Yang
3Abstract
The use of progress indicators seems to be standard in many online surveys. Researchers include them in surveys in the hope they will help reduce drop-off rates. However, there is no consensus in the literature regarding their effects. In this meta-analysis, we analyzed 32 randomized experiments com-paring drop-off rates of an experimental group who completed an online survey in which a progress indicator was shown to drop-off rates of a control group to whom the progress indicator was not shown. In all the studies, a drop-off was defined as a discontinuance of the survey (at any point) after it has begun, resulting in failure to complete the survey. Three types of progress indicators were analyzed: constant, fast-to-slow, and slow-to-fast. Our results show that, overall, using a constant progress indicator does not significantly help reduce drop-offs and that effectiveness of the progress indicator varies depending on the speed of indicator: Fast-to-slow indicators reduced drop-offs, whereas slow-to-fast indicators increased drop-offs. We also found that among the studies in which a small incentive was promised, showing a constant progress indicator increased the drop-off rate. These findings question the common belief that progress indicators help reduce drop-off rates.
Keywords
progress indicator, progress bar, survey break-off, drop-off rate, web surveys
Introduction
A decline in response rates in surveys is a problem that occurs in all modes of data collection. Researchers try to manipulate different aspects of survey design to increase response rates, such as by offering incentives for participating or by increasing the number of contacts with the sample unit. Some of these strategies can be used similarly across modes (e.g., the use of incentives),
1City University London, London, UK 2Google UK Ltd., London, UK 3Gallup, Omaha, NE, USA
Corresponding Author:
Ana Villar, City University London, Northampton Square, London EC1V 0HB, UK. Email: [email protected]
Social Science Computer Review 31(6) 744-762
ªThe Author(s) 2013 Reprints and permission:
whereas others are specific to one mode and need to be adapted for other modes (e.g., varying time of interviewer visits vs. varying the type of envelope used in a mail survey invitation).
Strategies to increase response rates depend also on the component of nonresponse that a researcher intends to decrease: noncontacts, refusals, or incomplete interviews, such as those result-ing from drop-offs. A survey drop-off refers to the situation in which a respondent fails to complete a survey after starting it. Drop-offs can result in loss of data for some questions (item nonresponse) or even the entire survey unit (unit nonresponse) if the drop-off happens in the early stages of the survey-taking process. Both item and unit nonresponse may lead to biased or imprecise estimates and inferences if those who drop off differ systematically with respect to the variables of interest from those who complete the survey. This study focuses on evaluating the effects of using progress indicators as a strategy to reduce survey drop-offs.
Although drop-offs are a potential threat to all surveys modes, especially self-administered ones, there is a concern that as the number of web surveys increase so too will the problem of drop-offs. Dillman, Smyth, and Christian (2009) warn us that the survey experience ‘‘is now highly impersonal and is increasingly controlled by respondents who feel less obligated to provide requested informa-tion and for whom refusing is now more socially acceptable’’ (p. 10). With interviewer-administered surveys, the presence of an interviewer allows for strategies to be implemented to keep respondents motivated throughout the survey, potentially reducing drop-offs and, hopefully, maintaining the respondent’s engagement in the task at an optimal level. Interviewers can address questions and hesitations from respondents and can attempt to maintain engagement when respondents show signs of decreased motivation. For example, when a fatigued respondent asks how much longer the inter-view will last, the interinter-viewer can provide positive feedback (‘‘thank you very much for your answers’’), try to reschedule the interview for another time, or remind the respondent that there are only a few questions left. The presence of interviewers in face-to-face and telephone surveys, thus, can help decrease drop-offs in ways that are not immediately available to self-administered (such as mail or web).
Progress feedbackmay still be present in self-administered surveys. In mail and in web surveys that use a scrolling design in which the entire questionnaire content is presented on one ‘‘page,’’ respondents may simply look through the remaining pages or questions to get an idea about how much more of their task remains. However, presenting questions on different ‘‘pages’’ (‘‘page-design’’) is considerably more common than the scrolling design in web surveys (see Couper, 2008). With a multiple-page design, a respondent’s progress is no longer apparent; although at the start of each survey, respondents are typically informed of its approximate duration, there is no immediate information given on their progress made at any given point with respect to the total effort necessary to complete the task. Thus, the use of computer-based progress indicators in these page-design web surveys attempts to provide respondents with feedback about how much of the task remains in a way that mimics what interviewers do during the interview process.
Additional benefits of using a progress indicator have been suggested, such as improving respon-dents’ satisfaction with the survey experience (Conrad et al., 2010; Matzat, Snijders, & van der Horst, 2009). In the 2005 ‘‘Guidelines on Conducting Market and Opinion Research Using the Inter-net,’’ the European Society for Opinion and Marketing Research (ESOMAR) suggested that
For surveys completed online, respondents must be told about the length of time the questionnaire is likely to take to complete under normal circumstances (e.g., assuming connection is maintained). The use of some form of metering device so that respondents can track their progress through the question-naire is recommended. (ESOMAR, 2005, p. 7)1
Furthermore, based on our own experience in different fields of study, we have observed that survey providers face pressure from their clients to add progress indicators to online surveys simply because the client feels that it is ‘‘a good thing to have’’ or even ‘‘a must have’’ because ‘‘others use it.’’ Finally, in informal discussions with colleagues, we often hear as an argument for its use that ‘‘respondents want a progress indicator.’’ Only partial evidence for this preference is provided by three studies. In one study, 77%of respondents chose to show a progress indicator when given the choice (Heerwegh, 2004). In a second study, only a third of respondents followed a link labeled ‘‘show progress,’’ and did so, on aver-age, only once (Conrad et al., 2010). Finally, on a scale of 1 (would not recommend) to 5 (would strongly recommend), the average score for respondents when asked whether they would recommend the use of a progress bar in Gallup Panel surveys was 4.2 (Rao & Couper, 2009). In sum, various players involved in the survey process seem to support the idea of showing progress indicators in web surveys.
Despite the popularity of progress indicators, it is unclear whether they actually help reduce drop-offs or increase satisfaction with the survey experience (Couper, 2008). This is not to say research has not been carried out. We have located a moderate number of published and unpublished experi-mental studies that investigated the impact of using progress indicators on respondents’ likelihood of dropping off. However, findings from these studies regarding the effect of progress indicators appear to be mixed, where some studies found that progress indicators reduced drop-offs, some concluded that they increased drop-offs, and yet others found that they had no effect on drop-off rates. As in any empirical research, inconsistencies in the findings could be the result of sampling errors or other artifacts associated with individual studies. At the same time, inconsistencies may also reflect systematic effects attributable to substantively meaningful factors. Because the existing studies also differed in terms of their designs and implementations, it is unclear whether the observed differences in the effects of progress indicators were due to artifacts or to other varying design features.
The goal of our study is to synthesize findings across these studies in order to discover a generalizable pattern regarding the effect of progress indicators on survey drop-offs in web surveys. To achieve this goal, we adopted a meta-analytic approach. Meta-analysis is a statistical method that provides estimates of the relationship between variables from the combination of results of a number of studies, after accounting for the impact of sampling errors and/or other artifacts. It also tests whether any observed rela-tionship is generalizable across conditions (in our case, different progress indicator designs) by evaluating whether there are true systematic variations in the relationship. If systematic variations are found, meta-analyses allow for the investigation of what systematic factors (moderators) might account for such var-iations. In sum, we have used meta-analysis to summarize findings of the effect of progress indicators across studies (allowing us to distill true effects from artifacts) and to identify potential moderating factors that may explain systematic and meaningful variations in the progress indicator research findings.
Background and Literature
mail surveys by checking the number of pages. Anticipating that respondents would want progress feedback when completing web surveys, it seemed only logical to provide such feedback by using existing tools that communicate task progress to computer users, that is, progress indicators.
Progress Indicators in the Human–Computer Interaction (HCI) Literature
Progress indicators were first studied in the HCI literature (Myers, 1983, 1985). HCI research focused on studying the perception of task duration in comparison to the speed of a progress indicator. Research in this area has shown that, for computer tasks, users prefer having a progress indicator in comparison to not having one when waiting for an operation to be completed (Myers, 1985). In addition, HCI research has found that perceived task duration is affected by how fast or slow the progress indicator is toward the end of the task: The duration of a progress bar (and hence, of the related task) is perceived shorter if the speed of the progress indicator is faster toward the end of the task (Enomoto, Ohnishi, & Yoshida, 2006; Harrison, Amento, Kuznetsov, & Bell, 2007).2 However, the nature of the interaction between computer and human in a web survey has notable differences when compared to other computer tasks. First, progress indicators in computer functions often convey progress on tasks that last a few seconds or minutes, and even if they last longer, the user (a) has no control over the speed of the task and (b) has the option to perform other tasks while the long process takes place. In other words, progress in such computer tasks typically does not depend on the behavior of the human and the progress indicator simply informs them of whether progress is being made. Second, the task that progress bars describe has a clear goal, and users expect to obtain the desired result from the device at the end (e.g., transfer a file, see a website, or install a program). So presumably the reward in that context can be considerably larger than the reward obtained by completing a survey (unless incentives are offered). Third, progress indicators in web surveys are placed in areas where visual focus rarely goes (most commonly on the top right corner), whereas, in computer tasks, progress indicators are presented in pop-ups that are highly visible. As a result, some survey respondents may not even be aware of the presence of a progress indicator, especially at the beginning, when they are getting familiar with the survey topic and the task at hand. In contrast, computer users almost inevitably see the action of the progress indicators at least during the first seconds of a computer task. In research regarding computer functions, more-over, participants are studied in lab contexts where they focus their attention mainly on the task at hand (comparing or judging progress indicators) and therefore will probably look at them from beginning to end. Finally, progress indicators used in some of the HCI studies reviewed did not offer prior information regarding the total time the task would take to complete, but in the survey studies we analyzed in this article and in surveys in general, respondents are informed about the duration of the task before it is started. Therefore, we should not be too surprised if findings from the HCI literature do not generalize to the effect of progress indicators in survey experiences.
Progress Indicators in the Survey Research Literature
In this section, we discuss the rationale behind the use of progress indicators in survey research and the theoretical explanations that have been proposed to account for the effect of progress indicators in online surveys. Additional hypotheses that have not been explored by existing literature are exam-ined in the discussion section of the article. A detailed description of the findings regarding the effect of progress indicators on drop-off rates is presented in the Results section.
the activity (rewards) outweighs what they will expend to obtain the gain (costs; see, e.g., Dillman, Smyth, & Christian, 2009). It further states that such cost–reward analysis is based on the trust that the survey provider will follow through with the provided information regarding those aspects that are evaluated in the reward–cost analysis.
Respondents may be repeatedly engaging in cost–reward analysis during the course of a survey. For such analyses, respondents may include various pieces of information in their calculation, such as the promised incentive, their interest in the topic, and the pleasantness and ease of the task. Progress indi-cators, when present, can provide one such piece of information: They convey feedback to the respon-dent on their progress relative to the beginning as well as to the end of the activity—displaying the completed amount in the context of the total amount that is required. Thus, progress indicators serve as ‘‘cost forecasters,’’ giving information that can be used to assess how much more investment needs to be made to complete the survey and obtain the reward. The respondent can use this information to reassess whether such investment is worthwhile. However, it is reasonable to expect that not all respondents will use the information; therefore, not all respondents will be affected by progress indi-cators in the same way (much like most survey features). Nevertheless it is important to find out whether a manipulation has, overall, an effect (positive or negative) on important survey outcomes, such as response rates, even if the effect is not constant for all potential respondents.
Another proposed explanation for the effectiveness of progress indicators is based on the idea that ‘‘knowledge is pleasing’’ (Conrad et al., 2010; Crawford, Couper, & Lamias, 2001; Myers, 1985), and thus simply providing knowledge about progress may motivate respondents to continue. A sim-ilar notion is the ‘‘light at the end of the tunnel’’ analogy used by Conrad, Couper, Tourangeau, and Peytchev (2003, 2005, 2010) and Jacobs (2007). Or, as Sue and Ritter put it,
[G]etting lost when taking a survey is frustrating and can cause respondents to drop out before complet-ing the survey [. . . ] It is helpful for the reader to have an understanding of the location and how far he or she is from the destination point, which is the end of the survey. (2012, p. 93)
However, simply knowing the progress may not be sufficient to motivate survey respondents and may actually damper their motivation if the perceived necessary effort that remains seems too costly. Conrad and colleagues (2010), hence, suggest that ‘‘knowledge can cut both ways.’’ Therefore, even if respondents prefer having a progress indicator, if the information it provides leads to a cost– reward calculation that is against sustaining motivation to complete the survey, respondents may drop off. As we will later discuss, this may help explain the inconsistent results that have been found in the research on progress indicators.
Other factors may also contribute to making progress indicators more or less effective. First, respon-dent characteristics may affect how the progress indicator is understood and used. Their onset level of motivation, the time that they initially set aside for the survey, where they are, and what device they are using to take the survey may all influence whether the progress indicator helps them stay motivated or not. Second,whenthe progress indicator is offered and/or checked by respondents might affect the way it influences drop-offs. Two competing perspectives have been offered on this topic. Thefirst impressionhypothesis suggests that it is important to provide encouraging messages about progress early in the survey when it may have the greatest effect on respondents (Conrad et al., 2005; Matzat et al., 2009). Thesurfacinghypothesis suggests that respondents may need to be reminded or ‘‘remo-tivated’’ throughout the course of a survey, especially in the later part, by receiving encouraging feedback about their progress (Matzat et al., 2009). Whether the feedback respondents receive is encouraging or discouraging will depend on their expectation of how much progress they have made and whether the feedback matches that expectation.
indicators differ in terms of their visual display styles (where they are placed, how large they are, the font used, their color, etc.), the information conveyed (e.g., how many questions have been answered, the percentage of questions answered, or a drawn bar without numbers or words), and their ‘‘speed’’ or rate of progress (see next section for a description). Variations in the design of the progress indicator used may be another reason why results across studies have differed.
Other design features of the surveys in which progress indicators are used may interact with its effects. One particular aspect of a survey that might be likely to interact with the effect of progress indicators is the expected survey duration, which is affected by the time estimate communicated to the respondent. When surveys provide estimations of duration upfront, respondents may set up a baseline commitment of costs. This may, in turn, interact with the perceived cost during the course of the survey. When a respondent’s adjusted assessment of cost is larger than their baseline estimate, they may abandon the survey; whereas, if a respondent’s perception falls within the range of the initial time commitment anticipated, this may encourage continuation of the survey. Similarly, how the survey duration message is presented (vague vs. specific) andactualsurvey duration may also have an impact. For example, Yan, Conrad, Couper, and Tourangeau (2011) argued that people who have already engaged in a long survey might be subject to the ‘‘sunk cost bias’’ in their decision making and continue on despite feeling that the process has already cost them a lot.
In our meta-analytical study, we performed subgroup analysis to explore possible interactions with design features —when data on such features were available for a sufficient number of studies. However, due to limitations in the number and characteristics of the available studies, we were not able to explore a number of factors that theoretically would be interesting to study.
Styles and Types of Speed in Progress Indicators
Although the basic concept of a progress indicator may be simple and straightforward, in practice, there is variation in how progress is displayed and conveyed. The advent of computer-based surveys and psychological and educational testing further invites creativity in designing and deploying progress indicators. Still, varying shapes and forms of progress indicators may be classified along two aspects, namely, their visual presentation style and their speed design.
Styles of Progress Indicators.Various styles of progress indicators have been described in the survey literature and offered by different survey software vendors. They can be classified into three groups: textual, graphic only, and graphic and text (Kaczmirek, 2009). Examples of these types of progress indicators can be found in the online Supplementary Appendix (Figures A1–A5).
Textual progress indicators describe progress using words, for example, presenting the number of screens or questions completed and also those remaining (Figure A1).
Graphic-only progress indicators do no attach any percentage or number of pages (which makes them less specific than textual indicators) but give respondents an idea of where they are in the survey by ‘‘fill-ing up’’ a container as progress is made (Figure A2). Although horizontal bars are the most commonly used form of graphic progress indicator, other designs are also available. For example, the survey plat-form Snap showed a glass that got fuller as respondents answered more questions (Figure A3).
Even though the design of progress indicators vary in some aspects across surveys, size, position, and visibility are kept within a ‘‘sensible’’ range of values; therefore, progress indicators are quite homogeneous with respect to the variables that matter most.
Speed of Progress Indicators.In the studies considered for this meta-analysis, authors manipulated the speed in progress indicators to investigate the mechanism behind the effects of these devices on drop-off rates. Three types of speed were used: constant or linear speed, fast-to-slow (or ‘‘fast-first-then-slow’’), and slow-to-fast (or ‘‘slow-first-then-fast’’; Conrad et al., 2003). In the constant speed design, the progress shown is equal to the number of pages (or questions) presented to that point divided by the total number of pages (or questions) in the survey instrument. In the fast-to-slow case, the speed of the progress decelerates across the questionnaire, moving fast during the first screens and slowing down toward the end. The slow-to-fast progress indicator is just the opposite: The progress is slow during the first screens and speeds up toward the end.
It is worth noting that progress indicators with variable speed are not commonly used in survey research and, to our knowledge, they are not readily available in online survey platforms. Moreover, if the progress of these nonlinear indicators intentionally misrepresents the actual progress respon-dents have made, this would raise important ethical questions, and we do not recommend this decep-tive type of use. It should be noted, however, that constant progress indicators are not necessarily accurate reflections of progress in terms of time or effort, given that some questions will inevitably take longer to answer than others and that respondents might start going faster toward the end of the questionnaire because of training and fatigue. Therefore, some forms of variable speed progress indicators may be valid and ethical as long as they reflect actual progress.
On Meta-Analysis
Over the past decade, a moderate number of studies about the effect of progress indicators on survey drop-off rates have been carried out. These studies, on the surface, do not always show consistent findings. As mentioned previously, they also differ in terms of design features and analytical meth-ods. The seemingly inconsistent findings, together with the idiosyncrasies of individual studies, make it difficult to arrive at a concise and clear understanding of the state of affairs about this topic. This, in turn, leads to difficulties for practitioners who are looking for general guidance on whether to adopt progress indicators and what may be expected from using them.
At the same time, the number of studies has reached a point that, we believe, allows a meta-analysis to be conducted. Meta-analysis is the statistical combination of results produced by different studies. When applied to experimental studies, meta-analysis focuses on pairwise comparisons between one group, generally called thecontrol group, and one or moretreatmentgroups (Deeks, Higgins, & Altman, 2008). Conducting a meta-analysis involves first systematically delineating the similarities and differences across various studies in terms of their design. This effort by itself helps us to understand the literature. Moreover, meta-analyses provide generalizable estimates of the effect size of the manipulated variable, in our case, of the impact of progress indicators on drop-off rates. Finally, it allows for the study of moderating variables, testing whether effects differ across different types of progress indicators or by some other factors.
Method
Selection of Studies for Meta-Analysis
Research Methods Section, Ingenta, and Quirks magazine. We also searched the archives of the past 10 years of conferences of the American Association for Public Opinion Research (AAPOR), ESOMAR, and the General Online Research conferences. Google and Google Scholar were also used especially to find gray literature (e.g., white papers, technical reports, and preprints) and dis-sertations. Finally, we consulted section 5.8 on progress indicators in Couper’s (2008) book on web surveys.
The following key words were used in the search in various combinations: progress bar, progress indicator(s), progress feedback, survey duration, questionnaire length, online survey, web survey, response rate, and drop-off.
Once an article was found, cited references were checked for additional studies. To avoid publication bias and English language bias (Dickersin, 2005), we also sent a call for unpublished or forthcoming articles and for non-English language articles to the following mailing lists: AAPORnet, SRMSnet, and WAPORnet.
The search resulted in 10 articles that could be used for the meta-analysis (see eligibility criteria below), including 7 journal publications, 1 book chapter, and 2 unpublished dissertations. Nine arti-cles were published in English and one was in German. The dates of the artiarti-cles ranged from 2001 to 2010, with the majority (6 of the 10) dated between 2009 and 2011. Five of the 10 articles included multiple studies, resulting in a total of 19 studies. These studies involved 32 experiments: 18 experi-ments tested constant speed progress indicators, 7 experiexperi-ments tested fast-to-slow progress indica-tors, and 7 experiments tested slow-to-fast progress indicators.
Eligibility Criteria.A study was included in the meta-analysis if it met all four criteria below:
Respondents were randomly assigned to the control and experimental condition.
Either a constant, fast-to-slow, or slow-to-fast progress indicator was compared against a no progress indicator condition.
The progress indicator was always shown on each page of the survey. The respondent had no way to hide or to request the progress indicator.
Reasons for Exclusion.Seven additional articles were excluded from the meta-analysis for the following reasons: There was not enough detail about the experiments (Braun Hamilton, n.d.), the progress indi-cator included a summary screen that indicated the sections remaining in the questionnaire (Spicer & Dowling, 2012), or there were confounding factors in the experiment, namely, time to load a page in the progress bar condition took longer for dial-up users in comparison to the control condition (Couper, Traugott, & Lamias, 2001; Forsman & Varedian, 2002). Studies presented in more than one publica-tion were only used once (Conrad et al., 2003, 2005; Heerwegh, 2004). The 19 studies from the 10 articles included in the analysis are listed in Table 1 with a short description of their design.
Coding of Study Features.To understand what study features contribute to the conflicting findings on the effect of the progress indicators on drop-off rates, we coded various study features, as reported in Table A of the Supplementary Appendix.
any stage of the study (i.e., who did not entirely finish the survey) divided by the number of respon-dents who started the study (survey).
Dropoff rate¼Number of unique respondents dropping off from the survey
Number of unique respondents starting the survey : ð1Þ
Wherever this information was not readily available or when our calculations did not match the data from the published article, we contacted the original authors for clarification. Authors were also con-tacted when the published data did not have the level of detail necessary for the meta-analysis or to request additional information of survey characteristics used for subgroup analyses in this study.
The effect size is expressed in terms of the logarithm of odds ratio (log odds ratio [LOR]) because of two analytical advantages: First, LORs are conceptually unbounded and symmetric around 0; second, they allow for easy graphical representation using forest plots of the effect sizes.
LORs are defined as:
LOR¼ln DExpNCon
NExpDCon
!
[image:10.495.52.449.89.439.2]; ð2Þ
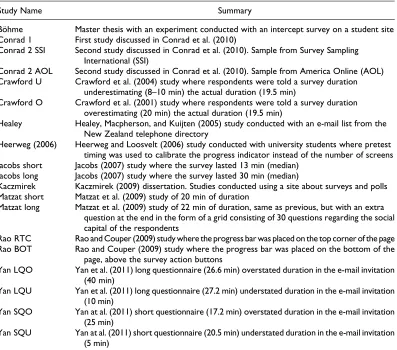
Table 1.Studies Included in the Meta-Analysis With Brief Summaries.
Study Name Summary
Bo¨hme Master thesis with an experiment conducted with an intercept survey on a student site Conrad 1 First study discussed in Conrad et al. (2010)
Conrad 2 SSI Second study discussed in Conrad et al. (2010). Sample from Survey Sampling International (SSI)
Conrad 2 AOL Second study discussed in Conrad et al. (2010). Sample from America Online (AOL) Crawford U Crawford et al. (2004) study where respondents were told a survey duration
underestimating (8–10 min) the actual duration (19.5 min)
Crawford O Crawford et al. (2001) study where respondents were told a survey duration overestimating (20 min) the actual duration (19.5 min)
Healey Healey, Macpherson, and Kuijten (2005) study conducted with an e-mail list from the New Zealand telephone directory
Heerweg (2006) Heerweg and Loosvelt (2006) study conducted with university students where pretest timing was used to calibrate the progress indicator instead of the number of screens Jacobs short Jacobs (2007) study where the survey lasted 13 min (median)
Jacobs long Jacobs (2007) study where the survey lasted 30 min (median)
Kaczmirek Kaczmirek (2009) dissertation. Studies conducted using a site about surveys and polls Matzat short Matzat et al. (2009) study of 20 min of duration
Matzat long Matzat et al. (2009) study of 22 min of duration, same as previous, but with an extra question at the end in the form of a grid consisting of 30 questions regarding the social capital of the respondents
Rao RTC Rao and Couper (2009) study where the progress bar was placed on the top corner of the page Rao BOT Rao and Couper (2009) study where the progress bar was placed on the bottom of the
page, above the survey action buttons
Yan LQO Yan et al. (2011) long questionnaire (26.6 min) overstated duration in the e-mail invitation (40 min)
Yan LQU Yan et al. (2011) long questionnaire (27.2 min) understated duration in the e-mail invitation (10 min)
Yan SQO Yan at al. (2011) short questionnaire (17.2 min) overstated duration in the e-mail invitation (25 min)
whereDis the number of respondents who dropped off andNis the total number of respondents who started the survey. The subscript Exp stands for experimental group (progress indicator shown) and the subscript Con stands for control group (no progress indicator shown).
LOR is normally distributed with a known sampling variance given by the following:
A positive LOR signifies a higher drop-off rate for the experimental group, while a negative LOR signifies a higher drop-off rate for the control group, where no progress bar was shown. LOR are the key dependence measures we are discussing throughout the article.
Software Used in the Analysis
Data analysis was performed primarily withMeta-Analyst(Wallace, Schmid, Lau, & Trikalinos, 2009), withComprehensive Meta-Analysis(Borenstein, Hedges, Higgins, & Rothstein, 2011), and withMix(Bax, Yu, Ikeda, Tsuruta, & Moons, 2006). We used different programs to take advantage of unique features (especially graphics) of each software package (Bax, Yu, Ikeda, & Moons, 2007; Wallace et al., 2009).
Results
Unweighted Descriptive Analysis
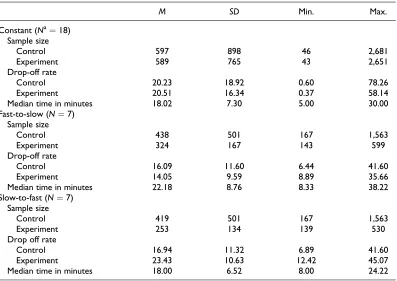
Table 2 presents a summary of descriptive statistics for sample size, drop-off rates, and survey duration of all 32 experiments included in the meta-analysis.
The averages of the actual median survey duration were 18 min for studies testing the constant or slow-to-fast progress indicators and 22 min for studies testing the fast-to-slow indicator. Sample size was larger for studies that tested the constant progress indicator than for the other two types of stud-ies, and more importantly, the standard deviation of those studies’ sample sizes is larger. The same pattern is found for drop-off rates. Control groups in the slow-to-fast and fast-to-slow conditions also show high standard deviations for sample size.
It is also interesting to note the minimum values for the drop-off rate in the constant progress indi-cator condition. These values come from the Gallup panel study (Rao & Couper, 2009). We interpret these low drop-off rates as indication of high motivation among Gallup panel respondents, perhaps because of topic saliency, perhaps because of Gallup’s name as a credible polling institution.
Weighted Effect Sizes and Graphical Display of Results
functionally identical. It should be noted that the choice of a random-effects model also has impli-cations regarding the weight given to each study. In such models, the weight assigned to each study is related to the variance of the estimate and computed as 1/(within-study varianceþbetween-study variance; Borenstein et al., 2010). The within-study variance is estimated using the method of moments, also known as DerSimonian and Laird (1986) method. This weighting mechanism tends to reduce the influence of large studies on the estimates, increasing the influence of small studies. For each comparison, we computed the test of homogeneity statisticQ, which is the weighted sum of squared differences between individual study effects and the pooled effect across studies (Boren-stein, Hedges, Higgins, & Roth(Boren-stein, 2009, p. 109). IfQis statistically significant, then there is hetero-geneity among the studies analyzed. A second measure of homohetero-geneity, the I2 index, was also computed. This index, which may range from 0 to 100, represents the proportion of observed variance that reflects real differences in effect size (Higgins, Thompson, Deeks, & Altman, 2003), thus provid-ing a quantification of the degree of heterogeneity in the meta-analysis. The same authors, usprovid-ing a sur-vey of the Cochrane Database of Systematic Reviews, looked at the distributions ofI2and suggested that a value of 25%should be considered low, 50%moderate, and 75%high. In addition, outlier anal-yses were performed by inspecting the Galbraith (1988) plot, also known as radial plot (Bax et al., 2009). The results and a detailed explanation are in the Supplementary Appendix.
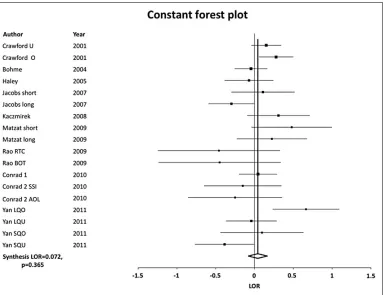
[image:12.495.51.448.88.369.2]Finally, the results of each meta-analysis are presented using forest plots (Figure 1; and Figures C, D, F, and H in the Supplementary Appendix), which are the most frequently used plots to present summary results in meta-analysis (Bax et al., 2009). In the forest plot, the LOR for each study and its 95%confidence interval are displayed. Each study is represented by a square with size propor-tional to the study weight. The diamond shape at the bottom of the plot4represents thepooledLORs
Table 2.Unweighted Descriptive Statistics by Type of Progress Indicator.
M SD Min. Max.
Constant (Na¼18) Sample size
Control 597 898 46 2,681
Experiment 589 765 43 2,651
Drop-off rate
Control 20.23 18.92 0.60 78.26
Experiment 20.51 16.34 0.37 58.14
Median time in minutes 18.02 7.30 5.00 30.00
Fast-to-slow (N¼7) Sample size
Control 438 501 167 1,563
Experiment 324 167 143 599
Drop-off rate
Control 16.09 11.60 6.44 41.60
Experiment 14.05 9.59 8.89 35.66
Median time in minutes 22.18 8.76 8.33 38.22
Slow-to-fast (N¼7) Sample size
Control 419 501 167 1,563
Experiment 253 134 139 530
Drop off rate
Control 16.94 11.32 6.89 41.60
Experiment 23.43 10.63 12.42 45.07
Median time in minutes 18.00 6.52 8.00 24.22
for all the studies considered. If a study is shown to the left of the zero vertical line (no effect), it means that there is a higher drop-off rate for the control group (no progress indicator shown) than for the treatment group (progress indicator shown)—in other words, it means that the progress indicator worked as intended. If a study is shown to the right of the no-effect line, it means that there is a higher drop-off rate in the experimental group (progress indicator shown), that is, the use of a progress indicator backfired.
Effect of the Constant Progress Indicator.Contrary to what researchers expect when they use progress indicators, we found a small but nonsignificant tendency forhigherdrop-off rates among respondents presented with the constant progress indicator as compared to the control group (LOR ¼ 0.072,
p¼.365). This effect was statistically significant for only 2 of the 18 studies (see forest plot in Figure 1).
The heterogeneity analysis suggests that the studies are not homogeneous (Q¼33.203,p¼.011;
I2¼48.799), indicating that further subgroup analysis is needed.
[image:13.495.59.442.75.370.2]As discussed previously, the studies varied in a number of survey design features that could affect the impact that indicators had on drop-off rates. We found two survey features that were likely to have an impact on the effect of progress indicators on drop-off rates and were available for most studies: the discrepancy between the respondent’s expected survey duration (as communicated by the researcher) and the actual survey duration and whether an incentive had been offered. The next two sections present these analyses.
Subgroup Analysis: Discrepancy Between Expected Duration and Actual Duration.Data were available for most of the studies (14 of the 18) to assess whether the survey duration researchers communicated to the respondent (either in the e-mail invitation or in a message at the beginning of the survey) was an overestimation or an underestimation of actual survey duration. This was determined by comparing the reported survey duration to the median time for completion.
The effect of the constant progress indicator is similar and not significant both in the surveys where duration was overestimated (LOR¼0.121,p¼.492) and in surveys where it was underes-timated (LOR¼0.030,p¼.755). (See Figure C in the Supplementary Appendix.) For both groups, the relationship between progress indicator and drop-off rates is not significant; therefore, overesti-mating or underestioveresti-mating survey duration does not seem to moderate the effect of progress indica-tors on drop-off rates. Outlier analysis (Figure B in the Supplementary Appendix) revealed an outlier in the overestimation group (Yan LQO) and one outlier in the underestimation group (Yan SQU). Removing such outliers, however, the results remain the same; the effect of constant progress indi-cators is still not significant in surveys where duration is overestimated (LOR¼0.006,p¼.969) as well as in surveys where it is underestimated (LOR¼0.106,p¼.166).
Subgroup Analysis: Presence or Absence of an Incentive Upon Completion.In studies where no incentive was offered upon completion of the survey,5there is a small but nonsignificant effect of progress indicator on drop-off rates in the expected direction (LOR¼ 0.065,p¼.637); whereas, for respon-dents who did receive incentives, the small effect goes in the opposite direction, that is, the presence of a constant progress indicator led to a larger yet nonsignificant number of drop-offs (LOR¼0.137,
p¼.159). (see Figure D in the Supplementary Appendix)
Outlier analysis (not shown) in the nonincentive studies did not identify any anomalies. Outlier analysis (Figure E in the Supplementary Appendix) of the incentive-upon-completion studies, however, revealed two outliers. The two outliers represent unusual cases in online surveys. In ‘‘Yan LQO’’ survey duration was overstated: Survey duration was said to be 40 min, but it was actually about 30 min. The other outlier, ‘‘Yan SQU,’’ largely understated the actual duration of a ‘‘short’’ questionnaire (20 min), communicating to respondents that it would last 5 min.6If we remove these two studies from the analysis, the effect of constant progress indicator on drop-off rates becomes significant (LOR¼0.157,p¼.025). In other words, for studies where a small incentive is given upon completion, showing the progress indicator increases the drop-off rate by a factor of 1.17, in comparison to the control group.
Effect of Survey Duration on Effect Size of Constant Progress Indicators.As explained before, one might argue that the effect of progress indicators depends on survey duration; information about progress in the survey may be discouraging rather than motivating if such progress is slow. Conversely, prog-ress indicators may work especially well when surveys are short and thus progprog-ress is fast. We tested this hypothesis by meta-regressing effect size on survey duration (measured as the median time in seconds of each study). Contrary to our expectation, results from the meta-regression showed that survey duration did not have a significant effect on effect size. It is possible that this lack of effect is related to the restricted, high range of survey duration across studies, where the median survey duration was quite large (18–22 min) and the minimum value was 5 for the constant progress indi-cator and 8 for the other two groups. Perhaps, if surveys shorter than 5 min were included in the analysis, an effect would be present.
plot results in Figure F in the Supplementary Appendix). The study of heterogeneity showed a low to moderate level of heterogeneity among these seven studies (Q¼8.662;p¼.194;I2¼30.73).
The outlier analysis (Figure G of the Supplementary Appendix) showed that the first study of Matzat short was an outlier. After excluding this study from the analysis, the effect of progress indi-cator on drop-off rates becomes statistically significant (LOR¼ 0.212,p¼.02). The odds ratios showed that when using a fast-to-slow progress indicator drop-off rate decreased by a factor of 0.80, on average, in comparison to the control group.
Effect of the Slow-to-Fast Progress Indicator.Respondents who were presented with a progress indicator that showed slow progress at the beginning of the survey were more likely to drop off than respon-dents who were not shown a progress indicator (LOR¼0.447,p¼.001). (See forest plot results in Figure H of the Supplementary Appendix.) The odds for respondents dropping off when presented with a slow-to-fast progress indicator were 1.56 times larger than the odds for those in the control group dropping off where no progress indicator was shown.
Heterogeneity among these seven studies is considerably high (Q ¼ 14.494, p ¼ .023;
I2¼59.17). Based on the outlier analysis (not shown), the first study by Matzat (Matzat short) was again an outlier. However, after excluding this study from the analysis, the effect remains significant and in the same direction (LOR¼0.372,p¼.002).
Discussion
Our findings show that the effect of progress indicators on drop-off rates varies depending on the speed design. Fast-to-slow indicators reduced drop-off rates (even though the average survey duration was lon-ger than for the other two groups, 22 min vs. 18 min) and slow-to-fast progress indicators increased drop-off rates. Therefore, these findings support the notions that (a) respondents do pay some attention to prog-ress indicators and (b) ‘‘knowledge can cut both ways’’ and are consistent with the surfacing hypothesis. The fast-to-slow progress indicator may decrease drop-offs because it gives the respondentduring the processthe impression that they already completed a vast part of the survey. So, even if the indicator shows a slowing down at the end the investment, the effort put into answering the first part of the survey can be a motivating factor not to ‘‘give up,’’ and therefore the respondent completes the survey. Conver-sely, in slow-to-fast indicators, early feedback suggests the need for high investment. As previously mentioned, the respondent evaluates time spentduringthe survey process; therefore, the sooner respon-dents feel like the task is going slower than expected, the sooner the effort will seem excessive.
In practice, constant indicators and slow-to-fast indicators will probably not yield the desired effect on drop-off rates, whereas the fast-to-slow design has the potential to reduce drop-offs. How-ever, the current design of fast-to-slow progress indicators is questionable in its ethics due to its deceptive nature.7At the same time, other authors have argued that respondents might seek feedback and encouragement especially at the beginning of a survey, when the amount of effort required might still be uncertain, and that fast-to-slow progress indicators can provide the encouragement respondents need (Conrad et al., 2003). However, the positive effect of fast-to-slow progress indicators on reducing drop-offs should stimulate research to further explore methods of providing progress feedback that provides positive reinforcement to the respondents and is truthful to their actual subjective experience. The reinforcement could have the form of a simple encouragement message such as displaying ‘‘thank you for your answers and your continued participation’’ after the first questions have been completed.
be taken with caution. Heterogeneity was present and outliers existed for most of the analyses performed, and other variables may have introduced noise and confounding real effects (although our selection of analytical tools took this heterogeneity into account). Unfortunately, some of the potential moderating variables, such as survey topic or sample origin, could not be coded for all studies, limiting the effects that could be discovered. Other variables were present but had restricted ranges of values, such as survey duration. Surveys of less than 5 min were not used for the study of progress indicators; therefore, we cannot estimate the effect progress indicators may have in shorter surveys.
To overcome these limitations, further studies are necessary that compare constant progress indicators to no indicator at all, keeping as many of the other survey features constant as possible. New studies should systematically vary or control for potential moderators, such as actual survey duration, duration statements, survey topic, sample origin, incentive, respondent motivation, and some visual design features. For these studies to have practical implications, it is also important to include experimental conditions that are realistic in practice.
Along this line, survey researchers may also benefit from reviewing relevant HCI literature. For example, the framework proposed by Conn (1995) that describes eight progress indicator task properties could be a starting point in designing experiments that manipulate those properties in survey research. Future studies may also benefit from an enriched theoretical understanding of the functioning of progress feedback in a survey context. The inconsistent effect of progress indicators on drop-offs suggests that we may not yet fully understand the mental processes underlying respon-dents’ judgment about cost and reward and their decisions about whether to continue or to quit the survey. For example, psychological research has shown that people’s perception and judgment about duration may differ across types of tasks as well as between completed versus prospective tasks (Avni-Babad & Ritov, 2003; Block & Zakay, 1997; Fraisse, 1963; Zakay & Block, 2004). Conrad and col-leagues (2010) also noted research that showed a relationship between task experience and duration judgment (London & Monello, 1974; Sackett, Meyvis, Nelson, Converse, & Sackett, 2010) and between frequency of feedback and such judgment (Polkosky & Lewis, 2002). Research using eye-tracking movement devices could analyze how often and when respondents seek feedback and help us understand how that affects decisions to drop off or to continue a survey. Eye-tracking research combined with cognitive interviews and think-aloud techniques could shed more light on the cognitive processes of respondents when doing a survey with a progress bar and the expectations they set.
Furthermore, judgments about costs and rewards and the resulting decision making may not be entirely ‘‘rational’’ and are subject to cognitive bias and heuristics. Conrad and colleagues (2010) made reference to a loss-aversion bias, and Yan and colleagues (2011) noted the sunk cost bias as one possible explanation for the effect of progress indicators on survey taking. Because our inter-ests is to find ways to improve survey completion and response quality, future research on progress indicators should take these psychological theories into account.
Finally, from a total survey error perspective, there is a lack of research on the effect of progress indicators on measurement error. Would the use of progress indicators reduce drop-off rates by having respondents with low engagement in the task complete the survey, thus increasing response rates but possibly increasing measurement error? Of course, given that most studies have found either no effect or a negative effect of progress indicators on drop-offs, there has been little opportunity for such analysis. However, in those studies where drop-offs decreased with progress indicators, it might be worthwhile to analyze the quality of answers provided by those who would have dropped out had there been no feedback to indicate their progress.
Authors’ Note
Declaration of Conflicting Interests
The author(s) declared no potential conflicts of interest with respect to the research, authorship, and/or publi-cation of this article.
Funding
The author(s) received no financial support for the research, authorship, and/or publication of this article.
Notes
1. In the new 2011 edition of the European Society for Opinion and Marketing Research guidelines, there is no mention of progress indicators.
2. This study could not be located. We are using the summary by the same authors reported in their 2011 article (Hamada, Yoshida, Ohnishi, & Koppen, 2011).
3. The search for studies stopped in October 2012; therefore, any study published thereafter is not included in this meta-analysis.
4. In subgroup analysis, there are two diamond shapes, each representing the pooled logged odds ratio of one of the groups.
5. Information on whether an incentive had been offered to respondents was available for all studies. Incentives were always given upon completion, and they were generally in the form of points or to make the respondent eligible to enter a sweepstake.
6. These overstatements and understatements were part of the manipulations implemented by Yan et al. (2011). 7. Progress indicators are deceptive when the information presented is an intentional distortion of the actual progress respondents have made. It should be noted, however, that progress indicators with a varying speed design need not be deceptive if they accurately mirror the responding process. Furthermore, the research cited here where progress bar speed was manipulated was not deceptive; researchers were not trying to encourage respondents to participate but rather were trying to find the mechanism to explain the effect of progress indicators on drop-off rates.
Supplemental Material
The online Supplementary Appendix is available at http://goo.gl/lhyAy.
References
References marked with an asterisk indicate studies included in the meta-analysis.
Avni-Babad, D., & Ritov, I. (2003). Routine and the perception of time.Journal of Experimental Psychology: General,132, 543–550.
Bax, L., Ikeda, N., Fukui, N., Yaju, Y., Tsuruta, H., & Moons, K. G. M. (2009). More than numbers: The power of graphs in meta-analysis.American Journal of Epidemiology,169, 249–255.
Bax, L., Yu, L.-M., Ikeda, N., & Moons, K. G. (2007). A systematic comparison of software dedicated to meta-analysis of causal studies.BMC Medical Research Methodology,7, 40.
Bax, L., Yu, L.-M., Ikeda, N., Tsuruta, H., & Moons, K. G. M. (2006). Development and validation of MIX: Com-prehensive free software for meta-analysis of causal research data.BMC Medical Research Methodology,6, 50. Block, R. A., & Zakay, D. (1997). Prospective and retrospective duration judgments: A meta-analytic review.
Psychonomic Bulletin & Review,4, 184–197.
*Bo¨hme, R. (2011).Research note on progress indicators in online surveys. Retrieved from http://www.is.uni-muenster.de/security/publications/Boehme2003_Progress_Bar_Summary.pdf
Borenstein, M., Hedges, L. V., Higgins, J. P. T., & Rothstein, H. R. (2009).Introduction to meta-analysis. Hoboken, NJ: John Wiley.
Borenstein, M., Hedges, L. V., Higgins, J. P. T., & Rothstein, H. R. (2011).Comprehensive meta analysis. Englewood, NJ: Biostat.
Braun Hamilton, M. (n.d.).Attrition patterns in online surveys. Analysis and guidance for industry. Retrieved from http://www.supersurvey.com/papers/supersurvey_white_paper_attrition.htm
Conn, A. P. (1995).Time affordances: the time factor in diagnostic usability heuristics. InProceedings of the SIGCHI Conference on Human Factors in Computing Systems(pp. 186–193). New York, NY, USA: ACM Press/Addison-Wesley Publishing Co.
Conrad, F. G., Couper, M. P., Tourangeau, R., & Peytchev, A. (2003). Effectiveness of progress indicators in web surveys: It’s what’s up front that counts. In R. Banks (Ed.),Survey and statistical computing IV. The impact of technology on the survey process(pp. 1–10). London, England: Association for Survey Computing. Conrad, F. G., Couper, M. P., Tourangeau, R., & Peytchev, A. (2005). Impact of progress feedback on task
completion: First impressions matter.CHI ’05 extended abstracts on Human factors in computing systems (pp. 1921–1924). Portland, OR: ACM Press.
*Conrad, F. G., Couper, M. P., Tourangeau, R., & Peytchev, A. (2010). The impact of progress indicators on task completion.Interacting with Computers,22, 417–427.
Couper, M. P. (2008).Designing effective web surveys. New York, NY: Cambridge University Press. Couper, M. P., Traugott, M. W., & Lamias, M. J. (2001). Web survey design and administration. Public
Opinion Quarterly,65, 230–253.
*Crawford, S. D., Couper, M. P., & Lamias, M. J. (2001). Web surveys. Perception of burden.Social Science Computer Review,19, 146–162.
Crawford, S. D., McCabe, S. E., Saltz, B., Boyd, C. J., Freisthler, B., & Pascall, M. (2004).Gaining respon-dent cooperation in college based web based alcohol surveys: Findings from experiments at two univer-sities. Paper Presented at the Annual Meeting of the American Association for Public Opinion Research, Phoenix, AZ.
Deeks, J. J., Higgins, J. P. T., & Altman, D. G. (2008). Chapter 9: Analysing data and undertaking meta-analyses. In J. P. T. Higgins & S. Green (Eds.),Cochrane handbook for systematic reviews of interventions (pp. 243–96). Chichester, England: Wiley.
DerSimonian, R., & Laird, N. (1986). Meta-analysis in clinical trials.Controlled Clinical Trials,7, 177–188. Dickersin, K. (2005). Publication bias: Recognizing the problem, understanding its origins and scope, and preventing harm. In H. R. Rothstein, A. J. Sutton, & M. Borenstein (Eds.), Publication bias in meta-analysis. Prevention, assessment and adjustments(pp. 11–33). Chichester, England: Wiley.
Dillman, D. A., Smyth, J. D., & Christian, L. M. (2009).Internet, mail and mixed-mode surveys: The tailored design method(3rd ed.). Hoboken, NJ: John Wiley.
Enomoto, T., Ohnishi, K., & Yoshida, K. (2006).A study on the relationship between progress bar movement and subjective speed impression (in Japanese). Proceedings of the 8th Annual Conference of Japan Society for Fuzzy Theory and Intelligent Informatics, Kyushu chapter (pp. 37–40). Retrieved from http://infonet.cse. kyutech.ac.jp/en/research_detail.php?oid¼142
ESOMAR. (2005). Guidelines on conducting market and opinion research using the Internet. Retrieved October 2010, from http://www.esomar.org/uploads/professional_standards/guidelines/ESOMAR_Codes& Guidelines_Conducting-research-using-Internet.pdf
ESOMAR. (2011). Esomar guideline for online research. Retrieved from http://www.esomar.org/uploads/ public/knowledge-and-standards/codes-and-guidelines/ESOMAR_Guideline-for-online-research.pdf Forsman, G., & Varedian, M. (2002).Mail and web surveys: A cost and response rate comparison in a study of
students housing conditions. Linko¨ping, Sweden: Linko¨ping University. Retrieved January 2010, from http://www.statistics.su.se/modernsurveys/publ/16.pdf
Fraisse, P. (1963).The psychology of time(J. Leith, Trans.). New York, NY: Harper & Row. (Original work published 1957).
Hamada, K., Yoshida, K., Ohnishi, K., & Koppen, M. (2011).Color effect on subjective perception of progress bar speed. Proceedings of the 2011 Third International Conference on Intelligent Networking and Collaborative Systems, INCOS’11 (pp. 863–866). Washington, DC: IEEE Computer Society.
Harrison, C., Amento, B., Kuznetsov, S., & Bell, R. (2007).Rethinking the progress bar. Proceedings of the 20th Annual ACM Symposium on User Interface Software and Technology, UIST ’07 (pp. 115–118). New York, NY: ACM Press.
*Healey, B., Macpherson, T., & Kuijten, B. (2005). An empirical evaluation of three web survey design principles.Marketing Bulletin,16, 9.
Heerwegh, D. (2004).Using progress indicators in web surveys. Paper presented at the 59th Conference of the American Association for Public Opinion Research, Phoenix, AZ.
*Heerwegh, D., & Loosveldt, G. (2006). An experimental study on the effects of personalization, survey length statements, progress indicators, and survey sponsor logos in web surveys.Journal of Official Statistics,22, 191–210.
Higgins, J. P. T., Thompson, S. G., Deeks, J. J., & Altman, D. G. (2003). Measuring inconsistency in meta-anal-yses.BMJ,327, 557–60.
Hunter, J. E. , & Schmidtn, F. L. (2004).Methods of meta-analysis: correcting error and bias in research fin-dings(2nd ed.) Thousand Oaks, CA:Sage.
*Jacobs, R. (2007).A light at the end of the tunnel. . .Progress indicators and their influence on completion rates, per-page dropout rates and task durations in online browser surveys. Maastricht, the Netherlands: Faculty of Economics and Business Administration. Retrieved from http://arno.unimaas.nl/show.cgi?fid¼11481 *Kaczmirek, L. (2009). Human-survey interaction. Usability and nonresponse in online surveys. Cologne,
Germany: Halem Verlag.
London, H., & Monello, L. (1974). Cognitive manipulation of boredom. In H. London & R. Nisbett (Eds.), Thought and feeling(pp. 44–59). Chicago, IL: Aldine.
*Matzat, U., Snijders, C., & van der Horst, W. (2009). Effects of different types of progress indicators on drop-out rates in web surveys.Social Psychology,40, 43–52.
Myers, B. A. (1983). INCENSE: A system for displaying data structures.SIGGRAPH Computer Graphics,17, 115–125.
Myers, B. A. (1985). The importance of percent-done progress indicators for computer-human interfaces. Proceedings of the SIGCHI conference on Human factors in computing systems. CHI’85 (pp. 11–17). New York, NY: ACM Press.
Polkosky, M. D., & Lewis, J. R. (2002). Effect of auditory waiting cues on time estimation in speech recogni-tion telephony applicarecogni-tions.International Journal of Human-Computer Interaction,14, 423–446. *Rao, K., & Couper, M. P. (2009).Clarifying the ‘‘Progress’’ of progress indicators. Paper presented at the
64th Annual Conference of the American Association for Public Opinion Research, Hollywood, FL. Sackett, A. M., Meyvis, T., Nelson, L. D., Converse, B. A., & Sackett, A. L. (2010). You’re having fun when
time flies the hedonic consequences of subjective time progression.Psychological Science,21, 111–117. Sakshaug, J. W., & Crawford, S. D. (2010). The impact of textual messages of encouragement on web survey
breakoffs: An experiment.International Journal of Internet Science,4, 50–60.
Spicer, R., & Dowling, Z. (2012).Is ‘‘chapterisation’’ a viable alternative to traditional progress indicators? Paper presented at the General Online Research (GOR) Conference. Retrieved from http://conftool.gor.de/ conftool12/index.php?page¼downloadPaper&filename¼Dowling-Is_%E2%80%9Cchapterisation%E2%80%
9D_a_viable_alternative-128.pdf&form_id¼128&form_version¼final
Sue, V. M., & Ritter, L. A. (2012).Conducting online surveys(2nd ed.). Thousand Oaks, CA: Sage. Wallace, B., Schmid, C., Lau, J., & Trikalinos, T. (2009). Meta-analyst: software for meta-analysis of binary,
continuous and diagnostic data.BMC Medical Research Methodology,9, 80.
Zakay, D., & Block, R. A. (2004). Prospective and retrospective duration judgments: An executive-control perspective.Acta Neurobiologiae Experimentalis,64, 319–328.
Author Biographies
Ana Villaris a research fellow at the Centre for Comparative Social Surveys of City University London where she coordinates the mixed-mode research program of the European Social Survey. She holds a PhD in survey research and methodology from the University of Nebraska, Lincoln. Her research interests include survey trans-lation, answer scales design, web surveys, cross-cultural surveys, and nonresponse error related to break-offs; email: [email protected].
Mario Callegarois the survey research scientist at Google, London. He holds a PhD in survey research and methodology from the University of Nebraska, Lincoln. He is an associate editor ofSurvey Research Methods and in the editorial board of theInternational Journal of Market Research. His research interests are quality of data obtained from online panels, web surveys methodology, and new methods of collecting survey data; email: [email protected].