Edited by:
Laura Ann Boyle, Teagasc, Ireland
Reviewed by:
Christoph Winckler, University of Natural Resources and Life Sciences, Austria Janicke Nordgreen, Norwegian University of Life Sciences, Norway Keelin Katherine Mary O’Driscoll, Teagasc, Ireland
*Correspondence:
Vivi M. Thorup [email protected]
Specialty section:
This article was submitted to Animal Behavior and Welfare, a section of the journal Frontiers in Veterinary Science
Received: 04 November 2015
Accepted: 25 April 2016
Published: 10 May 2016
Citation:
Thorup VM, Nielsen BL, Robert P-E, Giger-Reverdin S, Konka J, Michie C and Friggens NC (2016) Lameness Affects Cow Feeding But Not Rumination Behavior as Characterized from Sensor Data. Front. Vet. Sci. 3:37. doi: 10.3389/fvets.2016.00037
lameness affects cow Feeding But
not rumination Behavior as
characterized from sensor Data
Vivi M. Thorup1*, Birte L. Nielsen2, Pierre-Emmanuel Robert1, Sylvie Giger-Reverdin1, Jakub Konka3, Craig Michie3,4 and Nicolas C. Friggens11INRA, AgroParisTech, Université Paris-Saclay, UMR 791 Modélisation Systémique Appliquée aux Ruminants, Paris, France, 2 NBO, INRA, Université Paris-Saclay, Jouy-en-Josas, France, 3Department of Electronic and Electrical Engineering,
University of Strathclyde, Glasgow, UK, 4Silent Herdsman Ltd., Glasgow, UK
Using automatic sensor data, this is the first study to characterize individual cow feeding and rumination behavior simultaneously as affected by lameness. A group of mixed- parity, lactating Holstein cows were loose-housed with free access to 24 cubicles and 12 automatic feed stations. Cows were milked three times/day. Fresh feed was delivered once daily. During 24 days with effectively 22 days of data, 13,908 feed station visits and 7,697 rumination events obtained from neck-mounted accelerometers on 16 cows were analyzed. During the same period, cows were locomotion scored on four occasions and categorized as lame (n = 9) or not lame (n = 7) throughout the study. Rumination time, number of rumination events, feeding time, feeding frequency, feeding rate, feed intake, and milk yield were calculated per day, and coefficients of variation were used to estimate variation between and within cows. Based on daily sums, using each characteristic as response, the effects of lameness and stage of lactation were tested in a mixed model. With rumination time as response, each of the four feeding characteristics, milk yield, and lameness were tested in a second mixed model. On a visit basis, effects of feeding duration, lameness, and milk yield on feed intake were tested in a third mixed model. Overall, intra-individual variation was <15% and inter-individual variation was up to 50%. Lameness introduced more inter-individual variation in feeding characteristics (26–50%) compared to non-lame cows (17–29%). Lameness decreased daily feeding time and daily feeding frequency, but increased daily feeding rate. Interestingly, lameness did not affect daily rumination behaviors, fresh matter intake, or milk yield. On a visit basis, a high feeding rate was associated with a higher feed intake, a relationship that was exacerbated in the lame cows. In conclusion, cows can be characterized in particular by their feeding behavior, and lame cows differ from their non-lame pen-mates in terms of fewer feed station visits, faster eating, less time spent feeding, and more variable feeding behavior. Further, daily rumination time was slightly negatively associated with feeding rate, a relationship which calls for more research to quantify rumination efficiency relative to feeding rate.
inTrODUcTiOn
Disease incidence during early lactation is substantial in dairy cows (1). Automated monitoring can replace subjective and time-consuming visual observations and provide early iden-tification and facilitate provision of treatment of vulnerable animals, which in itself is valuable. Additionally, precision livestock farming (PLF) technologies (2) such as accelerom-eters that provide individual time-series of activity present a unique opportunity to refine the phenotypic characterization of dairy cows. For instance, the variability associated with time-series data from PLF technologies can be used to esti-mate a complex phenotypic trait like robustness, see Ref. (3), which will be valuable for individually targeted management, disease prevention, and not least genetic selection. Currently, the utilization of PLF technologies for phenotyping is largely unexploited (4).
Most diseases affect the feeding and rumination behavior of the cow, and changes in feeding and rumination are key behavioral indicators of compromised health in ruminants. An example of this is the decrease in rumination and feeding time of cows following subjection to a mastitis challenge (5). Rumination time and feeding rate decreased, whereas feeding time increased in cannulated cows the day after being subjected to a ruminal acidosis challenge (6). In goats, a feeding pattern of few, long meals (vs. more frequent and shorter meals) has been linked with a lower rumen pH, which may increase the risk of rumen acidosis (7). Lameness has been shown to affect a number of behavior characteristics, in terms of decreased daily feed intake, feeding time (8–10), decreased rumination time (8, 11), and increased feeding rate (9, 10). However, none of these studies investigated lameness, rumination, and feeding behavior at the same time.
Other factors, such as lactation stage, management, feed composition, and environment, influence feeding and rumina-tion behaviors. During early lactarumina-tion, feed intake increases (12), and cows have been found to exhibit rumination peaks 1–2 h after feeding peaks (13). Moreover, decreasing forage particle size decreased daily feeding and rumination time (14). Not least, cows are gregarious animals that often synchronize behavior; therefore, their social and physical environment may impose constraints on their feeding and rumination (15). It is important to take these influential factors into account when studying changes to feeding and rumination in relation to lameness.
Automated technologies that measure in real time can detect short-term behavioral changes, such as decreases in feed intake, feeding rate, and feeding and rumination time around estrus (16). Moreover, lameness has been found to decrease night-time rumi-nation (17). To the best of our knowledge, the effect of lameness on feeding and rumination behavior measured simultaneously using PLF technologies has not yet been studied. This study aimed to characterize the individual feeding and ruminating behavior of dairy cows based on data from automated feed stations and neck-mounted accelerometers measuring movements over time in three dimensions, and to quantify the effect of lameness on feeding and rumination.
MaTerials anD MeThODs
animals and housing
The experiment was carried out at the research farm of Scotland’s Rural College (Crichton Royal Farm, Dumfries, UK), 20 lactating Holstein Friesian cows were loose housed in one pen. The pen had 24 cubicles with rubber mattresses, top-dressed with saw dust, and grooved concrete floors in the alleys with automatic scrapers. Cows were milked three times daily in a milking parlor: the milking periods ranged from 0730 to 1000 h; 1430 to 1630 h; and 2130 to 2330 h. The cows left the pen as a group for about 40 min/milking. In the milking parlor, the cows were offered 0.6 kg concentrate/day spread over the three milkings. In addi-tion, high yielding cows were offered 1 kg/day concentrate extra per 3 l milk yield above 30 l/day, i.e., a cow yielding 36 l milk/ day would receive 2.6 kg concentrate/day in the parlor. The feed offered during milking is not included in the analysis reported here, and only one cow (which was not lame) did consistently yield >30 l/day during the experiment. Cows had ad libitum
access to water from two water troughs, one at each end of the pen. Water intake was not recorded. The experiment started on June 23, 2014, hereafter referred to as day 1, and lasted for 24 days. The cows were permanently in the pen from day 6 and throughout the experimental period, except for short periods during normal farm routines such as milking and pregnancy detection.
All 20 cows were equipped with neck-mounted accelerometers. However, two cows past 22 months in lactation were excluded from analysis, and accelerometer data could not be retrieved from two cows, leaving 16 cows in the final data set used for analysis. Two cows were in their first lactation, six cows were in their second lactation, and eight cows were in their third lactation or more (mean number of days in milk was 238 ± 91.1 days). At trial end, 8 of the 16 cows were pregnant (mean number of days in gestation was 137 ± 80.2 days). Milk yield from the three daily milkings was obtained for 285 cow days (out of 311) for which mean milk yield was 22.4 ± 7.13 l/day.
locomotion scoring
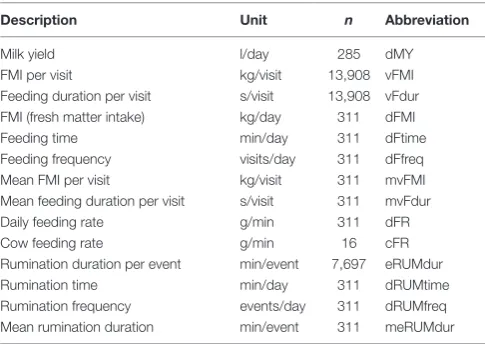
TaBle 1 | Descriptions, units, number of records, and abbreviations used in text for all behavior and milk yield characteristics.
Description Unit n abbreviation
Milk yield l/day 285 dMY
FMI per visit kg/visit 13,908 vFMI
Feeding duration per visit s/visit 13,908 vFdur
FMI (fresh matter intake) kg/day 311 dFMI
Feeding time min/day 311 dFtime
Feeding frequency visits/day 311 dFfreq
Mean FMI per visit kg/visit 311 mvFMI
Mean feeding duration per visit s/visit 311 mvFdur
Daily feeding rate g/min 311 dFR
Cow feeding rate g/min 16 cFR
Rumination duration per event min/event 7,697 eRUMdur
Rumination time min/day 311 dRUMtime
Rumination frequency events/day 311 dRUMfreq
Mean rumination duration min/event 311 meRUMdur
until treatment for digital dermatitis 12 days from the end of the study. We categorized this cow as belonging to the lame group. According to this lameness categorization (not lame vs. lame), seven cows were not lame, and nine cows were lame throughout the experiment.
Feed and Feed stations
Cows were fed a total mixed ration (TMR), which was a mixture of grass silage, concentrates in pellets, wheat, wheat straw, and additives with an average of 387 g dry matter (DM)/kg feed, 344 g neutral detergent fiber (NDF)/kg DM, 185 g crude protein/kg DM, 43.3 g fat/kg DM, and a metabolizable energy content of 11.8 mj/ kg DM. The TMR was distributed in 12 automated feed stations (Roughage Intake Control System, Insentec BV, Marknesse, The Netherlands) recording weight to the nearest 0.1 kg. There were barriers on the sides of each feed station to minimize displace-ments and stealing. The use of these feed stations for characteriz-ing feedcharacteriz-ing behavior has been described earlier (19). All cows had access to all feed stations. A preliminary Wilcoxon test of the lame group vs. the not lame group showed that lameness did not affect how cows distributed their feed intake between feed stations. Fresh TMR was distributed once daily before noon. Fresh matter intake (FMI) was recorded around the clock, except from 1,145 to 1,215 h due to a feed station resetting procedure, yet cows had access to the feed stations at all times. By examining the differ-ences in feed bin content before and after the resetting procedure, we calculated that a daily average of 2.8 kg fresh matter (FM)/feed station (range from 0 to 11.4 kg) was eaten without being assigned to cows. Per cow, this corresponds to 1.7 kg/day of unaccounted FMI. Given a feeding rate of 250 g/min, this amount would take less than 7 min to eat. For historical reasons, a maximum FMI of 5 kg/visit was allowed, meaning that at 5 kg, the feed station door went up, thus forcing the cow to withdraw from the feed station. However, cows were able to override the limit by keeping the door down. Feeding time was assumed to be equal to visit duration even though the cow may not have been actively ingesting feed during the entire visit.
Feed Data cleaning
Visits with a duration of 0 s (145 out of 14,053 visits) were excluded. For each individual cow, FMI was regressed on visit duration with the regression line passing through the origin. A double check similar, but not identical to the one described by Bossen et al. (20) was performed. In a first check, outliers were identified as (1) visits deviating more than ±5 SD units from the first regression line, and (2) visits with both a duration <4 s and FMI >0.1 kg. The outliers were set to missing, a second regression was performed, and the missing values were replaced by values calculated from the coefficients of the second regression. In a second check, visits deviating more than ±5 SD units from the second regression line were immediately replaced by values cal-culated from the coefficients of the second regression. For visits with a large or negative FMI, FMI was replaced. For long visits with a low FMI, duration was replaced. For visits <4 s with FMI >0.1 kg, duration was replaced. Out of 13,908 feed station visits, 3.4% of the visits were affected by these data checks: 264 FMI and 202 durations.
accelerometers and rumination
classification
The cows were equipped with a neck-collar fitted with an accelerometer (Silent Herdsman Ltd., Glasgow, UK) sampling in three dimensions at 12 Hz. The accelerometers were a prototype; therefore, data were stored on the SD-card of the accelerometer and transferred manually to a local computer when the acceler-ometers were taken off. To ensure data storage, two batches of accelerometers were used in serial. The first batch collected data from day 1 to 9 and the second batch collected data from day 10 to 25. Because days 9 and 10 were not full days of data collection, they were removed from the data set. Unfortunately, data from four accelerometers were corrupted either in the beginning or in the end of the experimental period. Therefore, the accelerometer data consisted of time-series from 16 cows with on average 19.4 full days of data (ranging from 8 to 22 days), in total 311 cow days.
A combination of the estimated variance in the accelerometer signal (an expression of energy content) and the frequency con-tent derived from the Fourier transformed accelerometer signal were used for classification of rumination (21). The classification was validated by use of a RumiWatch halter (Itin ± Hoch GmbH, Liestal, Switzerland), which detects rumination via a pressure sensor (22). Using Hidden Markow Models, rumination was clas-sified with a sensitivity of 86.1% and a positive predictive value of 98.7% (21). There were 7,697 events of rumination during the 311 cow days. All rumination and feeding characteristics used for analysis are described in Table 1.
statistical analysis
Yijk= +µ LAME DIM LAME DIM cowi+ j+ i× j+ k+εijk (M1)
Y represents the variables summarized on a daily basis, μ was the overall mean, lameness (LAME; i = lame; not lame), days in milk (DIM, j = 54, …, 384 days), and their interaction term were fixed effects, cow (k = 1, …, 16) was random effect, and ε was the error term. If the interaction term was non-significant, the model was re-run without the interaction. Visual inspection of residual plots did not reveal any obvious deviations from homoscedastic-ity or normalhomoscedastic-ity. P-values were obtained by likelihood ratio test of the full model against the reduced model (Yijk = μ + cowk + εijk). Significance was determined as P < 0.05.
Preliminary analysis of the variables summarized on a daily basis showed that the Pearson correlation coefficients between daily rumination time and feeding time (r = 0.22, P < 0.001) and between rumination time and milk yield were small (r = 0.31,
P < 0.001). The highest correlation was between feeding time and feeding rate (r = −0.66, P < 0.001). Although daily rumination time was not found to be affected by lameness in M1, it could rea-sonably be expected to be affected by daily feeding characteristics (Table 1) and milk yield. Accordingly, this was assessed using the following model, which includes lameness because some of the feeding characteristics were influenced by this factor:
dRUMtime LAME MILK dFchar LAME dFchar MILK dFchl
ikl i l
i
= + + +
+ × + ×
µ
aar
LAME MILK LAME MILK dFchar cowl
+ i× + i× l× + k+εikl
(M2) In M2, dFchar represents either daily feeding time, feeding rate, FMI or feeding frequency. Lameness (LAME; i = lame; not lame), daily milk yield (MILK; l = 4.9, …, 44.5 l/day), dFchar, and all their interactions were fixed effects. As random effects, we fitted cow (k = 1, …, 16), and ε was the error term. Models were reduced by omitting non-significant interactions one by one, starting with the three-way interaction. The residual sum of squares (RSS) was calculated for each model to enable calculation of R2, which we did using the RSS from a model only containing the intercept and cow as random effect, thereby expressing total variation in data the following way: R2 = (total variation − model variation)/total variation. For model comparison, we used a combination of R2, AIC, and BIC to decide which of the feeding characteristics yielded the best fitting model.
When looking at feeding behavior within day, i.e., at the level of feed station visits, it is well known that there is a relation between intake per visit (vFMI) and visit duration (vFdur). Thus, we tested whether the slope of this relationship was affected by lameness and also by milk yield, using the following model:
vFMI vFdur LAME vFdur
MILK vFdur cow vFdur
ikm i
m k
a b
c d
= × + × ×
+ × × + × × + εiikm (M3)
where a, b, c, and d are slope coefficients. As fixed effects, we used vFdur (continuous variable), the interaction terms between vFdur and mean lameness score during the experiment (LAME;
j = 1.25, …, 4.25) and between vFdur and mean milk yield during the experiment (MILK; m = 10.3, …, 37.0 l/day), respectively.
No intercept was fitted as by definition zero vFdur can only have zero vFMI, this also allows us to test the slopes for significant differences due to lameness (interaction terms on vFdur). As random effects, we fitted the interaction between vFdur and cow (k = 1, …, 16) to allow for a random slope for the effect of vFdur for each cow, and ε was the error term.
resUlTs
inter- and intra-individual Variation
The inter-individual and intra-individual means, SD and CV for the feeding and rumination characteristics on a daily basis are reported by lameness category in Table 2. In general, the intra-individual variation was low, i.e., 5–15% for both lame and non-lame cows, whereas inter-individual variation was much higher, up to 50%. However, lameness did not affect feeding and rumi-nation behaviors in the same way, because the inter-individual variation of the feeding characteristics was much higher in the lame cows (26–50%) than in non-lame cows (17–29%), contrary to the inter-individual variation of the rumination characteristics, which differed less regardless the lameness status (10–20%).
Feeding, rumination, and lameness
effects
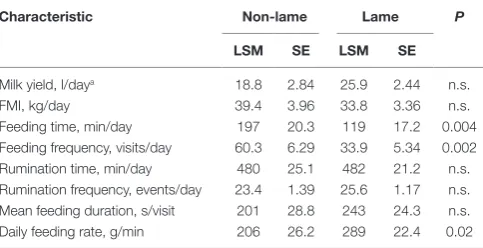
The least square mean (LSM), SE, and P-values for the effect of lameness on daily feeding and rumination behavior sums derived from M1 are reported in Table 3. The interaction between lame-ness and DIM was insignificant for all variables with the excep-tion of mean FMI per visit, so the results in the table are from the reduced model containing only the main effect of lameness. Lameness affected several of the feeding behaviors significantly but none of the rumination behaviors: lame cows made 46% less visits to the feed stations and fed for 44% shorter per day than non-lame cows. Contrastingly, lame cows ate 40% faster than their non-lame pen-mates. A significant interaction between lameness and DIM meant that lame cows in early lactation had a larger mean FMI per visit than non-lame cows (−0.004 kg/visit per day, SE = 0.0014, P = 0.006), but this difference between lame and non-lame cows in mid to late lactation diminished. Feeding time increased significantly with DIM (0.32 min/day, SE = 0.129,
P = 0.03). Cows ruminated 481 min/day with a frequency of about 25 events/day, both unaffected by lameness and DIM. Daily milk yield and daily FMI did not differ significantly between lame and non-lame cows, but as expected, milk yield decreased significantly with DIM (−0.05 l/day, SE = 0.015, P < 0.001), and FMI increased significantly with DIM (0.07 kg/day, SE = 0.026,
P = 0.01).
TaBle 3 | least square means (lsM), se, and P-values for daily feeding, rumination, and milk yield characteristics of the effect of lameness derived from model 1 (M1).
characteristic non-lame lame P
lsM se lsM se
Milk yield, l/daya 18.8 2.84 25.9 2.44 n.s.
FMI, kg/day 39.4 3.96 33.8 3.36 n.s.
Feeding time, min/day 197 20.3 119 17.2 0.004
Feeding frequency, visits/day 60.3 6.29 33.9 5.34 0.002
Rumination time, min/day 480 25.1 482 21.2 n.s.
Rumination frequency, events/day 23.4 1.39 25.6 1.17 n.s. Mean feeding duration, s/visit 201 28.8 243 24.3 n.s.
Daily feeding rate, g/min 206 26.2 289 22.4 0.02
Cows with a locomotion score ≥3 were defined as lame, n = 311 cow days, hereof 129 non-lame and 182 lame cow days.
aMilk yield based on 285 cow days, hereof 123 non-lame and 162 lame cow days.
[image:5.595.46.288.336.460.2]FMI, fresh matter intake.
TaBle 2 | inter-individual and intra-individual mean, sD, and coefficient of variation (cV, %) by lameness category for the feeding, rumination, and milk characteristics, n = 311 cow days, hereof 129 non-lame and 182 lame cow days.
inter-individual intra-individual
non-lame lame non-lame lame
Mean sD cV Mean sD cV Mean sD cV mean sD cV
Milk yield, l/daya 21.4 8.85 41.4 24.7 5.96 24.1 19.4 2.82 14.5 24.6 1.35 5.5
FMI, kg/day 36.0 6.48 18.0 35.5 9.63 27.1 36.0 2.21 6.1 35.0 3.35 9.6
Feeding time, min/day 182 37.4 20.5 126 44.2 35.1 186 19.4 10.4 122 15.1 12.4
Feeding frequency, visits/day 57.9 10.1 17.4 35.1 17.8 50.1 58.0 5.60 9.7 35.2 3.17 9.0
Mean FMI, kg/visit 0.66 0.190 28.8 1.16 0.363 31.3 0.66 0.058 8.8 1.15 0.107 9.3
Mean feeding duration, s/visit 195 45.9 23.5 246 80.6 32.8 199 21.9 11.0 240 25.2 10.5
Daily feeding rate, g/min 206 48.1 23.3 289 74.4 25.7 203 14.2 7.0 294 17.1 5.8
Rumination time, min/day 490 73.6 15.0 478 46.4 9.7 482 25.2 5.2 480 25.1 5.2
Rumination frequency, events/day
24.5 4.79 19.6 25.0 4.26 17.0 24.4 2.75 11.3 25.0 2.56 10.2
Mean rumination duration, min/event
20.8 3.59 17.2 20.1 3.60 17.9 20.8 2.82 13.6 20.3 2.17 10.7
aMilk yield based on 285 cow days, hereof 123 non-lame and 162 lame cow days.
FMI, fresh matter intake.
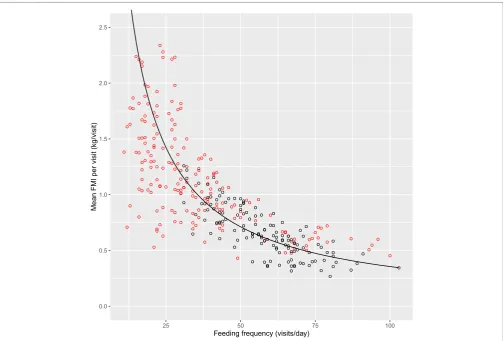
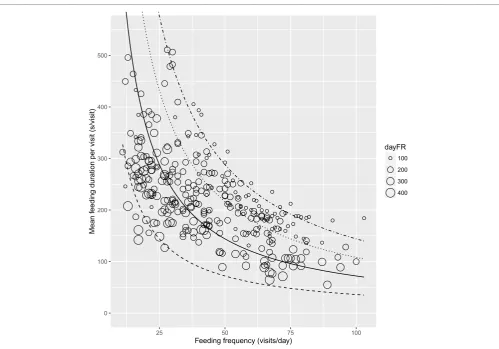
The association between mean FMI per visit and feeding fre-quency grouped by lameness category is shown in Figure 2 with a line indicating the overall mean FMI of 35.6 kg/day. The fewer feeder visits with higher intakes for the lame cows is evident in the clustering of the data points toward the upper left-hand part of the FMI line (Figure 2). Figure 3 shows mean feeding duration per feeding frequency grouped by daily feeding rate with the lines indicating constant feeding times of 1, 2, 3, and 4 h/day.
Based on the 13,908 feed station visits, M3 explored how the relationship between duration (vFdur) and intake per visit (vFMI), which is the feeding rate, was affected by locomotion score and milk yield, both of which were significant. Thus, the feeding rate estimate was 119 g/min (SE = 3.95, P < 0.001). Feeding rate increased a highly significant 36 g/min per increas-ing locomotion score unit (SE = 1.05, P < 0.001), whereas the increase of 0.32 g/min/l milk (SE = 0.16, P = 0.04) was much smaller yet significant.
associations between Feeding and
rumination
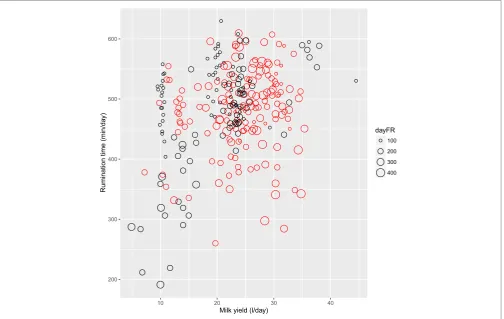
The results of the model (M2) testing which aimed to explain the variation in daily rumination time by one of four feeding behavior characteristics, lameness, and milk yield are presented in Table 4, where the model name, RSS, R2, AIC, and BIC are reported. All models with more than one main effect were tested with interactions and with the exception of FMI; they could be reduced to contain only the main effects. In general, AIC and BIC were similar across all models, however, the models containing all three explanatory variables, i.e., milk yield, lameness, and one of the feeding behavior characteristics achieved the highest R2 and lowest RSS and AIC. Thus, an increase in R2 from 13 to 37% was achieved but at a relatively high cost in terms of additional explanatory variables. Of the models containing three main effects and no interactions, the models with feeding rate (M2.3.2) and feeding frequency (M2.3.3) performed equally well. In the model with feeding rate (M2.3.2), daily rumination time of 461 min/day (SE = 36.9) decreased slightly but significantly with increasing feeding rate (-0.24 min/day, SE = 0.09, P = 0.009), increased with increasing milk yield (3.57 min/day, SE = 1.10, P = 0.001), but was not affected significantly by lameness (−1.66 min/day, SE = 27.79, P > 0.05). Figure 4 depicts rumination time per day relative to feeding rate per day grouped by lameness and daily milk yield. With feeding frequency as explanatory variable (M2.3.3), the daily rumination time of 457 min/day (SE = 37.8) decreased with increasing feeding frequency (−0.83 min/day, SE = 0.31, P = 0.009); again milk yield increased rumination time significantly (3.71 min/day, SE = 1.14, P = 0.001), whereas lameness did not affect rumination (−40.9 min/day, SE = 30.9,