• No results found

Modelling the effects of fishing on the North Sea fish community size composition

N/A
N/A
Protected

Academic year: 2019

Share "Modelling the effects of fishing on the North Sea fish community size composition"

Copied!
11
0
0

Loading.... (view fulltext now)

Full text

(1)

ContentslistsavailableatScienceDirect

Ecological

Modelling

j o u r n al ho me p ag e :w w w . e l s e v i e r . c o m / l o c a t e / e c o l m o d e l

Modelling

the

effects

of

fishing

on

the

North

Sea

fish

community

size

composition

Douglas

C.

Speirs

a,∗

,

Simon

P.R.

Greenstreet

b

,

Michael

R.

Heath

a

aDepartmentofMathematicsandStatistics,UniversityofStrathclyde,GlasgowG11XH,UK

bMarineScotlandScience,MarineLaboratory,POBox101,375VictoriaRoad,AberdeenAB119DB,UK

a

r

t

i

c

l

e

i

n

f

o

Articlehistory: Received18March2015

Receivedinrevisedform23October2015 Accepted27October2015

Keywords:

Length-structuredpopulationmodel Multi-speciesmodel

NorthSea Fisheries

Ecosystem-basedmanagement Largefishindicator(LFI)

a

b

s

t

r

a

c

t

Ecosystem-basedmanagementoftheNorthSeademersalfishcommunityusesthelargefishindicator

(LFI),definedastheproportionbyweightoffishcaughtintheInternationalBottomTrawlSurvey(IBTS)

exceedingalengthof40cm.CurrentvaluesoftheLFIare∼0.15,buttheEuropeanUnion(EU)Marine

StrategyFrameworkDirective(MSFD)requiresavalueof0.3bereachedby2020.AnLFIcalculatedfrom

aneight-speciessubsetcorrelatedcloselywiththefullcommunityLFI,therebypermittinganexploration

oftheeffectsofvariousfishingscenariosonprojectedvaluesoftheLFIusinganextensionofapreviously

publishedmulti-specieslength-structuredmodelthatincludedthesekeyspecies.Themodelreplicated

historicalchangesinbiomassandsizecompositionofindividualspecies,andgeneratedanLFIthatwas

significantlycorrelatedwithobservations.Acommunity-widereductioninfishingmortalityof∼60%

from2008valueswasnecessarytomeettheLFItarget,drivenmainlybychangesincodandsaithe.A70%

reductionincodfishingmortalityalone,ora75%reductioninottertrawleffort,wasalsosufficientto

achievethetarget.Reductionsinfishingmortalitynecessarytoachievemaximumsustainableharvesting

ratesareprojectedtoresultintheLFIover-shootingitstarget.

©2015TheAuthors.PublishedbyElsevierB.V.ThisisanopenaccessarticleundertheCCBYlicense

(http://creativecommons.org/licenses/by/4.0/).

1. Introduction

Manystudiesofexploitedfishcommunitieshavedemonstrated shiftstowardssmallersizedfish,relatedtoincreasedfishing(Daan

etal.,2005;Shinetal.,2005;GreenstreetandRogers,2006;Heath

andSpeirs,2012),whilstanincreaseinthemeansizeoffishinside

marinereservesisoneofthemostfrequentlyobservedresponses following the cessation of fishing (Molloyet al., 2009). Conse-quently,thelargefishindicator(LFI),definedastheproportionby weightofdemersalfish>40cmsampledduringthequarter1 Inter-nationalBottomTrawlSurvey(Q1IBTS)(Greenstreetetal.,2011), hasbeenadoptedasanOSPAREcologicalQualityObjective(EcoQO) fortheNorthSeafishcommunity(HeslenfeldandEnserink,2008) andistheprincipalstatusassessmenttoolforimplementingan ecosystemapproachtofisheriesmanagementinEurope.TheLFI hasalsobeenadoptedasanindicatortosupportimplementation

Abbreviations:LFI,largefishindicator;IBTS,internationalbottomtrawlsurvey; EU,EuropeanUnion;MFSD,marinestrategyframeworkdirective;OSPAR,Oslo-Paris conventionfortheprotectionofthemarineenvironmentoftheNorth-EastAtlantic; EcoQO,ecologicalqualityobjective;PDMM,populationdynamicalmatchingmodel; FCSRM,fishcommunitysize-resolvedmodel;ICES,InternationalCouncilforthe ExplorationoftheSeas;TSB,totalstockbiomass.

∗Correspondingauthor.Tel.:+4401415483813;fax:+4401415483345. E-mailaddress:[email protected](D.C.Speirs).

oftheMarineStrategyFrameworkDirective(MSFD),andis iden-tifiedinthe2010decisiondocumentasanindicatortomonitor changeintheproportionoftoppredatorsinfishcomponentsof marinefoodwebs(EuropeanCommission,2010).Itmayalsofulfil thefunctionofindicator1.7.1,monitoringchangeintherelative abundanceof ecosystemcomponents,inthis instancelargeand smallfish(Modicaetal.,2014).

ThesimplicityoftheLFIbeliescomplexprocessesthatcan influ-enceitsvalue.Asaratioindicator,changestowardslowvaluescan becausedbyincreasedsmallfishabundanceaswellasbythe deple-tionoflargefish(Daan etal.,2005).Predator–preyinteractions mayaffecttheLFI,forexampleanincreaseinsmallfishabundance mightarisefromreleaseofpredationpressure,aslargerpiscivorous fishareremoved(Christensenetal.,2003;MyersandWorm,2003:

Franketal.,2005;Heithausetal.,2008).Inaddition,the

commu-nityoffishcomprisesspeciesofwidelyvaryingmaximumsizes, soshiftsincommunitycompositiontowardsspecieswithlower maximumsize(e.g.inresponsetowarmingtemperatures)could alsocauseLFIvaluestodecline(Shephardetal.,2012;Beareetal.,

2004;Simpsonetal.,2011).So,useoftheLFIinassessing

ecosys-temstatusandachievingparticulargoalsforthestateofthesystem requiresaclearunderstandingofwhathasdrivenchangesinthe LFIinthepastinordertopredictitsresponseinthefuture.

Intheearly1980stheNorthSeaLFIhadavalueof≈0.3,before decliningto<0.1intheearly2000s,followedbysomerecovery

http://dx.doi.org/10.1016/j.ecolmodel.2015.10.032

(2)

insubsequentyears(Fungetal.,2012;Greenstreetetal.,2012a).

Greenstreet etal. (2011) conducteda statistical analysisof the

NorthSeaLFItimeseriesand,concludedthattherewasa12–18 yearlagintherelationshipbetweenchangingdemersalfish har-vestingrates and theindicatorresponse.Subsequentstudies in differentmarineregionshavedemonstratedsimilarlagged rela-tionshipsbetweenfishingmortalityandtheLFI(Shephardetal., 2011).Anumber ofsize-structuredmodelsoffishcommunities showtheanticipated inverserelationshipbetweenfishing mor-talityandindicesoffishsize(Halletal.,2006;Popeetal.,2006;

Blanchardetal.,2009;Rochetetal.,2011;Blanchardetal.,2014;

Thorpeetal.,2015).

In understanding how the LFI has responded to historical changesinfishingpressure,andhowitmightrespondtofuture managementdecisions,size-structuredmodelsareclearly impor-tanttools.However,thecomplexityofthefactorsaffectingtheLFI, includingmultispeciespredator–preyinteractions,hasmeantthat attemptsatmodellingithavethusfarbeenfairlyfew.Shephard

etal. (2012) studiedchanges in theLFI in theCeltic Seausing

twodifferentmodellingapproaches.The firstwasbased onthe Population-Dynamical Matching Model developed by Rossberg

etal.(2008),whichusesaquasi-evolutionaryprocessand

allomet-ricscalingstogeneratesize-structuredcommunitiesofcomposed ofspeciesof varyingbodysize.The secondusedtheFish Com-munitySize-Resolved Model(FCSRM)ofmodel ofHartvigetal.

(2011)thatinvolvescoupledsize-spectratorepresentthesize

dis-tributionsofgroupsofspecieswithsimilarmaturationsizes.The modelsarecontrastinginthatthePDMMproduceschangesinthe LFIonlythrough shiftsinrelative speciesabundance, whilethe FCSRMcandosoasaresultofchangesinthepopulationlength dis-tributionsofgroupsofspecies.Itwasconcludedthatthechanges intheCelticSeaLFIarosemainlythroughchangesinspecies abun-dance.Fungetal.(2013)alsousedthePDMMmodelconfigured fortheNortheastAtlanticandpredictedmulti-decadalrecovery timesinresponse toreductionsincommunity fishingpressure. Mostrecently,Blanchardetal.(2014)usedavariantoftheFCSRM whereindividualsize-spectrarepresented12individualNorthSea speciesratherthanspeciesgroupsandfound,bycontrast,thata rapidrecoveryintheLFIcouldoccurwhenthefishingmortality onthevariousspecieswasmovedtomaximumsustainableyield (MSY)levels.

Here,weapplyanalternativediscrete-timemultispecies length-structuredmodelfortheNorthSeafishcommunitydevelopedby

Speirsetal.(2010)tomodeltheobservedchangesintheLFI,and

thenuseittoexplorewhatmayhappeninthefutureunder alter-nativescenariosoffishingfleetactivityandrecruitmentpatternsof keyspecies.Oneofthefeaturesofthemodelisthatpredator–prey interactions are specified in terms of body length ratios appli-cableacrossallspecies,thereby reducingtheneedfor complex dietaryparameterisation.Themodelalsoincludesthekey com-merciallyexploitedpelagicandinvertebratespeciesintheNorth Sea,enablingthetrade-offsrequiredtorestorethedemersalLFI toa givenstatetobeexplored.AswithBlanchardetal.(2014)

individualspeciesareexplicitlyrepresented,buttheSpeirsetal.

(2010)modeldifferssubstantiallyinnumericalimplementationas

wellasanumberofotherkeyrespects,includingthatwemodel individuallengthratherthanweight,andthatwerepresent repro-ductionasspecies-specificseasonalfunctionofthespawningstock ratherthanhavingrecruitmentasanannualexternaldriver.Since boththerevisedCommonFisheriesPolicyandtheMSFDrequire fisheriestooperateatMSY,weaddressthequestionofwhether achievingthisissufficienttoreachtheLFItargetsforNorthSeafish. Incontrasttoearliermodellingwork,wealsoconsidertheextentto whichtheLFItargetmightbeachievedbychangesineffortof dif-ferentfishingfleetsratherthanchangingoverallfishingmortality, orspecies-specificmortalities.

2. Methods

2.1. Thedata

TheNorthSeaFirstQuarter (Q1)InternationalBottomTrawl Survey(IBTS)isanannualsurveywithwidespatialcoverage.Fish caughtareidentifiedtospecies,andnumbersatlength,aswellas ageandsexualmaturitydatafromsubsamplesofselectedspecies, arerecorded(ICES,2010).Thedataarepubliclyavailablefromthe ICESDATRASdatabaseportal(http://datras.ices.dk).Individualfish weightsareobtainedfromstandardcubic-powerweight-at-length relationships(Greenstreetetal.,2012b),whichwhenappliedtothe surveydataallowedthecalculationoftheLFI.

2.2. Themodel

WeusedtheSpeirsetal.(2010)discrete-timelength-structured

modeloftheNorthSeafishcommunity.Themodeldescribesafood webcomposedofasetofkeypredatorandpreyspeciestogether withasmallnumberofmorecrudelyrepresentedalternativefood sources.Fortheexplicitlyrepresentedspeciesthenumber,ni,j,t,of

individualsofspeciesiinlengthclassjattimetisupdatedover timesteptaccordingto

ni,j,t+t=

(1−pi)i,j,tni,j,t+hi,t j=0

(1−pi)i,j,tni,j,t+pii,j−1,tni,j−1,t j>1

where 0<pi<1is a constant fractionofindividuals progressing

fromonelengthclasstothenextovertheintervaltt+t,and

i,j,tandhi,tare,respectively,thecorrespondingsurvivorshipand

hatchlings tothefirstlengthclass. Thelength ofindividuals of lengthclassjisgivenby

Li,j=L∞,i−

L,i−L0,i

exp (−j×qi)

whereL0,iisthelengthofthesmallestlengthclass,L∞,iisthe

asymp-toticlengthofspeciesi,andqiisaconstant.Inordertomodel

growthuptoamaximumlengthLmax,i(necessarilylessthanL∞,i)

usingjmax,ilengthclassesweset

qi=−ln

L,i−Lmax,i

L,i−L0,i

/jmax,i

AsshowninSpeirsetal.(2010),inourmodelthemeanlength, ˆ

Li,t,ofacohortofindividualswithlengthL0,iatt=0willincrease

withgrowthrateiaccordingtoavonBertalanffyfunction

ˆ

Li,t=L,i

L,iL0,i

e−it

providedthatpi=it/qiandpi∈(0,1).So,iftheparameters

L0,i,L∞,i,andiareknownfromobservationswecanchoseany

jmax,i(andhenceqi)andtthatsatisfytheserequirementsand

gettherequiredvonBertalanffygrowth.Althoughthechoicedoes notimpactonthemeancohortlength,itdoescontrolthevariability aroundthatmean.Increasingqiordecreasingtwillhavethe

effectofincreasingthevariabilityinlengthofacohort.Biomass featuresinthecalculationofthesurvivalandrecruitmentterms, describedbelow,soweassumethatweightandlengtharerelated bywi,j=aiLbi

j ,withaiandbiconstants.

Therecruitmentterm,hi,t,isthenumberofeggshatchedfroma

distincteggclass,ne,i,t.Weassumethattheproportionofsexually

matureindividualsproducingeggsincreaseswithlengthaccording toacumulativenormaldistribution.So,theproportionofmature adults,mi,j,inlengthclassjisgivenby

mi,j=

(Li,j−Lm,i)/sm,i

(3)

where(•) isthecumulativedistributionfunctionofthestandard normaldistribution,andthemeanandstandarddeviationoflength atmaturityareLm,iandsm,i,respectively.Overtheintervalt→t

therate,εi,t,atwhicheggsareproducedandenteraneggclass,

dependsonthetotalmaturebiomassandthetimeofyear.If spawn-ingoccursbetweendays-of-the-yeard0,iandd1,i,thenmeasuring

timeindaysanddefiningtheday-of-the-yearina365-dayyearat timetasd=t−trunc

t/365

×365,weget

εi,t=

i

2

d1,id0,i

j

max,i

j=0

mi,jni,j,twi,j if d0,i<d<d1,i

0 otherwise

whereiistheannualnumberofeggsproducedperunitfemale

bodymass,andthefactorof1/2assumesanequalsexratio.Ifthe averageeggdevelopmenttimeis e,iandeggssufferapercapita

backgroundmortalitye,i,andaconstantlossratefrompredation

Ue,i,t/t,thentheupdaterulefortheeggclassandhatchlingsare

respectively

ne,i,t+t=

εi,t−Ue,i,t/t

i +

ne,i,t−

εi,t−Ue,i,t/t

i

e−it

hi,t+t=

p 2 i,t

ne,i,t+

ne,i,t−i,t

(1−e−i,tt)

wherei=e,i+1/ e,i.Thetimestepuptakeofeggsdueto

preda-tion,Ue,i,t,iscalculated inthesamewayasthepredationonall

populationlengthclasses,asdescribedbelow.Sincethisdepends onlength,weassumethelengthofaneggisapproximatedbythe equivalentsphericaldiameterofahatchlingofmasswi,0=aiLb0i,i

assumingneutralbuoyancy.

Thesurvivorshipofthepopulationlengthclasses,i,j,t,canbe

furtherbrokendown

i,j,t=i,j,tp × b i,j,t×

F i,j,t

wherei,j,tp isthesurvivorshipfrompredationbymodelledspecies,

b

i,j,tisthesurvivorshipfromadditionalbiomass-dependent

mor-tality,and F

i,j,t thesurvivorshipfromfishing.Survivorshipfrom

fishingissimplye−Fi,j,tt whereFi,j,t isthefishingmortalityrate perunit time onlengthclass jofspecies iattime t.The catch overeachtimestepofagivenspeciesandlengthclassistherefore

1−F i,j,t

ni,j,t.Sincenotallthecatcharenecessarilyretained,

wealsodefineaneffectiveminimumlandingsizeLl,i,suchthatthe

landedcatch,orlandings,isthetotalcatchforspeciesiof individ-ualsoflengthLl,iorabove.

Thebiomass-dependentsurvivorshiptakesthesameformfor allindividuals,butwedistinguishsmallindividuals(fordemersal fishthesearetheplanktonicindividualsbeforesettlement)from largerones.IfthistransitionoccursatlengthLs,iwehave

bi,j,t=

e−(p,i+ıp,iWp,i,t)t L i,j<Ls,i

e−(s,i+ıs,iWs,i,t)t otherwise

whereWp,i,t= j

s,i−1

j=1

wini,tandWs,i,t= jmax

j=js,i

wini,taretherespective

biomassesofsmallandlargeindividuals,withjs,ithefirstlength

classwhereLj≥Ls,i.

Inordertocalculatei,j,tp webeginbynotingthatallsurviving individualsmusthavemettheirmetabolic,growth,and reproduc-tivecosts.Thismeansthat,if˛iistheassimilationefficiency,the

biomassoffood(inbiomassunits)consumedover t→t+tfor eachlengthclassis

Ci,j,t=

i,j,tni,j,t

Mi,j+piGi,j+Ri,j,t

˛i

.

where Mi,j,piGi,j,andRi,j,t arethepercapitametabolic,growth,

andreproductivecostsinbiomassunits.Themetaboliccostsare proportionaltobodymass

Mi,j=iwi,jt,

thegrowthcostisthedifferenceinweight

Gi,j=wi,j+1−wi,j

andappliestothefraction,pi,ofindividualsgrowingfromoneclass

tothenext.Thereproductivecostistheweightofeggsproduced overthetimestepistherefore

Ri,j,t=

si,timiwi,0t

2 .

Thefractionofthetotalfoodconsumptionbypredatorclass

i,j

thatcomesfrompreyclass

i,j

istheweightedproportion ofthetotalpreybiomass

␲i,j,i,j,t=

i,j,i,j ni,j,t wi,j

all i

all j i,j,i,j ni,j,t wi,j

wheretheweighting, i,j,i,j,isthepreferenceof

i,j

for

i,j

anddescribedbelow.Thisimpliesthatthetotalconsumption(in unitsofdensity,gm–2)onpreyclass

i,j

byallpredatorsis

Ui,j,t=

all i

all j

Ci,j,t␲i,j,i,j,t

andhencethatthefractionsurvivingpredationis

ip,j,t=1−wUi,j,t ijni,j,t

Notethattheaboveequationdependsonthesurvivorshipof thepredators,whichmeansthatweneedtodefineaprocessing order.Wemakethesimplificationthatonlysurvivingindividuals gettofeed,andsinceinoursystempredatorsarealwayslargerthan theirpreywecanorderthecalculationofthepredationmortality ratesaccordingly.Sothelargestlengthclasscanneverbeeatenby anyotherclass,butcanpredatesmallerclasses.Havingcalculated thecontributiontothepredationofallofitsprey,thenext-largest lengthclassdown(whichmaybeadifferentspecies)canbedealt withsinceitsmortalityrateisnowknown,andsoonindescending orderoflength.

Weassumethatthepreferencearisesfromaspecies-dependent termzi,i,whichiszeroifapreyspeciesisnoteatenandlargewhen

apreyspeciesishighlypreferred,andafunction,f

l/Li,j

,ofthe prey/predatorlengthratio

i,j,i,j =

zi,i

li,j +1

li,j

f

l/Li,j

dl

all i

all jzi,i

li,j +1

li,jf

l/l i,j

dl .

Thefunctionf

l/Li,j

peaksatapreferredprey/predatorlength ratioRopt,i,andiszerooutsidearangeofratiosfromRmin,itoRmax,i

f

l/Li,j

=

g

l/Li,j

˛i−1

1−g

l/Li,j

ˇi−1

Rmin,i<l/Li,j<Rmax,i

(4)

where

g

l/Li,j

= l/Li,j−Rmin,i

Rmax,i−Rmin,i

˛i =1+

ˇi−1

Ropt,i−Rmin,i

Rmax,i−Rmin,i

Theparameterˇi setshowtightlythepreference functionis

distributedaboutRopt,i.

Forthreepreytypesnotexplicitly representedona species-by-speciesbasis(zooplankton,benthos,and‘otherfish’)wemodel thesebysimplebiomassspectrapartitionedintolengthclassesof equalwidthonalogarithmicscale.Thelengthofthelower bound-aryofclassjofpreytypeiis

Li,j=L0,i

Lmax,i

L0,i

(i/jmax,i)

whereL0,i andLmax,iarethesmallestandlargestlengths

repre-sentedfortypei,andjmax,iisthenumberoflengthclassesused

torepresentthebiomassspectrum.Weassumethatforeachprey class

i,j

thebiomass,Bi,j,t,followssimplechemostatdynamics

Bi,j,t+t=

Ki−

Ui,j,t

Pit

(1−e−Pi,j=t)+B

i,j,te−Pi,j=t

where Ki is thesteady state biomass without predation, Pi,j is

theproductiontobiomassratio,andUi,j,t/tisrateatwhichthe

preylengthclassis beingconsumedby theexplicitlymodelled predators.Givenan estimateof atotal unexploitedbiomass,Ti,

togetherwiththestandardresultofbiomassspectrumtheoryof equalbiomassinlogarithmiclengthclasses,wesetKi=Ti/jmax,i.As

withtheexplicitlymodelledspecies,eachlengthclasshasan asso-ciatedcharacteristicmassforindividualorganismsinthatlength class,wi,j=aiLi,jbi,andtheproductiontobiomassratioscales

loga-rithmicallywithbodymass log10

Pi,j

=k1,ilog10

wi,j

+k2,i.

The model was configured for eight demersal species that accountedfor >90%ofthetotal demersalbiomass intheNorth Sea(cod,haddock,whiting,saithe,Norwaypout,plaice,common dab,andgreygurnard),plustwopelagicspecies(herring,sandeel) andNephropsnorvegicus(henceforthNephrops).Theadditionalfood resourcesnotmodelledatthespecieslevelwerezooplankton, ben-thos,and‘otherfish’.Outputsfromthemodelweretimeseriesof totalspeciesbiomass(TSB),normalisedlengthdistributions(the sumofeachspeciesdistributionequalsone)atannualcensusdates, annualrecruitment,catchandlandings,foreachspecies.By apply-inglogisticsurveycatchability-at-lengthfunctionstotheTSBand lengthdistributions,wederivedamodelestimateoftheLFI(from theeightdemersalspecies).Asummaryoftheparametersusedto modelthelength-structuredspeciesisprovidedinTable1,while

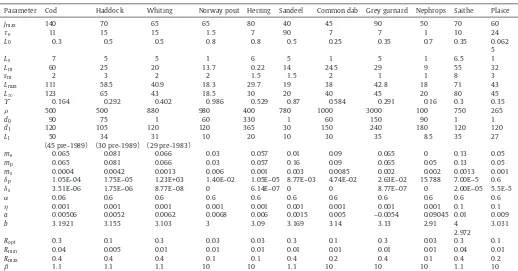
Table2containsthecorrespondingparametervaluesforeachofthe

11explicitly-modelledspecies.Table3givesthesize-independent preference weightings used in calculating distributing thefood uptakebypredatorsamong possibleprey.Finally, Table4 gives theparametersusedtomodelthevariousbiomassspectraused torepresentalternativefoodresources.

2.3. Baselinerun

We first carried out a baseline model run for the period 1960–2008.FishingmortalitiesreportedbyICESwereusedwhere possible(ICES,2009aforherring, andICES,2009bforcod, had-dock, whiting, saithe, Norway poutand sandeel). These fishing mortalitiesarereportedasmortality-at-age,andwereconvertedto

Table1

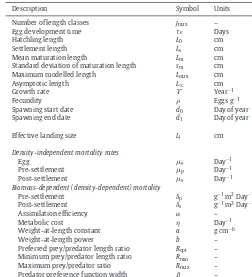
Briefdescriptions,symbols,andunits,fortheparametersusedtomodelthe explic-itlyrepresentedspecies.SeeTable2fortheparametervaluesusedforeachspecies.

Description Symbol Units

Numberoflengthclasses jmax –

Eggdevelopmenttime e Days

Hatchlinglength L0 cm

Settlementlength Ls cm

Meanmaturationlength Lm cm

Standarddeviationofmaturationlength sm cm

Maximummodelledlength Lmax cm

Asymptoticlength L∞ cm

Growthrate Year−1

Fecundity Eggsg−1

Spawningstartdate d0 Dayofyear

Spawningenddate d1 Dayofyear

Effectivelandingsize Ll cm

Density-independentmortalityrates

Egg e Day−1

Pre-settlement p Day−1

Post-settlement s Day−1

Biomass-dependent(density-dependent)mortality

Pre-settlement ıp g−1m2Day−1

Post-settlement ıs g−1m2Day−1

Assimilationefficiency ˛ –

Metaboliccost Day−1

Weight-at-lengthconstant a gcm−b

Weight-at-lengthpower b –

Preferredprey/predatorlengthratio Ropt – Minimumprey/predatorlengthratio Rmin –

Maximumprey/predatorratio Rmax –

Predatorpreferencefunctionwidth ˇ –

mortalities-at-lengthbyinvertingthevonBertalanffyage–length relationshipforeachspeciesinordertoobtainanapproximateage,

ai,j,oflengthclassLi,j

ai,j=trunc

–ln

L,i−Li,j L,iL0,i

whichallowsustouseICESstockassessmentsforThisallowsusto useWecanthusgetalength-dependentFfromtheage-classF’s

Fj,t≈Faj,t

andsothesurvivalfromfishingis

F

j,t=e−Fj,tt/365

wherethedivisionby365isnecessaryiftisindays,andtheF’s areannualrates.Stockassessmentsstartedindifferentyearsfor thevariousspecies,soforyearsinourmodelrunpre-datingthe startofassessmentwegeneratedapproximatefishingmortalities byestimatingalinearscalingbetweenfishingmortalityandofficial recordedlandings(http://www.ices.dk/marine-data/)and assum-ingthatthelength-dependenceofthefishingmortalitywasthe sameasthatofthefirstassessedyear.Thisisclearlyrestrictive,but isatolerableassumptionwheneitherthestocklightlyexploited, orwhenlandingsarerelativelyconstant, andonlyaffects years priortotheLFIperiod.For theremainingfishspecies(common daband greygurnard)we approximatedthefishingmortalities fromtheharvestratio,i.e.theratiooflandingstototalbiomass estimatedfromtheIBTS,witha length-dependencetakenfrom the(single year) estimateoffishingmortality forthose species (Popeetal.,2000).WeestimatedNephropsfishingmortalityusing thelandingsandastockbiomassestimateobtainedbyscalingup fromburrowdensitiesobtainedfromunderwatertelevision

sur-veys(Speirsetal.,2010).From2002onwards,larvalsurvivorship

ofbothherringandsandeelswaslowerthanexpected(ICES,2009a,

2009b),probablyasaresultofchangingenvironmentalconditions

[image:4.646.39.193.68.121.2] [image:4.646.300.552.82.359.2]
(5)

Table2

Species-specificparametervaluesfortheexplicitlyrepresentedspecies.SeeTable1forparameterdefinitionsandunits.

Parameter Cod Haddock Whiting Norwaypout Herring Sandeel Commondab Greygurnard Nephrops Saithe Plaice

jmax 140 70 65 65 80 40 45 90 50 70 60

e 11 15 15 1.5 7 90 7 7 1 10 24

L0 0.3 0.5 0.5 0.8 0.8 0.5 0.25 0.35 0.7 0.35 0.062

5

Ls 7 5 5 1 6 5 1 5 1 6.5 1

Lm 60 25 20 13.7 0.22 14 24.5 29 9 55 32

sm 2 3 2 2 1.5 1.5 2 1 1 8 3

Lmax 111 58.5 40.9 18.3 29.7 19 38 42.8 18 71 43

L∞ 123 65 43 18.5 30 20 40 45 20 80 45

0.164 0.292 0.402 0.986 0.529 0.87 0.584 0.291 0.16 0.3 0.35

500 500 880 980 400 780 1000 3000 100 750 265

d0 90 75 1 60 330 1 60 150 90 1 1

d1 120 105 120 120 365 30 150 240 180 120 120

Ll 50 34 31 10 20 10 30 35 8.5 35 27

(45pre-1989) (30pre-1989) (29pre-1983)

me 0.065 0.081 0.066 0.03 0.057 0.01 0.09 0.065 0 0.13 0.05

mp 0.065 0.081 0.066 0.03 0.057 0.16 0.09 0.065 0.05 0.13 0.05

ms 0.0004 0.0042 0.0013 0.006 0.001 0.003 0.0085 0.002 0.002 0.0013 0.001

ıp 1.05E–04 1.75E–05 1.23E+03 1.40E–02 1.05E–05 8.77E–03 4.74E–02 2.63E–02 15.788 7.00E–5 0.6

ıs 3.51E–06 1.75E–06 8.77E–08 0 6.14E–07 0 0 8.77E–07 0 2.00E–05 5.5E–5

˛ 0.06 0.6 0.6 0.6 0.6 0.6 0.6 0.6 0.6 0.6 0.6

0.001 0.001 0.001 0.001 0.001 0.001 0.001 0.001 0.001 0.1 0.1

a 0.00506 0.0052 0.0062 0.0068 0.006 0.0015 0.005 –0.0054 0.09045 0.01 0.009

b 3.1921 3.155 3.103 3 3.09 3.169 3.14 3.13 2.91 4

2.972

3.031

Ropt 0.3 0.1 0.3 0.03 0.03 0.3 0.1 0.3 0.03 0.3 0.1

Rmin 0.04 0.005 0.01 0.01 0.01 0.01 0.01 0.01 0.01 0.04 0.01

Rmax 0.4 0.4 0.4 0.1 0.1 0.4 0.2 0.4 0.1 0.4 0.2

ˇ 1.1 1.1 1.1 10 10 1.1 10 10 10 1.1 10

Table3

Length-independentdietpreferenceweightingsofpost-settlement(i.e.size-classesgreaterthanthesettlementlength,Ls,inTable1)predatorsusedinthemodelruns. Pre-settlementpredatorsallfeedexclusivelyonzooplankton.Whereherringisthepredator,thepreferencesapplysolelytothepelagiceggs,larvaeandpre-settlement stagesofthepreyspecieshaveapreferenceofzero).Theentriesmarked‘–’indicateavalueofzero.

Predator

Cod Haddock Whiting Norwaypout Herring Sandeel Commondab Greygurnard Nephrops Saithe Plaice

Prey

Cod 0.199 – 0.079 – 0.317 – – 0.129 – – –

Haddock 0.133 – 0.079 – 0.040 – – 0.183 – 0.222 –

Whiting 0.199 – 0.394 – 0.040 – – 0.322 – – –

Norway pout

0.066 0.533 0.039 – 0.323 – – 0.045 – 0.112 –

Herring 0.007 0.133 0.394 – 0.040 – – – – 0.222 –

Sandeel 0.013 0.133 0.008 – 0.040 – – 0.065 – 0.222 –

Common dab

0.033 – – – 0.040 – – 0.065 – – –

Grey Gurnard

– – – – 0.040 – – – – – –

Nephrops 0.199 – – – – – – – – – –

Saithe – – – – 0.040 – – 0.013 – – –

Plaice – – – – 0.040 – – – – – –

Otherfish 0.017 0.133 0.008 – – – – 0.032 – 0.222 –

Zooplankton – – – 1.00 0.040 1.000 – – – – –

Benthos 0.133 0.067 0.008 – – – 1.000 0.146 1.00 – 1.00

density-independentmortalityrateswereincreasedby20%forthe post-2002period(Speirsetal.,2010).Initialrunsdidnotreplicate the high LFI values observed at the start (1983–1986) of the timeseriesbecauseofexceptionallyhighrecruitment(the‘gadoid

outburst’)associatedwithcoolerwatertemperatures(Olsenetal., 2011).Wethereforereducedthedensityindependentcodlarval mortalityrateby25%overtheperiod1973–1983toaccountfor this.

Table4

Parametersforthe‘unstructured’foodresources.

Description Symbol Units Zooplankton Benthos Otherfish

No.lengthclasses jmax – 100 100 100

Min.lengthclass Lmin cm 0.01 0.1 1

Max.lengthclass Lmax cm 2 5 40

Weight-at-lengthconst. a gcmb 0.5917 0.5917 0.0015

Weight-at-lengthpower b – 3 3 3

Totalbiomass T gm−2 15 70 20

Log10(P)vs.log10(w)slope k1 log10(d−1) –0.233 –0.233 –0.233

[image:5.646.45.563.72.343.2] [image:5.646.45.564.389.575.2] [image:5.646.42.561.656.743.2]
(6)

Table5

Proportionsofthetotalfishingmortalityforeachspeciesattributedtoeachofsixmétiers.Thesewereusedinthemodelrunsinwhichthefishingeffortinthevariousmétiers werechangedindividually.

Species Beam

trawl

Demersalotter trawl

Nephrops trawl

Seine trawl

Industrial fishery

Herring trawl

Commondab 0.96 0.03 0.01 0.01 0 0

Nephrops 0 0.16 0.84 0 0 0

Greygurnard 0.05 0.52 0.09 0.14 0.2 0

Sandeel 0 0 0 0 1 0

Herring 0 0 0 0 0 1

Norwaypout 0 0 0 0 1 0

Plaice 0.79 0.14 0.05 0.02 0 0

Whiting 0.05 0.52 0.09 0.14 0.02 0

Haddock 0 0.67 0.03 0.23 0.07 0

Cod 0.1 0.67 0.11 0.12 0 0

Saithe 0 0.99 0 0.01 0 0

2.4. Forwardruns

Scenarioswereconfiguredtoexploretheeffectsofvariations infishingmortalityonindividualspecies,inmétiersorgroupsof speciesexploited bythe samefishery, and of fishingaccording tomaximumsustainableyieldtargets.Ineachcase,amodelrun to2008 was extended to 2020under a scenarioset of fishing mortalities.

First,wevariedfishingmortalitybyvariousproportionsofthe 2008referenceyear:acessationoffishing(0F2008),a50%reduction

(0.5F2008),acontinuationatthe2008level(F2008),a50%increase

infishing(1.5F2008),andadoublingoffishingmortality(2F2008).

Thesescenarioswereappliedtoallspeciessimultaneously,andto eachoneofthe11explicitlymodelledspeciesindividuallywhilst maintainingfishingmortalityfortheremaining10speciesatF2008.

Inmulti-speciesfisheriesitisdifficulttomanagefishingona purelyspecies-by-speciesbasisbecausedifferentfleets,ormétiers, catchmanyspecies(Ulrichetal.,2012).Toexplorethiswe clas-sifiedfishingeffortintosixmétiers:beamtrawl,demersalotter trawl, Nephrops ottertrawl, seine trawl, herring trawl, and the industrialfishery for sandeel,and apportioned thetotal fishing mortalityoneach speciestotheseonthebasis oflandingsand by-catch.Landingsof cod,haddockwhiting, saithe, plaice,sole, andNephropsfromtheNorth Seafortheperiod1997–2004are knownforbeamtrawl,demersalottertrawl,Nephropsottertrawl, andseinetrawl(Greenstreetetal.,2007).Stockassessments(ICES,

2009b)providetheby-catchofhaddockandwhitinginthe

indus-trialfishery.Forherringweassumed thattheallofthecatchis attributabletoherringtrawls,andthattheby-catchofnon-target speciesbyherringtrawlsisnegligible.Fordabandgreygurnard, weassumethattheproportionsattributabletoeachmétierwere approximatedbythoseofsoleandwhiting,respectively.The val-uesobtained(Table5)allowedustoexploretheeffectsofchanging thefishingeffortassociatedwitheachmétier.Inparticular,ifpthe proportionofthatmortalityattributabletoagivenmétier,a dou-blingoftheeffortforthatmétierwouldproduceafishingmortality of[2p+(1–p)]F2008.

Wenextcarriedoutrunstoexaminetheeffectoffishingatlevels estimatedtoproducemaximumsustainableyield(FMSY).Several

ofthespecieshavepublishedFMSY’s;cod0.19,haddock0.3,saithe

0.22,plaice0.25,andherring0.25(ICES,2012).Forwhitingweused theEU-Norwaymanagementplantargetof0.3.Forcommondab andgreygurnard,whicharemainlyby-catch,weassumeda15% reductioninfishingmortalityasanapproximationtothelevelthat mightresultincidentallyfromtargetedreductionsonotherspecies. TheFMSY’swereappliedtothespeciessimultaneously,andalsoto

eachspeciesindividually.

Giventhecriticaleffectof codrecruitmentontheLFI inthe baselinemodelrun,sixfurtherrunswereperformedtosimulate threefisheries management scenariosand two codrecruitment situations.Weconsideredacontinuationofcurrentrecruitment

levelsusingthemodeldefaultparametersandasituationwhere coddensity-independentmortalityisreducedby25%tomimichigh recruitmenttypicalofthe‘gadoidoutburst’period(Cushing,1984;

Olsenetal.,2011).Thethreefisheriesmanagementscenarioswere:

continuationoffishingatF2008forallspecies;fishingatFMSYforall

species,andacompletecessationoffishing.

Finally,wecarriedoutaseriesofrunstodeterminemore pre-ciselythemagnitudeofchangesinfishingmortalitiesrequiredfor themodeltoachievetheLFIEcoQOby2020,andtheimpactof theseoncodyield.Threemanagementscenarioswereexamined: firstly,changingfishingmortalityonallthemodelspeciesbythe samefactor;secondly,changingfishingmortalityoncodonlywhile maintainingmortalityatF2008oralltheotherspecies;andthirdly

changingfishingeffortduetoottertrawlscodonlywhile maintain-ingeffortoftheothermétiersat2008levels.

3. Results

3.1. RelationshipbetweenthecommunityLFIandthe eight-speciesLFI

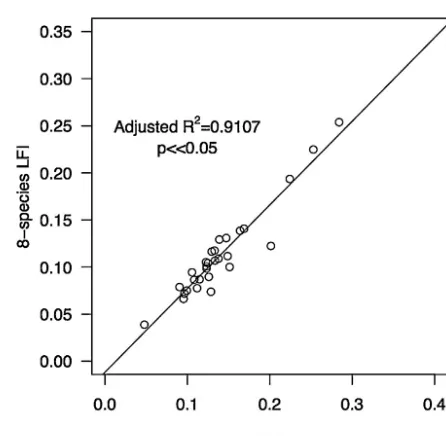
Theempirical eight-speciessubsetLFI washighly correlated withtheLFIdeterminedforthewholedemersalfishcommunity (Fig.1).Thereforeamodelofthelength-compositionofthesekey

[image:6.646.35.554.84.206.2] [image:6.646.316.539.485.703.2]
(7)

demersalspeciesshouldbesufficienttocapturethetemporal sig-nalinthefullcommunityLFI.Thelinearregressionindicatedthat theEcoQOLFItargetof0.3isequivalenttoavalueof0.26forthe eight-speciesLFI(Fig.1.),soweadoptedanLFImanagementtarget of0.26forthemodel.

3.2. Baselinerun

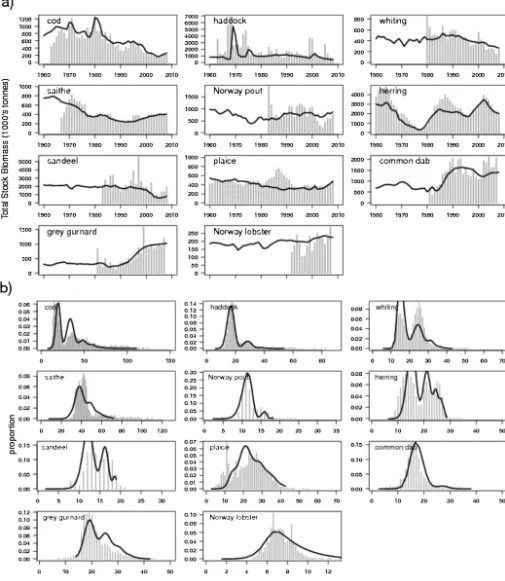
Following the temporal adjustments to pelagic mortality described in the methods, themodel captured thespecies TSB trends(Fig.2a)andlengthcompositions(Fig.2b).Themodelled

[image:7.646.52.557.127.708.2]
(8)

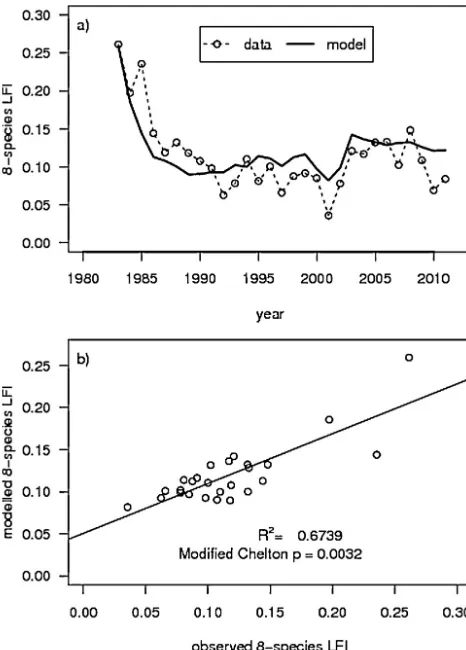
Fig.3. Relationshipbetweenthemodelledandobservedeight-speciesLFIa)time seriesb)linearregressionwiththep-valueandcorrelationcoefficientadjustedfor time-seriesautocorrelationusingthemodifiedCheltonmethod.

LFIalsocloselymatchedobservedvariationsintheempiricalNorth SeaLFI(Fig.3a).Evenwithasuitablereductioninthedegreesof freedomtoaccount fortemporal autocorrelation (the ‘modified Chelton’method,Pyperand Peterman, 1998)themodelled and observedLFIswerehighlysignificantlycorrelatedovertheperiod from1983to2008(Fig.3b).

3.3. Forwardruns

Table6summarisesthesimulationresultswherefishing

mortal-ityisvariedacrossallspecies,byspecies,orbymétiers.Adoubling offishingpressureonthewholemodelledcommunityreducesthe LFItojustabove0.04,similartothelowestvaluesactuallyobserved (seeFig.3).Conversely,reducingthecommunityfishingmortality byaround50%producesastrongLFIrecoverytoavaluejustshort ofthe0.26target.Cessationoffishingrestorestheeight-species LFItoavalueof0.34,wellinexcessofthemodelLFItargetand correspondingtoafullLFIofnearly0.4(seeFig.1).

Similarresultsoccurifthefishingpressurechangesareapplied onlytocod whilemaintainingthe2008levelfortheremaining species. Otherthan cod, saithe is theonly species tocause an increaseintheLFIofmorethan10%whenitsfishingmortalityis reducedby50%.Interestingly,raisingfishingmortalityonsome speciescausessmallincreasesintheLFI.Insomeinstances(e.g. dab,Norwaypout), thespeciesaresmall-bodied sothat reduc-ingtheirabundanceraisestheproportionalcontributionoflarge fishtotheLFI.Inotherinstancestheeffectarisesthroughtrophic interactions.Forexample,greygurnardaremajorpredatorsof 0-groupcod(Floeteretal.,2005);reducingtheirabundancedecreases the predation loading on juvenile cod, thereby increasing cod

Table6

LFIprojectionsfor2020underdifferentscenarios.‘Allspecies’meansthatthesame proportionalchangetothefishingmortalityatlengthwasappliedtoeachspecies. Theindividualspecieslabelsmeanthatthechangeinfishingmortalitywasapplied onlytothatspecieswhiletheotherswereheldatthefishingmortalityforthe ref-erenceyear(2008).Forthevariousmétiersthefishingmortalitiesforeachspecies werechangedaccordingtotheproportionofthelandingsofthatspeciesattributed tothemétiers.Forexample,ifhalfthecatchofaspeciescomesfromottertrawls andhalffrombeamtrawls,andthebeamtrawlfishingmortalityisincreasedby 50%,thenthefishingmortalityforthatspecieswouldincreaseby25%.Themodel LFIachievedbymaintaining2008fishingmortalitiesis0.134.

Changeappliedover Nofishing F2008×0.5 F2008×1.5 F2008×2

Allspecies 0.340 0.234 0.066 0.044

Cod 0.323 0.217 0.087 0.084

Ottertrawleffort 0.285 0.205 0.077 0.051

Saithe 0.170 0.150 0.121 0.111

Seinetrawleffort 0.154 0.144 0.124 0.115

Nephropstrawleffort 0.151 0.142 0.126 0.118

Beamtrawleffort 0.148 0.140 0.127 0.121

Haddock 0.146 0.139 0.130 0.126

Whiting 0.151 0.139 0.133 0.134

Plaice 0.136 0.135 0.133 0.132

Industrialfisheryeffort 0.135 0.134 0.133 0.133

Sandeel 0.134 0.134 0.133 0.133

Nephrops 0.134 0.134 0.134 0.134

Norwaypout 0.132 0.133 0.135 0.136

Herringtrawl 0.129 0.132 0.135 0.136

Herring 0.129 0.132 0.135 0.136

Commondab 0.131 0.132 0.136 0.138

Greygurnard 0.127 0.131 0.136 0.139

recruitment.Similarly,herringarepredatorsofcodeggsandlarvae, soreducingherringabundanceincreasescodrecruitment.

Codandsaitheareprimarilylandedbyottertrawlers(Table5), sovaryingthefishingpressureexertedbythismétierhadastrong influenceontheLFI.Reductioninottertrawleffortalonewould appeartobesufficienttoreachtheEcoQOtarget(Table6). Chang-ingtheeffortinthemétiersthatcatchfewornocod(seinetrawl,

Nephropstrawl,beamtrawl,industrialsandeelfishery)have min-imalimpactontheLFI. Changingtheeffortintheherringtrawl métieristhesameaschangingtheherringfishingmortality,i.e.a smallincreaseintheLFIwithincreasingeffort.Overall,ottertrawls aretheonlymétierwherechangesineffortarecapableofachieving thetargetLFIwheneverythingelseisheldconstant.

ReducingfishingmortalitytoFMSY onallspeciesproduced a

modelled2020LFIvaluethatexceededthemodeltargetof0.26

(Table7).Moreover,thetargetwasstillachievedwhenonlycod

isfishedatFMSYwhiletheotherspeciesarefishedatF2008.This

Table7

Percentagereductioninfishingmortalityfromthereferenceyear(2008)requiredto achieveFMSY,andtheresultingmodelledeight-speciesLFIfor2020.Thepercentage

changeinfishingmortalitywhenthechangeisappliedtoallspeciesisthe arith-meticmeanoftheindividualspecies.ForspecieswithoutapublishedFMSY,ortarget

fishingmortalityweassumedeithernochange(Nephrops,sandeelNorwaypout) ora15%reductioninfishingmortalityinordertoreflectareductioninbycatch. Thefinalcolumngivesthepercentagedifferenceinthe2020LFIunderthevarious manipulationscomparedtothatusing2008fishingmortalities.

Species %changein

fishingmortality

2020

eight-speciesLFI

%change inLFI

All –14.5 0.294 120.0

Cod –75.9 0.271 102.5

Saithe –27.4 0.159 18.6

Whiting –36.2 0.137 2.4

Herring 5.9 0.134 0.1

Nephrops 0.0 0.134 0.0

Sandeel 0.0 0.134 0.0

Norwaypout –15.0 0.134 0.0

Plaice 0.0 0.134 0.0

Commondab –15.0 0.133 –0.4

Greygurnard –15.0 0.133 –0.6

[image:8.646.41.274.54.379.2] [image:8.646.302.553.613.743.2]
(9)

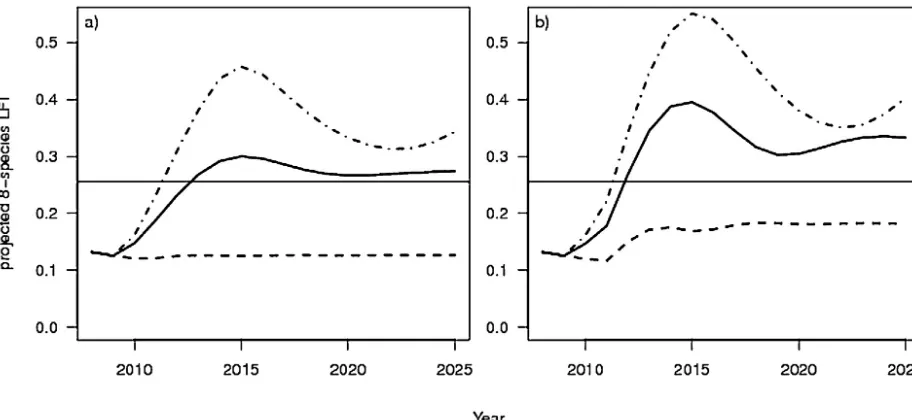
Fig.4.Time-seriesprojectionsofthemodelledeight-speciesLFIundertwocodrecruitmentscenariosa)pre-settlementmodelmortalityparametersunalteredfromthe baseline,andb)a‘gadoidoutburst’withincreasedsurvivalofpre-settlementcod.Eachpanelcontainsthreefishingscenarios–2008fishingmortalities(dashedlines),FMSY (solidlines),andthecessationoffishing(dot-dashedlines).Thehorizontallineindicatestheeight-speciesLFItargetvalue(0.26).

arisesbothbecauseoftheimportanceoflargecodtotheLFI,and becausecod FMSY isverymuchlowerthanF2008(areductionof

75.9%).Saithewasonceagaintheonlyotherspecieswhere adjus-tingtoFMSYproducedanotable(18.6%)increaseintheLFI,albeit

oneinsufficienttoreachtheEcoQO.Whitingfishingmortalityin 2008wasconsiderablyhigherthanitsFMSY,butsincewhitingdo

notcontributegreatlytothebiomassabove40cm,fishingatFMSY

hadlittleimpactonthemodelledLFI.

Conversely,haddockF2008wasalreadysubstantiallylowerthan

estimatedFMSY,soadoptingFMSYforthisspecieshadminimaleffect

ontheLFI.

Figure4showsLFItime-seriesprojectionsunderhighandlow

codrecruitmentscenarios.Whendefaultrecruitmentparameters wereused,and fishingwasatF2008,theprojectedLFIremained

almostconstantatlevelsclosetothoseatthestartoftheprojected period(Fig.4a,dashedline).Attheotherextreme,immediate ces-sationoffishingcausedrapidrecoveryoftheLFIandthe0.26target wasreachedafteronlyfouryears(Fig.4a,dot-dashedline).Fishing atFMSYresultsinaslowerresponse,butthetargetisstillexceeded

aftersevenyears(Fig.4a,solidline).Enhancedcod recruitment producedhigherbutqualitativelysimilarLFItrendsunderthese threefishingscenarios(Fig.4b),buttheLFItargetwasstillnotmet whenF2008wasmaintained(Fig.4b,dashedline).Evenwerecod

recruitmenttoimprovemarkedlyinthenearfuture,our simula-tionssuggestthatitwouldstillnotbepossibletocontinuefishing at2008levelsandhopetomeettheLFIEcoQO.

Fig.5shows2020modelledLFIandcodyieldasfishingmortality orottertrawleffortisvariedcontinuously.Asfishingmortalityon

[image:9.646.77.533.54.264.2] [image:9.646.75.533.481.703.2]
(10)

codaloneincreasestheLFIdeclinesmonotonically(Fig.5a,solid line).Atacodfishingmortalityof50%overF2008thecodstockis

unabletopersistandtheLFIresponselevelsoff(Fig.5a,solidline) andyieldfallstowardszero(Fig.5b,solidline).A70%reduction ofcodfishingmortalityfromF2008issufficienttoachievethe0.26

target(Fig.5a,solidline),avaluethatislessthanthe76%reduction requiredtoreachFMSY.Whenfishingmortalitychangesareapplied

toallthespeciestheLFIresponseissimilar,butonlya60%reduction isneededtoreachthetarget(Fig.5a,dashedline).Bycontrast,ifthe fishingmortalityismanagedonlythroughtheottertrawlmétiera greaterreduction(75%)isneededtoachievethesameresult(Fig.5a, dot-dashedline).

Inallcasesreducingfishingmortalitysufficientlytomeetthe EcoQOtargetresultedincodyieldsbetween25%and60%higher thanthoseobtainediffishingmortalitywasmaintainedatF2008

(Fig.5b).Codlandingsweremaximisedbyareductionin mortal-ityoncodaloneofapproximately40%(Fig.5b,solidline)withan annualyieldofjustunder150kilotonnes.However,when mortal-itywasreducedonallspecies,notonlywasthereductionrequired toachievetheEcoQOless,butprojectedyieldwasabout10%higher (Fig.5b,dashedline).Whenottertrawleffortisreducedsufficiently tomeettheEcoQO,codyieldisclosetoitsmaximumvalueandis over20kilotonneshigherthanthatobtainedwhenthetargetismet bychangingfishingmortalityoncodaloneorbychangingfishing mortalityonallofthespeciessimultaneously.

4. Discussion

Ourmodelreplicated long-termtemporal trendsin boththe biomassandsize-compositionoftheexplicitlymodelledspecies, and the resulting derived LFI correlated significantly with the empiricalLFIprovided thatanexternallydrivenincrease inthe earlylifestagesurvivalofcodduringthe1970swasintroduced. Codrecruitmentisknowntohavebeensystematicallyhigher dur-ingthisperiod, associatedwithreducedtemperaturesandhigh zooplankton abundance during the so-called ‘gadoid outburst’

(Cushing,1984;BeaugrandandKirby,2010;Olsenetal.,2011).The

modelcouldthereforebeusedtoexploretheeffectsofdifferent fisheriesmanagementscenarios onfuture LFItrajectories, espe-ciallywiththeinclusionofhighandlowcodrecruitmentscenarios toboundtheprojections.

Ourresultsconfirmthattheeight-speciesLFIprimarilyreflects thefortunesof cod,whichis themajorlargebodiedfishinthe NorthSea.Thelong-termdeclineofmodelledcodabundancefrom the1980stotheearly2000swastheprincipaldriverofthe corre-spondingdeclineintheLFI.Bytheendofthisperiodcodabundance wassimilartothatofsaithe,whichprovedtobethenextmost influentialspecies.Recentlowcodabundancecoupledwithasmall increaseinsaithebiomassfromthemid-1990swasresponsiblefor thesmallpartialrecoveryintheeight-speciesLFIsincetheearly 2000s.TheseresultsmatchthosefoundinthefullNorthSeaLFI, whichisapproximately66%dependentoncodand33%dependent onsaithe(Greenstreetetal.,2011,2012a).Giventhedominance ofcodinthe>40cmbiomassdistributionthemaindriversofthe LFIarethefishingmortalityrateoncodandthevariationsinits recruitment.Significantly,modelresultsindicatethatevenwithout areturntothehighrecruitmentofthegadoidoutburstperiodthe EcoQOLFIlevelsareattainablewithreductionsinfishing mortal-ityequivalenttothoseestimatedtoachievemaximumsustainable yield.

Themajoritycodandsaithelandingscomefromvesselsusing demersalottertrawls,sotheeffortassociatedwiththismétieris theprincipaldriveroffishingmortalityonthesespeciesandhence amajordeterminantoftheLFI.AlthoughtheLFIwasdeveloped asanindicatorof theimpactof fishingin general(Greenstreet

etal.,2011), ourresultsindicatethatit ismostly a measureof ottertrawlimpactsandthattheEcoQOLFIcanbeattainedsolely throughcontrollingottertrawleffort.Froma management per-spectivethisisimportantbecausecontrollingeffortbymétiersis easierthanattemptingtocontrolfishingmortalitiesona species-by-speciesbasisinamulti-speciesfishery.Moreover,althoughthe reductioninottertrawleffortneededtoachievetheEcoQOexceeds thatrequiredwhenthecommunity-widefishingeffortischanged, itis considerablylessthanwhenonly thecod fishingmortality isreduced.Significantly,projectedcodlandingsaresubstantially higherwhentheEcoQOismetbyreducingottertrawleffortthan whenitisachievedbytheothermeasures.

Ourmodelconsistentlyshowsarapidapproachtothesteady stateunderconstant fishingmortality.Althoughin mostofthe scenarios trueequilibrium LFIvalues werenot achievedwithin 15years,approximatesteadystateswerereachedin10yearsor less.ThisresultisatvariancewiththoseofFungetal.(2013)who, usingthePDMMapproachreferredtointheintroduction,observed multi-decadalrecovery timescales fortheLFI. Twocritical dif-ferencesbetweenthePDMM andourmodelmayunderpinthis differenceinresponsetimescales.First,thePDMMisa commu-nityassemblymodelaimedatgeneratingspecies-richcommunities (29–189species)withoutindividuallyparameterisinglarge num-bersofequationstorepresentingidentifiablebiologicalspecies.It thereforeinvolvesmanymorespeciesandconsequently,as sug-gestedbyFungetal.(2013),trophiccascadestakealongtimeto dampdown.Second,althoughspeciesinthePDMMareassigned abodysize,differentbodysizeswithineachspeciesarenot rep-resented.Thismeansthat thecommunitylengthdistributionis achievedbytherelativeabundancesofspecieswithdifferent nom-inalbodysizes,andsotheonlymechanismpermittingtherecovery oftheLFIafteraperiodofintensefishingisreproductiveincrease inspeciesabundanceongenerationaltime-scales.Bycontrast,our model explicitly representsthelength distributionwithin each species, and hence can produce rapid increase in the LFI as a directconsequenceofindividualgrowthwhenfishingmortality isreduced andagreater proportionofsmallfishalreadyinthe populationgrowtolargersize.

Ourresultssuggestthatrecoveryoftheeight-speciesLFIand hencethefullNorthSeaLFImaybepossiblewithinashorttimescale provided that thereduction onfishing mortality is sufficiently large.Forpragmaticreasonsweused2008asourtransitionpoint betweenthehistoricalandforwardrunsbutfishingmortalityhas declinedformostspeciessince2008(ICES,2013).Althoughthis meansthattheabsoluteyearsinourforwardrunsaredisplaced byfiveyears,thetimescalesoftheLFIresponsesarelargely unaf-fected.By2008fishingmortalityacrosstheNorthSeademersalfish communityhaddroppedbyaround57%fromitspeakin1986.Our analysissuggeststhatfishingmortalityneedsafurtherreduction of60%(whenthereductionisappliedtoallspecies)fromthe2008 valuestopermittheEcoQOLFItobereached,oranapproximate 50%reductionfrom2012values.Thusatotalreductionfrom1986 peakfishinglevelsof83%isrequired.Thisimpliesthatinthe mid-1980s,fishingmortalitywasapproximatelyfivetimesthelevelthat wenowconsiderconsistentwithmaintaininggoodenvironmental statusforthebroaderdemersalfishcommunityoftheNorthSea.

Acknowledgements

(11)

References

Beare,D.J.,Burns,F.,Greig,A.,Jones,E.G.,Peach,K.,Kienzle,M.,McKenzie,E., Reid,D.G.,2004.Long-termincreasesinprevalenceofNorthSeafishes hav-ing southernbiogeographicaffinities. MarineEcology ProgressSeries 284, 269–278.

Beaugrand,G.,Kirby,R.R.,2010.Climate,planktonandcod.GlobalChangeBiology 16,1268–1280.

Blanchard,J.L.,Jennings,S.,Law,R.,Castle,M.D.,McCloghrie,P.,Rochet,M.J.,Benoit, E.,2009.Howdoesabundancescalewithbodysizeincoupledsize-structured foodwebs?JournalofAnimalEcology78,270–280.

Blanchard,J.L.,Andersen,K.H.,Scott,F.,Hintzen,N.T.,Piet,G.,Jennings,S.,2014.

Evaluatingtargetsandtrade-offsamongfisheriesandconservationobjectives usingamultispeciessizespectrum model.Journal ofAppliedEcology51, 612–622.

Christensen,V.,Guénette,S.,Heymans,J.J.,Walters,C.J.,Watson,R.,Zeller,D.,Pauly, D.,2003.Hundred-yeardeclineofNorthAtlanticpredatoryfishes.Fishand Fish-eries4,1–24.

Cushing,D.H.,1984.ThegadoidoutburstintheNorthSea.JournalduConseil Inter-nationalpourl’ExplorationdelaMer41,159–166.

Daan,N.,Gislason,H.,Pope,J.G.,Rice,J.C.,2005.ChangesintheNorthSeafish com-munity:evidenceofindirecteffectsoffishing?ICESJournalofMarineScience 62,177–188.

EuropeanCommission,2.9.2010.CommissionDecisionof1September2010on criteriaandmethodologicalstandardsongoodenvironmentalstatusofmarine waters.OfficialJournaloftheEuropeanUnionL232,14–24.

Floeter,J.,Kempf,A.,Vinther,M.,Schrum,C.,Temming,A.,2005.Greygurnard (Eutriglagurnadus)intheNorthSea:anemergingkeypredator?Canadian Jour-nalofFisheriesandAquaticSciences62,1853–1864.

Frank,K.T.,Petrie,B.D.,Choi,J.S.,Leggett,W.C.,2005.Trophiccascadesinaformerly cod-dominatedecosystem.Science308,1621–1623.

Fung,T.,Farnsworth,K.D.,Reid,D.G.,Rossberg,A.G.,2012.Recentdatasuggestno furtherrecoveryinNorthSeaLargeFishIndicator.ICESJournalofMarineScience 69,235–239.

Fung,T.,Farnsworth,K.D.,Shephard,S.,Reid,D.G.,Rossberg,A.G.,2013.Whythesize structureofmarinecommunitiescanrequiredecadestorecoverfromfishing. MarineecologyProgressSeries484,155.

Greenstreet,S.P.R.,Fraser,H.M.,Rogers,S.I.,Trenkel,V.M.,Simpson,S.D.,Pinnegar, J.K.,2012b.Redundancyinmetricsdescribingthecomposition,structure,and functioningoftheNorthSeademersalfishcommunity.ICESJournalofMarine Science69,8–22.

Greenstreet,S.P.R.,Robinson,L.A.,Piet,G.J.,Craeymeersch,J.,Callaway,R.,Reiss,H., Ehrich,S.,Kröncke,I.,Fraser,H.M.,Lancaster,J.,Jorgensen,L.,Goffin,A.,2007.The EcologicalDisturbanceCausedbyFishingintheNorthSea.FisheriesResearch ServicesCollaborativeReport04/07,169.

Greenstreet,S.P.R.,Rogers,S.I.,2006.IndicatorsofthehealthoftheNorthSeafish community:15identifyingreferencelevelsforanecosystemapproachto man-agement.ICESJournalofMarineScience63,573–593.

Greenstreet,S.P.R.,Rogers,S.I.,Rice,J.C.,Piet,G.J.,Guirey,E.J.,Fraser,H.M.,Fryer,R.J., 2011.DevelopmentoftheEcoQOfortheNorthSeafishcommunity.ICESJournal ofMarineScience68,1–11.

Greenstreet,S.P.R.,Rogers,S.I.,Rice,J.C.,Piet,G.J.,Guirey,E.J.,Fraser,H.M.,Fryer, R.J.,2012a.AreassessmentoftrendsintheNorthSeaLargeFishIndicator andare-evaluationofearlierconclusions.ICESJournalofMarineScience69, 343–345.

Hall,S.J.,Collie,J.S.,Duplisea,D.,Jennings,S.,Bravington,M.,Link,J.,2006. A length-basedmultispeciesmodelforevaluatingcommunityresponsesto fish-ing.CanadianJournalofFisheriesandAquaticSciences63,1344–1359.

Hartvig, M., Andersen,K.H., Beyer, J.E., 2011. Food webframework for size-structuredpopulations.JournalofTheoreticalBiology272,113–122.

Heath,M.R.,Speirs,D.C.,2012.ProceedingsoftheRoyalSocietySeriesB.Changes inspeciesdiversityandsizecompositionintheFirthofClydedemersalfish community(1927–2009).279,543–552.

Heithaus,M.R.,Frid,A.,Wirsing,A.J.,Worm,B.,2008.Predictingecological conse-quencesofmarinetoppredatordeclines.TrendsinEcologyandEvolution23, 202–210.

Heslenfeld,P.,Enserink,E.L.,2008.OSPAREcologicalQualityObjectives:the util-ityofhealthindicatorsfortheNorthSea.ICESJournalofMarineScience65, 1392–1397.

ICES,2009a.ReportoftheHerringAssessmentWorkingGroupfortheAreaSouthof 62N,17–25March2009,ICESHeadquarters,Copenhagen.,648.

ICES,2009b.ReportoftheWorkingGroupontheAssessmentofDemersalStocksin theNorthSeaandSkagerrak–CombinedSpringandAutumn(WGNSSK),6–12 May2009,ICESHeadquarters,Copenhagen.,10028pp.

ICES,2010.ManualfortheInternationalBottomTrawlSurveys–RevisionIII.ICES, Copenhagen,Denmark.

ICES,2012.ReportoftheICESAdvisoryCommittee2012-ICESAdvice2012Book6. NorthSea,447pp.

ICES,2013.ReportoftheWorkingGroupontheAssessmentofDemersalStocksin theNorthSeaandSkagerrak(WGNSSK),24–30April2013,ICESHeadquarters, Copenhagen.ICESCM2012/ACOM:13,1346pp.

Modica,L.,Velasco,F.,Preciado,I.,Soto,M.,Greenstreet,S.P.R.,2014.Developmentof thelargefishindicatorandassociatedEcologicalQualityObjectivefora North-EastAtlanticfishcommunity.ICESJournalofMarineScience,http://dx.doi.org/ 10.1093/icesjms/fsu101.

Molloy,P.P.,McLean,I.B.,Cote,I.M.,2009.Effectsofmarinereserveageonfish populations:aglobalmeta-analysis.JournalofAppliedEcology46,743–751.

Myers,R.,Worm,B.,2003.Rapidworldwidedepletionofpredatoryfish communi-ties.Nature423,280–283.

Olsen,E.M.,Ottersen,G.,Llope,M.,Chand,K.-S.,Beagrand,G.,Stenseth,N.C.,2011.

SpawningstockandrecruitmentinNorthSeacodshapedbyfoodandclimate. ProceedingsoftheRoyalSocietyB278,504–510.

Payne,M.R.,Hatfield,E.M.C.,Dickey-Collas,M.,Falkenhaug,T.,Gallego,A.,Groger, J.,Licandro,P.,llope,M.,Munk,P.,Rockman,C.,Schmidt,J.O.,Nash,R.D.M., 2009.Recruitmentinachangingenvironment:the2000’sNorthSeaherring recruitmentfailure.ICESJournalofMarineScience66,272–277.

Pope,J.G.,Rice,J.C.,Daan,N.,Jennings,S.,Gislason,H.,2006.Modellinganexploited marinefishcommunitywith15parameters—resultsfromasimplesize-based model.ICESJournalofMarineScience63,1029–1044.

Pope,J.G.,MacDonald,D.S.,Daan,N.,Reynolds,J.D.,Jennings,S.,2000.Gaugingthe impactoffishingmortalityonnon-targetspecies.ICESJournalofMarineScience 53,1157–1169.

Pyper,B.J.,Peterman,R.M.,1998.Comparisonofmethodstoaccountfor autocor-relationincorrelationanalysisoffishdata.CanadianJournalofFisheriesand AquaticSciences55,2127–2140.

Rochet,M.-J.,Collie,J.S.,Jennings,S.,Hall,S.J.,2011.Doesselectivefishingconserve communitybiodiversity?Predictionsfromalength-basedmultispeciesmodel. CanadianJournalofFisheriesandAquaticSciences68,469–486,http://dx.doi. org/10.1139/F10-159.

Rossberg,A.G.,Ishii,R.,Amemiya,T.,Itoh,K.,2008.Thetop-downmechanismfor body-massabundancescaling.Ecology89,567–580.

Shephard,S.,Fung,T.,Houle,J.E.,Farnsworth,K.D.,Reid,D.G.,Rossberg,A.G.,2012.

Size-selectivefishingdrivesspeciescompositionintheCelticSea.ICESJournal ofMarineScience69,223–234.

Shephard,S.,Greenstreet,S.P.R.,Reid,D.G.,2011.Interpretingthelargefishindicator fortheCelticSea.ICESJournalofMarineScience68,1963–1972.

Shin,Y.J.,Rochet,M.J.,Jennings,S.,Field,J.G.,Gislason,H.,2005.Usingsize-based indicatorstoevaluatetheecosystemeffectsoffishing.ICESJournalofMarine Science62,384–396.

Simpson,S.D.,Jennings,S.,Johnson,M.P.,Blanchard,J.L.,Schön,P.-J.,Sims,D.W., Genner,M.J.,2011.Continentalshelf-wideresponseofafishassemblagetorapid warmingofthesea.CurrentBiology21,1565–1570.

Speirs,D.C.,Guirey,E.J.,Gurney,W.S.C.,Heath,M.R.,2010.Alength-structured par-tialecosystemmodelforcodintheNorthSea.FisheriesResearch106,474–494.

Thorpe,R.B.,LeQuesne,W.J.F.,Luxoford,F.,Collie,J.S.,Jennings,S.,2015.Evaluation andmanagementimplicationsofuncertaintyinamultispeciessize-structured modelofpopulationandcommunityresponsestofishing.MethodsinEcology andEvolution6,49–58,http://dx.doi.org/10.1111/2041-210X.12292. Ulrich,C.,Wilson,D.C.K.,Nielsen,J.R.,Bastardie,F.,Reeve,S.A.,Andersen,B.S.,

Figure

Table 2 for
Table 4
Fig. 1).
Fig. 2a)
+3

References

Related documents