City, University of London Institutional Repository
Citation
:
Beckmann, J., Czudaj, R. and Pilbeam, K. (2015). Causality and volatility patterns between gold prices and exchange rates. The North American Journal of Economics and Finance, 34, pp. 292-300. doi: 10.1016/j.najef.2015.09.015This is the accepted version of the paper.
This version of the publication may differ from the final published
version.
Permanent repository link:
http://openaccess.city.ac.uk/12669/Link to published version
:
http://dx.doi.org/10.1016/j.najef.2015.09.015Copyright and reuse:
City Research Online aims to make research
outputs of City, University of London available to a wider audience.
Copyright and Moral Rights remain with the author(s) and/or copyright
holders. URLs from City Research Online may be freely distributed and
linked to.
City Research Online: http://openaccess.city.ac.uk/ [email protected]
Causality and volatility patterns between gold prices and exchange
rates
∗Joscha Beckmann† Robert Czudaj‡ Keith Pilbeam§
August 20, 2015
Abstract
This paper provides a new perspective on the link between gold prices and exchange rates.
Based on gold prices denominated in five different currencies and the related bilateral exchange
rates, we put causalities and short-run volatility transmission under closer scrutiny. We provide
evidence that the identification of a strong hedge function of gold requires an explicit modeling of
the volatility component. For all currencies, exchange rate depreciations initially have a negative
impact on the gold price after one day which turns out to be positive after two days in most of the
cases. Contrary to previous studies, our results point to a specific role of the dollar in the context
of gold-exchange rate relationships: Volatility of dollar exchange rates more frequently results in
strong hedging functions of gold prices. Furthermore, the gold price denominated in the US dollar
tends to increase after a depreciation of the dollar.
Keywords: exchange rates, gold, hedge, volatility
JEL classification: F31, G15
∗
Thanks for valuable comments are due to two anonymous reviewers and the participants of the 12th Annual EEFS Conference, Berlin/Germany.
†
University of Duisburg-Essen, Department of Economics, Chair for Macroeconomics, D-45117 Essen, e-mail: [email protected], phone: (0049)-201-183-3215, fax: (0049)-201-183-4181 and Kiel Institute for the World Economy, Hindenburgufer 66, D-24105 Kiel.
‡
University of Duisburg-Essen, Department of Economics, Chair for Econometrics, D-45117 Essen, e-mail: [email protected], phone: (0049)-201-1833516, fax: (0049)-201-1834209 and FOM Hochschule f¨ur Oekonomie & Management, University of Applied Sciences, Herkulesstr. 32, D-45127 Essen.
§
1
Introduction
A long-established relationship between gold prices and dollar depreciations is based on the law of one
price: If gold is denominated in US dollar, dollar depreciations coincide with increasing gold prices in
order to eliminate arbitrage opportunities. This identity has been established by Beckers and Soenen
[1984] and Sjaastad and Scacciallani [1996] among others.1 Studies by Capie, Mills and Wood [2005]
and Sjaastad [2008] confirm this finding for different dollar exchange rates with the latter study also
identifying a causality from dollar movements to the price of gold denominated in different currencies.
In this vein, the present paper contributes to the literature in three different ways: Firstly, we focus
on volatility transmission between the gold prices denominated in different currencies and bilateral
exchange rates as a novel issue. This is important since both gold and exchange rates are (1) traded at
a high frequency and (2) linked to each other through hedge or safe haven features which are related
to periods of volatility [Ciner, Gurdgiev and Lucey, 2013]. Secondly, we pay specific attention to the
issue of causality, allowing for spillover effects in both directions. The literature is notably silent when
it comes to a clarification of the causality issue between gold prices and exchange rates. Considering
that exchange rates and gold prices are asset prices, it is reasonable to assume that causalities can
go into both directions.2 Finally, we investigate whether a special pattern for the US dollar can be
identified if several gold prices and exchange rates are considered. Pukthuanthong and Roll [2011]
have recently shown that the price of gold can be associated with currency depreciation not only for
the US dollar but also for other currencies. While they focus on a correlation analysis and Granger
causality tests, we investigate whether volatility spillover effects offer a specific role for the United
States. To analyze these questions, we estimate a GARCH-in-mean SVAR model in the tradition of
Elder [2003] which allows us to estimate the parameters of interest in an internally consistent fashion.
The remainder of this paper is organized as follows: We briefly turn to a review of the most relevant
literature in Section 2 before proceeding with a description of our data in Section 3 and of our
methodology in Section 4. Section 5 presents our results and Section 6 concludes.
1
In addition, there is a large body of literature on the general role of gold in financial markets. For instance, Gallais-Hamonno, Hoang and Oosterlinck [2015] examine the informational efficiency of the gold market in Paris.
2
2
Review of the literature
Taking into account the large body of literature on gold prices and exchange rates, we only elaborate on
a few selected studies in the following review. Early studies by Capieet al.[2005] and Sjaastad [2008]
have examined the hedge property of gold with respect to changes of the US dollar and have shown
that dollar exchange rates and gold prices are inversely related with the latter study also identifying
a causality from dollar movements to the price of gold denominated in different currencies. More
recently, Joy [2011] focused on a sample period covering 1986-2008 for 16 currencies (G7 and emerging
markets) on a weekly basis. Applying DCC-GARCH models he confirms the finding that gold acts as a
hedge against the dollar. Relying on weekly data from 2000-2012, Reboredo [2013] also finds that gold
acts as a hedge and a safe haven against the dollar while examining seven major currencies against
the dollar (Australian dollar, Canadian dollar, euro, British pound sterling, Japanese yen, Norwegian
krona, and Swiss franc) based on standard copula techniques. These insights have been deepened
in two follow-up studies in which Reboredo and Rivera-Castro [2014a,b] also examine the safe haven
properties of gold for the same seven currencies and the same sample period relying on a likelihood
ratio test and a wavelet correlation analysis, respectively. Apergis [2014] also shows that gold is
an useful predictor for the Australian dollar. Based on simple cointegration and Granger causality
tests Jain and Ghosh [2013] confirm a relationship between gold prices and the Indian rupee-US
dollar exchange rate using daily data spanning from January 2009 to December 2011.3 Studying the
relationship between commodities and currencies from a more general perspective, Antonakakis and
Kizys [2015] find that gold is the dominant transmitter of volatility spillovers to other commodities
and currencies. Recent literature also highlights the role of gold during the crisis period [Bampinas
and Panagiotidis, 2015].
While previous studies have focused on either VAR models applying cointegration and Granger
causal-ity tests or GARCH models to analyze causalities and volatilcausal-ity spillovers between gold prices and
exchange rates, respectively, we combine both methodologies to achieve further insights. Therefore,
we rely on GARCH-in-mean SVAR models in the tradition of Elder [2003] which has the additional
advantage that the parameters of interest are estimated internally consistent. To the best of our
knowledge, this framework has not been considered to examine causalities and volatility spillovers
between gold prices and exchange rates in previous studies. The second empirical contribution of our
paper to the existing literature is the fact that we do not restrict our study to bilateral exchange
against the US dollar but also consider several other bilateral exchange rates. We see both aspects
as fruitful developments of the present literature.
3
Data
Our sample period covers data from January 1979 to June 2013 on a daily basis. Data on gold prices
and bilateral exchange rates is taken from the World Gold Council and Thomson Reuters Datastream,
respectively. Gold prices are denominated in the US dollar, British pound sterling, euro, Japanese
yen, and Indian rupee4 and the evolution of these is shown in Figure I for the entire sample period.
Bilateral exchange rates against the other economies are used for each gold price series. In each case,
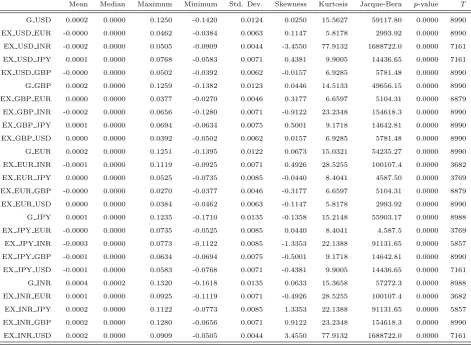
a rise of the exchange rate corresponds to a depreciation of the domestic currency. Table I reports
the descriptive statistics for the returns (i.e. first difference of the natural logarithm) of all series
included in our study and clearly shows that normality is rejected for each series due to skewness and
kurtosis.
Figure I about here
Table I about here
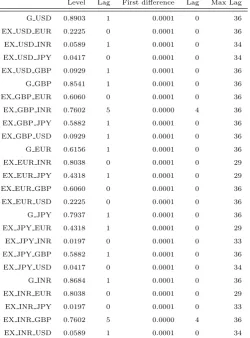
Table II reports the results for testing the null of a unit root by means of the augmented Dickey-Fuller
(ADF) test for both the level and the first difference of each series in logarithmic terms. These show
that each series is integrated of order one, i.e. I(1), since in the predominant amount of the cases
the unit root null cannot be rejected for the level but for the first difference of a series. In addition,
we have also checked each pair (i.e. gold price denominated in local currency and the exchange rate
of the local currency against one unit of the other) for cointegration and found that these are not
cointegrated5 due to a bunch of tests [Engle and Granger, 1987; Johansen, 1988; Enders and Siklos,
2001].6 Hence, our first result is that (at least for the sample period under observation) there is no
stable long-run relationship between gold prices and bilateral exchange rates. This is the reason why
our study focuses on short-run effects between these variables and examines causality and volatility
spillovers between them. As already mentioned in the previous section, in doing so, we estimate
4
Gold prices are from the London Gold Exchange as one of the main international gold markets. See also Hoang, Wong and Zhu [2015] for a recent study on the relatively new and relatively isolated Shanghai Gold Exchange.
5
Alagidede, Panagiotidis and Zhang [2011] have found a similar result between stock prices and exchange rates for several economies.
6
bivariate GARCH-in-mean SVAR models in first differences, which is described in the next section.
To account for GARCH effects is sensible since we started by estimating linear VAR models and
testing for the presence of ARCH effects in the residuals. In each case the null of no ARCH effects
has been rejected highly significant with a p-value of 0.00.
Table II about here
4
Empirical framework
One focus of our study is to analyze the volatility spillover effect between gold prices and exchange
rates, therefore we apply a framework in the tradition of Elder [2003] which allows us to estimate
the parameters of interest in an internally consistent fashion. This approach is based on a structural
vector autoregression (SVAR) that is modified to accommodate GARCH-in-mean errors. We use
the conditional standard deviation of the one-step-ahead forecast error as our measure of volatility
[Elder and Serletis, 2010]. Thus, for each gold price and exchange rate pair we consider the following
bivariate structural system, which is a linear function of lagged endogenous variables augmented by
the conditional standard deviation:
AYt=c+ Γ1Yt−1+ Γ2Yt−2+. . .+ ΓpYt−p+ Λ(L)Ht1/2+εt, t= 1, . . . , T, (1)
where Yt is a bivariate vector that contains returns of the bilateral exchange rate and the gold price
in the corresponding currency, A and Γi are 2×2 coefficient matrices, and εt|ψt−1 ∼ iid N(0, Ht).
Ht1/2 is diagonal, Λ(L) is a matrix lag polynomial, andψt−1 denotes the timet−1 information set.7
This framework allows the conditional standard deviationHt1/2 to affect the conditional mean of the system. Therefore, to test whether there is an operating volatility transmission between gold prices
and exchange rates implies the testing of restrictions on the elements of Λ(L) that, for instance, relate
the conditional standard deviation of gold returns (or exchange rate returns) to the conditional mean
of Yt.
We model the conditional variance Ht by a bivariate GARCH approach in the spirit of Engle and
7We assume the structural errorsε
tto be uncorrelated and additionally impose exclusion restrictions onAto ensure
Kroner [1995]:
ht=cv+ J
X
j=1
Fjvec(εt−jε0t−j) + I
X
i=1
Giht−i, εt=H
1/2
t zt, zt∼iid N(0, I), (2)
where ht = vec(Ht), cv denotes a 4-dimensional vector of intercept terms, and F and G are 4×4
coefficient matrices. Given that the structural disturbances are not contemporaneously correlated,
the conditional variance matrixHt is diagonal and so Equation (2) can be expressed as:
diag(Ht) =cv+ J
X
j=1
Fjdiag(εt−jε0t−j) + I
X
i=1
Gidiag(Ht−i). (3)
We estimate this bivariate GARCH-in-mean SVAR model, given by Eq. (1) and (3), by means of full
information maximum likelihood (FIML), since this procedure avoids generated regressor problems
pointed out by Pagan [1984] which would arise if one estimates the variance function parameters
separately from the conditional mean parameters [Beckmann and Czudaj, 2014].
5
Empirical results
Our empirical findings can be classified into four categories: The impact of gold price volatility and
gold price changes on exchange rate changes and the reversed causalities from exchange rates to
gold prices. The latter causality has been frequently analyzed in the context of hedge or safe haven
functions of gold without incorporating an explicit modeling of volatility shocks. Gold is said to be
a weak or strong hedge if it is uncorrelated or negatively correlated with exchange rates on average,
respectively [Baur and McDermott, 2010; Beckmann, Berger and Czudaj, 2015].
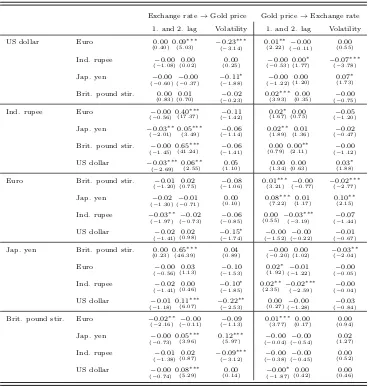
Table III reports the findings for all estimated GARCH-in-mean SVAR models providing possible
causalities between gold prices and exchange rates in terms of statistical significance of lagged
ex-change rate returns. The empirical pattern for an impact of gold prices on exex-change rates is in line
with the short-run phenomenon of the hedging property: Exchange rates changes always either have
a negative or no significant impact on gold price changes for the first lag, suggesting that either the
hedge or safe haven function is at work. However, a positive impact of exchange rate changes is
frequently observed over the second lag for the UK and Japan in two out of four cases, for India in
all cases and for the US in one case. These results suggest that the short-run property of gold acting
exchange rates do not exhibit a specific pattern.
Another important finding corresponds to the impact of exchange rate volatility on gold returns.
There are 7 cases where increasing exchange rate volatility results in negative gold price changes,
mirroring a strong hedge function of gold. In none of these cases does the first lag impact of exchange
rate changes on gold returns turn out to be significant. Hence, the identification of a strong hedge
function of gold requires an explicit modeling of the volatility component. The results also hint at a
specific role of the dollar since 4 out of 7 cases mentioned above that imply a strong hedge function
stem from dollar exchange rates. In the reverse causation there is no case where a significant impact
of dollar exchange rate changes on gold returns is observed.
The results presented in the second column of Table III show that the findings for gold prices on
exchange rate changes provide a different pattern. Firstly, the impact of gold price volatility on
the exchange rate is ambiguous since both positive and negative coefficients are observed. More
importantly, first or second lag gold price changes result in negative exchange rate responses in 13
cases, while a positive impact is only observed in 3 cases. Hence, an increase of the gold price results
in an appreciation of the domestic currency in many cases. Once again, the pattern for the dollar
is different. A rise of the gold price results in a depreciation of the dollar against the euro and the
Japanese yen for the first lag but turn to be negative for the second lag. These findings show that
the US dollar is the only currency for which a gold price increase results in a depreciation while an
appreciation of the local currency is observed in most other cases. This result is of course based on
a daily frequency and does not necessarily contradict the law of one price since we take lagged gold
price changes as a starting point.
Table III about here
6
Conclusions
Previous research has established a link between gold prices and currency depreciations based on
the law of one price without accounting for volatility transmission. Using daily data and explicitly
allowing for volatility spillovers, we do not find clear evidence for such a relationship over the very
short-run. Exchange rate depreciations have a negative impact on the gold price measured in different
currencies after one day which partly turns out to be positive after two days.
the gold price-exchange rate nexus: Increasing volatility of dollar exchange rates more frequently
results in a strong hedging function of gold. Furthermore, the gold price denominated in the US
dollar exclusively increases after a depreciation of the dollar. In particular the first aspect might be
of relevance from a practical perspective. Volatility of dollar exchange rates can result in substantial
losses for investors and the fact that gold is partly able to offset these losses therefore deserves
attention in further research. Focusing on investor’s utility in a multivariate portfolio framework
might for example be an interesting way to proceed.
References
Alagidede P, Panagiotidis T, Zhang X. 2011. Causal relationship between stock prices and exchange rates.Journal of
International Trade & Economic Development20: 67–86.
Antonakakis N, Kizys R. 2015. Dynamic spillovers between commodity and currency markets. International Review of Financial Analysis forthcoming: http://dx.doi.org/10.1016/j.irfa.2015.01.016.
Apergis N. 2014. Can gold prices forecast the Australian dollar movements? International Review of Economics &
Finance29: 75–82.
Bampinas G, Panagiotidis T. 2015. On the relationship between oil and gold before and after financial crisis:
Lin-ear, nonlinear and time-varying causality testing.Studies in Nonlinear Dynamics and Econometrics forthcoming: http://dx.doi.org/10.1515/snde–2014–0060.
Baur D, McDermott T. 2010. Is gold a safe haven? International evidence.Journal of Banking & Finance34: 1886–1898.
Beckers S, Soenen L. 1984. Gold: More attractive to non-U.S. than to U.S. investors? Journal of Business Finance & Accounting11: 107–112.
Beckmann J, Berger T, Czudaj R. 2015. Does gold act as a hedge or a safe haven for stocks? A smooth transition
approach.Economic Modelling 48: 16–24.
Beckmann J, Czudaj R. 2013. Oil prices and effective dollar exchange rates. International Review of Economics & Finance27: 621–636.
Beckmann J, Czudaj R. 2014. Volatility transmission in agricultural futures markets. Economic Modelling 36: 541 – 546.
Capie F, Mills TC, Wood G. 2005. Gold as a hedge against the dollar. Journal of International Financial Markets,
Institutions and Money15: 343–352.
Chen YC, Rogoff KS, Rossi B. 2008. Can exchange rates forecast commodity prices? Quarterly Journal of Economics
125: 1145–1194.
Ciner C, Gurdgiev C, Lucey BM. 2013. Hedges and safe havens: An examination of stocks, bonds, gold, oil and exchange rates.International Review of Financial Analysis 29: 202–211.
Elder J. 2003. An impulse-response-function for a vector autoregression with multivariate GARCH-in-mean.Economics
Letters 79: 21–26.
Enders W, Siklos P. 2001. Cointegration and threshold adjustment. Journal of Business & Economic Statistics 19: 166–176.
Engle RF, Granger CWJ. 1987. Cointegration and error correction: Representation, estimation and testing.
Economet-rica55: 251–276.
Engle RF, Kroner KF. 1995. Multivariate simultaneous generalized ARCH.Econometric Theory11: 122–50.
Gallais-Hamonno G, Hoang THV, Oosterlinck K. 2015. Informational efficiency of the clandestine and official gold
markets in Paris.Economics Letters126: 28–30.
Hoang THV, Wong WK, Zhu Z. 2015. Is gold different for risk-averse and risk-seeking investors? An empirical analysis
of the Shanghai Gold Exchange.Economic Modelling 50: 200–211.
Jain A, Ghosh S. 2013. Dynamics of global oil prices, exchange rate and precious metal prices in India.Resources Policy 38: 88–93.
Johansen S. 1988. Statistical analysis of cointegration vectors.Journal of Economic Dynamics and Control12: 231–254.
Joy M. 2011. Gold and the US dollar: Hedge or haven? Finance Research Letters8: 120–131.
O’Connor FA, Lucey BM, Batten JA, Baur DG. 2015. The financial economics of gold - a survey.International Review
of Financial Analysisforthcoming: http://dx.doi.org/10.1016/j.irfa.2015.07.005.
Pagan A. 1984. Econometric issues in the analysis of regressions with generated regressors. International Economic Review25: 221–247.
Pukthuanthong K, Roll R. 2011. Gold and the dollar (and the euro, pound, and yen).Journal of Banking & Finance
35: 2070–2083.
Reboredo JC. 2013. Is gold a safe haven or a hedge for the US dollar? Implications for risk management.Journal of
Banking & Finance37: 2665–2676.
Reboredo JC, Rivera-Castro MA. 2014a. Can gold hedge and preserve value when the US dollar depreciates? Economic Modelling 39: 168–173.
Reboredo JC, Rivera-Castro MA. 2014b. Gold and exchange rates: Downside risk and hedging at different investment
horizons.International Review of Economics & Finance34: 267–279.
Sjaastad LA. 2008. The price of gold and the exchange rates: Once again.Resources Policy33: 118–124.
Sjaastad LA, Scacciallani F. 1996. The price of gold and the exchange rate.Journal of International Money and Finance
Figures
Figure I Gold price in five currencies
This figure presents the natural logarithm of daily gold prices in five different currencies from January 1979 to June 2013.
5.2 5.6 6.0 6.4 6.8 7.2 7.6
1980 1985 1990 1995 2000 2005 2010
US dollar
4.5 5.0 5.5 6.0 6.5 7.0 7.5
1980 1985 1990 1995 2000 2005 2010
British pound sterling
4.5 5.0 5.5 6.0 6.5 7.0 7.5
1980 1985 1990 1995 2000 2005 2010
Euro
10.0 10.5 11.0 11.5 12.0 12.5
1980 1985 1990 1995 2000 2005 2010
Japanese yen
7 8 9 10 11 12
1980 1985 1990 1995 2000 2005 2010
Tables
Table IDescriptive statistics of the returns
Mean Median Maximum Minimum Std. Dev. Skewness Kurtosis Jarque-Bera p-value T
Table IIUnit root tests
Level Lag First difference Lag Max Lag
G USD 0.8903 1 0.0001 0 36 EX USD EUR 0.2225 0 0.0001 0 36 EX USD INR 0.0589 1 0.0001 0 34 EX USD JPY 0.0417 0 0.0001 0 34 EX USD GBP 0.0929 1 0.0001 0 36 G GBP 0.8541 1 0.0001 0 36 EX GBP EUR 0.6060 0 0.0001 0 36 EX GBP INR 0.7602 5 0.0000 4 36 EX GBP JPY 0.5882 1 0.0001 0 36 EX GBP USD 0.0929 1 0.0001 0 36 G EUR 0.6156 1 0.0001 0 36 EX EUR INR 0.8038 0 0.0001 0 29 EX EUR JPY 0.4318 1 0.0001 0 29 EX EUR GBP 0.6060 0 0.0001 0 36 EX EUR USD 0.2225 0 0.0001 0 36 G JPY 0.7937 1 0.0001 0 36 EX JPY EUR 0.4318 1 0.0001 0 29 EX JPY INR 0.0197 0 0.0001 0 33 EX JPY GBP 0.5882 1 0.0001 0 36 EX JPY USD 0.0417 0 0.0001 0 34 G INR 0.8684 1 0.0001 0 36 EX INR EUR 0.8038 0 0.0001 0 29 EX INR JPY 0.0197 0 0.0001 0 33 EX INR GBP 0.7602 5 0.0000 4 36 EX INR USD 0.0589 1 0.0001 0 34
Table III GARCH-in-mean SVAR models
Exchange rate→Gold price Gold price→Exchange rate 1. and 2. lag Volatility 1. and 2. lag Volatility
US dollar Euro 0.00
(0.40)0.09
∗∗∗
(5.03) −0.23
∗∗∗
(−3.14)
0.01∗∗
(2.22) (−−0.000.11)
0.00
(0.55)
Ind. rupee −0.00
(−1.08)
0.00
(0.02)
0.00
(0.25) −
0.00
(−0.53)
0.00∗
(1.77) −
0.07∗∗∗
(−3.78)
Jap. yen −0.00
(−0.60)
−0.00
(−0.37)
−0.11∗
(−1.88)
−0.00
(−1.22)
0.00
(1.20)
0.07∗
(1.73)
Brit. pound stir. 0.00
(0.83)(00.01.70) (−−0.020.23)
0.02∗∗∗
(3.93) (00.00.35) (−−0.000.75)
Ind. rupee Euro −0.00
(−0.56)
0.40∗∗∗
(17.37) −
0.11
(−1.42)
0.02∗
(1.67)
0.00
(0.75) −
0.05
(−1.20)
Jap. yen −0.03∗∗
(−2.01)
0.05∗∗∗
(3.49) (−−0.061.14)
0.02∗∗
(1.89) (10.01.36) (−−0.020.47)
Brit. pound stir. −0.00
(−1.45)
0.65∗∗∗
(41.24) (−−0.061.41)
0.00
(0.79)0.00
∗∗
(2.11) (−−0.001.12)
US dollar −0.03∗∗∗
(−2.69)
0.06∗∗
(2.55)
0.05
(1.10)
0.00
(1.34)
0.00
(0.63)
0.03∗
(1.88)
Euro Brit. pound stir. −0.01
(−1.20)
0.02
(0.75) (−−0.081.06)
0.01∗∗∗
(3.21) (−−0.000.77)
−0.02∗∗∗
(−2.77)
Jap. yen −0.02
(−1.30)
−0.01
(−0.71)
0.00
(0.10) 0.08
∗∗∗
(7.22) (10.01.17) 0.10
∗∗
(2.15)
Ind. rupee −0.03∗∗
(−1.97)
−0.02
(−0.73)
−0.06
(−0.85)
0.00
(0.55)−
0.03∗∗∗
(−3.19)
−0.07
(−1.44)
US dollar −0.02
(−1.41)
0.02
(0.98) −
0.15∗
(−1.74)
−0.00
(−1.52)
−0.00
(−0.22)
−0.01
(−0.67)
Jap. yen Brit. pound stir. 0.00
(0.23)0.65
∗∗∗
(46.39) (00.04.89) (−−0.000.20)
0.00
(1.02) −0.03
∗∗
(−2.04)
Euro −0.00
(−0.56)
0.03
(1.13) −
0.10
(−1.53)
0.02∗
(1.92) −
0.01
(−1.22)
−0.00
(−0.05)
Ind. rupee −0.02
(−1.41)
0.00
(0.46) −0.10
∗
(−1.85)
0.02∗∗
(2.35) −0.02
∗∗∗
(−2.59)
−0.00
(−0.04)
US dollar −0.01
(−1.18)
0.11∗∗∗
(6.07) −0.22
∗∗
(−2.53)
0.00
(0.27)(−−0.001.28)
−0.03
(−0.84)
Brit. pound stir. Euro −0.02∗∗
(−2.16)
−0.00
(−0.11)
−0.09
(−1.13)
0.01∗∗∗
(3.77)
0.00
(0.17)
0.00
(0.94)
Jap. yen −0.00
(−0.73)
0.05∗∗∗
(3.96) 0.12
∗∗∗
(5.97) (−−0.000.04)
−0.00
(−0.54)
0.02
(1.27)
Ind. rupee −0.01
(−1.38)
0.02
(0.87) −0.09
∗∗∗
(−3.12)
−0.00
(−0.38)
−0.00
(−0.45)
0.00
(0.52)
US dollar −0.00
(−0.74)
0.08∗∗∗
(5.29)
0.00
(0.14) −
0.00∗
(−1.87)
0.00
(0.42)
0.00
(0.46)