Int. J. Electrochem. Sci., 12 (2017) 2798 – 2812, doi: 10.20964/2017.04.64
International Journal of
ELECTROCHEMICAL
SCIENCE
www.electrochemsci.org
Study and Application of Electrochemical Impedance
Spectroscopy for Quickly Evaluating the Performance of
Coatings and Predicting the Failure Time in the Development of
Waterborne Epoxy Micaceous Iron Oxide Coatings
Zhonghua Chen1,2, Chang He1,*, Fei Yu1**, Yi Wang1
1
College of Material Science and Engineering, South China University of Technology, Guangzhou 510640, China
2
Guangzhou Jointas Chemical Co. Ltd., Guangzhou 510530, China
*
E-mail: [email protected]
**
Email: [email protected]
Received: 14 January 2017 / Accepted: 3 March 2017 / Published: 12 March 2017
The possibility and necessity of using electrochemical tests to characterize the coating performance and guide the development and application of coating products were discussed. An attempt was made to establish the relationship between the electrochemical parameters and the macroscopic behavior of the coating. Waterborne micaceous iron oxide epoxy coatings were prepared and characterized by SEM, Electrochemical Impedance Spectroscopy (EIS) and conventional corrosion tests. The effects of the particle size and the pigment volume concentration (PVC) on the corrosion properties were discussed. Results revealed that the good anticorrosive performance of the paint was obtained when the 600-mesh-sized MIO was used and the pigment volume concentration (PVC) was 39%. The consistency of the two EIS parameters (the partial fitting coating resistance Rpart and the phase angle at
10 Hz) for evaluating the performance of the coatings was confirmed. The electrochemical failure time (EFT) was defined, and then compared with the macroscopic blistering time, which verified the possibility of applying this parameter in the development of coating products.
Keywords: MIO; EIS; coating performance; rapid evaluation; electrochemistry failure time
1. INTRODUCTION
then the performance of coatings is analyzed. But in fact, the equivalent circuit requires a lot of experience to be established due to the uncertainty of the equivalent circuit, and it is also time-consuming [5]. Researchers proposed the use of raw data, instead of the complicated fitting parameters, to evaluate the coatings studied [5-14]. Y. Zuo et al [15]proposed the phase angle at 10 Hz to reflect the performance of coatings, because the variation of 10Hz is more identical with the change
of coating resistance. L. Liang et al [16] proposed the partially fitted coating resistance from high-frequency EIS data to evaluate the protectiveness of coatings. These parameters can show the anticorrosion performance of the anticorrosive coating, which are collected in the middle and high frequency ranges. However, whether there exist associations or consistencies among these characteristic parameters hasn't been studied yet. The effectiveness of these methods for evaluating the performance of the coatings studied needs to be tested. Meanwhile, the relationship between the electrochemical parameters and conventional corrosion tests also needs to be discussed, in an attempt to accelerate the testing of the anticorrosion performance and guide the development of the coating products.
Micaceous iron oxide epoxy coating is usually used in the field of heavy-duty coatings, and the coatings primarily act as physical barrier to extend the time it takes for the corrosive medium to penetrate into the primer and the substrate. Different from that in the oil paint, the MIO with larger density is difficult to be dispersed and stable in the water-based paint. So the particle size of the natural MIO has a significant impact on the dispersion in the waterborne system, thereby affecting the anticorrosion properties of the coatings [17]. P. Kalenda et al [18] studied the effect of lamellar pigments concentration (expressed as PVC) on the anticorrosion properties. Similarly, the content of MIO has a significant effect on the corrosion resistance of the epoxy coatings [19].
In this paper, waterborne micaceous iron oxide epoxy coatings were prepared. Simultaneously, conventional corrosion tests and EIS were used to characterize the anticorrosion properties of the coatings. The failure behavior of the waterborne micaceous iron oxide epoxy coating system was studied. And two different methods were applied to evaluate the performance of coatings. Then, the relationship between the macroscopic state of the coating and the electrochemical parameters was analyzed, which may help to quickly evaluate the coating performance and accelerate the development of coating products.
2. EXPERIMENTAL
2.1 Materials
The MIO is derived from natural mirror iron ore, produced in Anhui, China. Its main component is α-Fe2O3. The iron content, expressed as Fe2O3, is not less than 93%. Its oil absorption
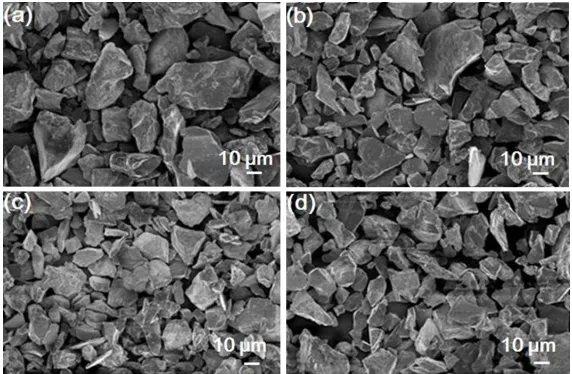
[image:3.596.155.441.182.369.2]value is 13%, the residue on sieve (63 μm) not more than 1% and the content of silica not more than 3.0%. The content of flake mica iron oxide reaches about 60%. Fig. 1 presents MIO of different particle size. Obviously, The MIO of 600 mesh shows a greater ratio of thickness to diameter.
Figure 1. SEM micro morphologies of the MIO of different particle size: (a) 325 mesh, (b) 400 mesh, (c) 600 mesh, (d) 800 mesh.
2.2 Characterization
The morphologies of MIO were characterized by NOVA NANOSEM 430 scanning electron microscopy (SEM) (FEI Corporation, Holland). The fractured surfaces of coatings with different PVC were also characterized by NOVA NANOSEM 430. The morphologies of the rust were characterized by NOVA NANOSEM 430 and ZC-XW-07 optics microscope (China).
2.3 Preparation of coatings
Waterborne epoxy resin and waterborne coating additives (such as dispersing agent, antifoaming agents, corrosion inhibitor and so on) were added into water with moderate-speed stirring for 15 min. Then the MIO pigment was added and mixed at high-speed stirring for about 45 min until the fineness of coatings was lower than 60 microns. Other additives such as leveling agent, antifoaming agent and rheological agent were added with stirring mildly for 15 min. The component A of waterborne epoxy micaceous iron oxide paint was obtained. Note that the choice of MIO was shown in Table 1, and the PVC was shown in Table 2. The component B was the waterborne curing agent.
2.4 Testing of coatings
The system studied consisted of polished carbon steel, coated with coatings prepared. The steel plate was carefully polished with silicon carbide abrasive paper after preliminary clean with acetone, and finally cleaned thoroughly with acetone. The system studied was dried for 7 days under normal temperature and humidity environments ( temperature: 25 ℃, humidity: 50%). The thickness of the films was measured by an electromagnetic thickness gauge. The accuracy of the gauge was ±3% of the reading. Sample 1~8 were prepared (as shown in Table 1 and Table 2), of which the thickness was 100±5 μm.
In the accelerated test, carbon steels with a nominal thickness of 0.8 mm coated samples were immersed in sodium chloride solution (3.5 wt%) according to ASTM D 543-67, and exposed to neutral salt spray chamber (5 wt% sodium chloride solution) in accordance with ASTM B117. The temperature of the salt spray chamber was 35±3 ℃. The adhesion test was in accordance with ASTM D 3359-93. For each sample three parallel experiments were performed.
2.5 Electrochemical Impedance Spectroscopy (EIS)
The EIS measurements were carried out with PGSTAT2273 electrochemical workstation. The three-electrode cell for EIS included a standard calomel reference electrode, a steel plate counter electrode of 4.5 cm2 in area, and a working electrode (carbon steels coated samples) of 15 cm2 in area, immersed in 3.5 wt% sodium chloride solution, and the EIS measurement were performed at room temperature(25 ℃) in a faraday shielding box. The shielding device does not isolate the test device from the air, but shields against the external interference to the test. The measurement frequency ranged from 100 kHz to 10 mHz, using a sinusoidal potential perturbation of 10 mV amplitude.
After a period of exposure, the performance of coatings was evaluated by EIS measurements and visual assessment. At the initial stage, samples were evaluated and observed every 4 hours, after then, every 12 hours. Three parallel experiments were performed in each experiment to ensure reproducibility. The data were analyzed by ZSimpWin software. The tolerance of the fitting data was usually below 5%.
3. RESULTS AND DISCUSSION
3.1 Influences of the particle size of MIO on the protection performances of coatings
MIO acts as a barrier in waterborne epoxy micaceous iron oxide paint, which reduces the corrosive species transport through the film. MIO with proper particle size (as shown in Fig. 1) can effectively improve the shielding properties of the coatings, which was called “labyrinth effect”.
[image:5.596.54.549.211.298.2]
400 h, and the ranking of coatings in neutral salt spray test (NSST) is the lowest. As is shown in Fig. 1, the MIO of 600 mesh has larger ratio of diameter to thickness than others. However, some of the MIO of 325 mesh or 400 mesh have lower ratios of thickness to diameter and coarse particle, resulting in precipitation. The particle of 800 mesh has a lower particle size and less flake structure. Additionally, some of them show a long strip structure. These factors may lead to the poor “labyrinth effect”.
Table 1. Sample 1-4 and their result of conventional corrosion tests. Samples Average particle
size / mesh
Adhesive/level Blistering time of coatings in SCST/ h
Ranking of coatings in NSST (exposed 25 d)
Sample 1 325 1 285 4
Sample 2 400 1 275 4
Sample 3 600 1 400 2
Sample 4 800 1 350 3
[image:5.596.52.551.347.487.2]Note: the ranking of coatings is in according to ISO 4628-2-2003.
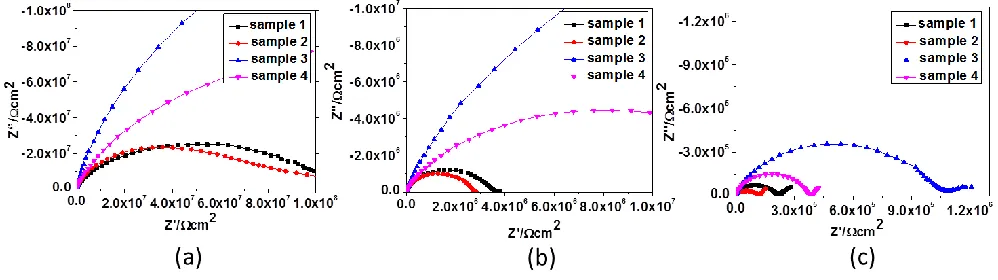
Figure 2. Nyquist plots for sample 1-4 at three different immersion times: (a) 0 h, (b) 24 h, (c) 360 h.
It should be emphasized here that different anti-corrosion mechanisms exhibit different variations of capacitive arc. For example, the anti-corrosion mechanism of zinc-rich paint is sacrificial-to-barrier protection. The zine-rich paints may exhibit low value of impedance modulus in the early immersion [14]. After immersion for a short time, two time constants appear rapidly in the impedance spectroscopy of zine-rich coating and the coating resistances of zine-rich coatings may increase because of the sacrificial protection [3].
[image:6.596.82.517.255.343.2]3.2 Effect of pigment volume concentration (PVC) on the performances of coatings
Table 2. Effect of different PVC on the performances of coatings. Samples PVC/% Adhesive/level Blistering time of
coatings in SCST/ h
Ranking of coatings in NSST(exposed 30 d)
Sample 5 54 1 137 4
Sample 6 47 1 200 4
Sample 7 39 0 550 1
Sample 8 30 0 390 2
Note: the mesh-size of MIO for samples 5-8 is 600 mesh.
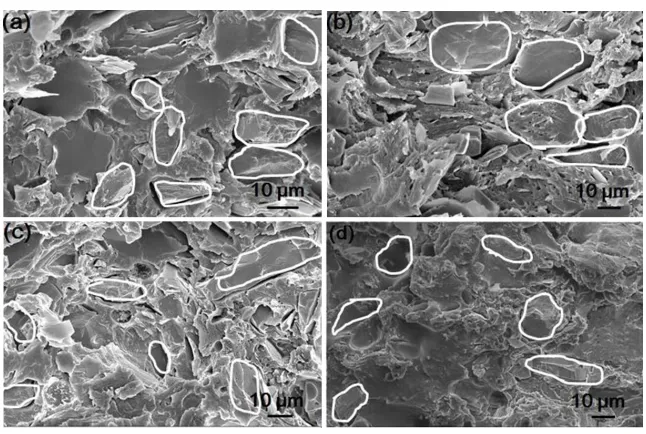
Figure 3. SEM micro morphology of sample 5-8 with different PVC.
[image:6.596.137.460.382.599.2][image:7.596.74.534.201.334.2]
proportion of resin increased, and the dispersity of the pigment in coating body is improved, resulting in reduction of the number of pores. When the PVC is 39%, the pigment is evenly dispersed in the resin. And the flake pigments orientation tends to be slightly parallel to each other. So the durability of the protective film in SCST increases and the ranking of coatings in NSST also increased. As the PVC reduces to less than 39%, the low content of flake pigments results in weak labyrinth effect, which means that the barrier of the film on the substrate is reduced.
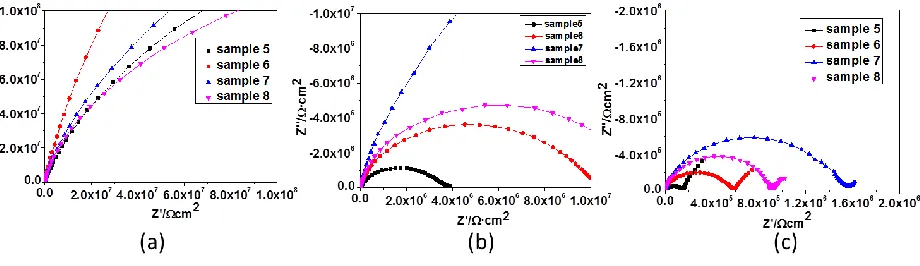
Figure 4. Nyquist plots for samples 5-8 at three different immersion times: (a) 0 h, (b) 24 h, (c) 360 h.
Fig. 4 shows the electrochemical impedance spectra of sample 5-8 at different immersion times. The Nyquist diagrams shown in Fig. 4(a) display that these 4 samples have only one typical capacitive arc in the complex plane, respectively, and the coating resistance remained above 108 Ω·cm2 before immersion. The Nyquist diagrams shown in Fig. 4(b) also exhibit one capacitive arc in the complex plane of samples 5- 8 after an immersion time of 24 h. Sample 7 shows a larger capacitive arc. Fig. 4 (c) displays two apparent capacitive arcs in the complex plane of sample 5-8 after an immersion time of 360 h. As can be seen from the analysis below, the capacitive arcs in the low frequency region represent the diffusion of corrosion products. And simultaneously, sample 7 shows a smaller arc at the low frequency region, which suggested the diffusion of corrosion products is weakened and the corrosion degree of the substrate is the lowest. From the discussion above, sample 7 (PVC is 39%) provides a better barrier to protect the coatings.
3.3 Evaluation of methods for quickly predicting the performances of coatings
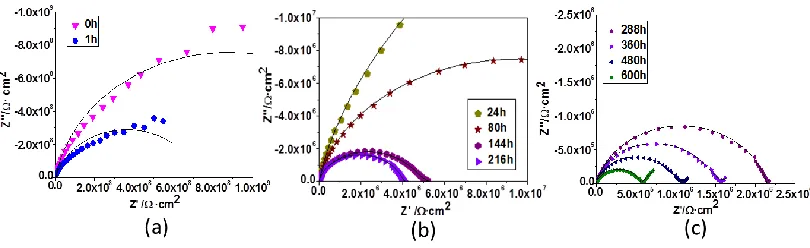
Fig. 5 shows typical sets of EIS data of the studied coatings at different exposure times in SCST. At the early immersion stage, the coatings studied exhibit a lager capacitive arc in the Nyquist plots, of which the dielectric response shows properties of the coating. Its EEC is shown in Fig. 6(a). The coating serves as a barrier layer, and the coating resistance (Rcoat) is very large. After a few hours
shows only one gradually reduced capacitive arc, indicating continuous penetration of the electrolyte solution and slight electrochemical reactions. Meanwhile, the macroscopic appearance of the coating is intact as well. With the immersion time increasing, a diffusion tail appears in the impedance spectroscopy due to the fact that the mass transfer process of corrosion product is hampered in the presence of mica iron oxide pigments [21]. Its EEC is shown in Fig. 6(c). The low-frequency diffusion arc gradually evolved into a similar diffusion straight line over time, which is often accompanied by the generation of macroscopic blisters in the coating surface. And then the test is terminated, because a long-time test conducted till the coatings completely fall off from the substrate does not comply with test specification.
Figure 5. Typical Nyquist diagrams of sample 7 at different immersion times. (a)-(c) represent the three different stages of the impedance spectrum:(a) 0-1 h, (b) 24-216 h, (c) 288-600 h.
Figure 6. EECs used to fit EIS diagrams of coatings in during immersion time. Rs is the solution
resistance. Rcoat is the coating capacitance. CPEcoat is the coating capacitance. Rt represents
charge-transfer resistance and CPEdl represents double- layer capacitance. Rdiff and CPEdiff
shows diffusion resistance and the mass transfer process of diffusates, respectively.
In this section, the anticorrosion performance of the coating samples is quickly evaluated by the phase angle of 10 Hz ( 10Hz) and the partial fitting coating resistance (Rpart) method, respectively.
[image:8.596.96.501.255.379.2] [image:8.596.160.427.443.572.2]
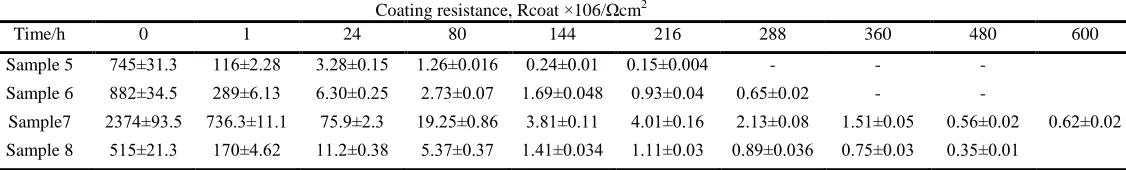
Table 3. Coating resistance (Rcoat) with immersion time in SCST.
Coating resistance, Rcoat ×106/Ωcm2
Time/h 0 1 24 80 144 216 288 360 480 600
Sample 5 745±31.3 116±2.28 3.28±0.15 1.26±0.016 0.24±0.01 0.15±0.004 - - - Sample 6 882±34.5 289±6.13 6.30±0.25 2.73±0.07 1.69±0.048 0.93±0.04 0.65±0.02 - -
[image:9.596.18.581.100.185.2]Sample7 2374±93.5 736.3±11.1 75.9±2.3 19.25±0.86 3.81±0.11 4.01±0.16 2.13±0.08 1.51±0.05 0.56±0.02 0.62±0.02 Sample 8 515±21.3 170±4.62 11.2±0.38 5.37±0.37 1.41±0.034 1.11±0.03 0.89±0.036 0.75±0.03 0.35±0.01
Figure 7. The variations of the coatings resistance with immersion time for samples 5-8.
Fig. 7 shows the variations of coating resistance (Rcoat) with immersion time for sample 5-8. The
figure shows that Rcoat decreases rapidly in the early, followed by a slow decrease. The coating
resistance is related to the porosity of the coating. In the early stage of immersion, the electrolyte solution penetrates into the coating body at a higher initial rate, resulting in rapid increase of porosity, followed by a slow rise of porosity due to the blocking of inert pigments and the presence of diffusion medium. When Rcoat decreases to about 1.0 ×10⁶ Ω·cm2,a significant capacitance tail or arc appears in
Nyquist diagrams at low frequency region, which indicates the electrochemical corrosion reactions of the steel substrate underneath have already strongly occurred, but no visible blisters at that moment. At this time, it is generally considered that the protective performance of the coatings is poor. The experimental results also show that when the coating resistance decreased to the range between 105 Ω·cm2
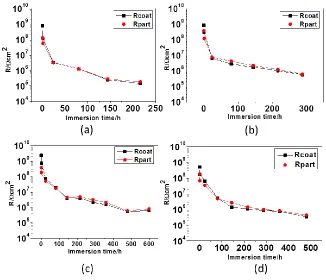
and 106 Ω·cm2, a small amount of macroscopic blisters began to appear in the coating surface. Fig. 8 displays variations of Rcoat and Rpart of sample 5-8 with immersion time. The results
show that the trends of Rpart with time are almost similar to that of Rcoat fitted from all data, especially
during this period from immersion for 24 h to the coating beginning to blister. It shows that Rpart can be
[image:9.596.183.414.218.390.2]
interface, despite of the good appearance of the coating. Sample 7 shows the maximum coating resistance and more durable protection for the substrate.
Figure 8. The variations of Rcoat and Rpart with immersion time for (a) sample 5, (b) sample 6, (c)
sample 7, and (d) sample 8. Rcoat is fitted from all data (100 kHz to 0.01 Hz); Rpart is fitted from
100 kHz to 10 Hz.
Figure 9. The variations of Rcoat and 10Hz with immersion time for (a) sample 5, (b) sample 6, (c)
[image:10.596.137.463.118.398.2] [image:10.596.138.459.475.695.2]
Fig. 9 represents variations of Rcoat and 10Hz of samples 5-8 with immersion time for sample
5-8. The phase angle is based on the following form:
is the current frequency. Rc represents the coating resistance, and Cc is coating capacitance.
In the early stages, the coating is more intact, resulting in the Rc large and Cc very small. And the
changing rate of Rc is verified to be much higher than that of Cc [11], resulting in that the changes of
the coating resistance and the phase angle at a given frequency is similar. However, the changing rate of Cc cannot be negligible later. But in this stage before the coating fails seriously, the trend of both
still tend to be similar, as shown in Fig. 9. From Fig. 9, after immerse for some time, Rcoat of sample
5-8 decrease to about 106 Ω·cm2, and the 10Hz decreases to the range between 10° and 20°, indicating
the effect of the electrochemical reaction under the coatings.
EIS and SCST show that in the early stage, the electrolyte penetrates into the coating, resulting in a rapid decrease in Rcoat. In the second stage, the coating resistance decreases slowly. According to
the EEC, electrochemical reaction has taken place, but there is still only one capacitive arc in the impedance spectrum. When a diffusion tail or arc starts to be showed in the impedance spectrum, the Rcoat is near 106 Ω·cm2, and the Rpart and 10Hz is close to 106 Ωcm2 and the range of 10°-20°,
respectively. There exists diffusion resistance of corrosion product in the coating body due to the barrier of the flake pigment. Although the appearance of the coating is in good condition, the coating is considered to have electrochemically failed. In the last stage, the apparent diffusion arc or straight line shows in the impedance spectrum. Meanwhile, the coating resistance decreases to the range between 105 Ωcm2 and 106 Ωcm2, and the phase angle at 10 Hz reaches the range between 0 ℃ and 10 ℃. The corrosion reaction is substantially more serious. At this time, the coating surface starts to blister, indicating macroscopic failure. The two different methods for rapidly evaluating the properties of coatings are proved to be consistent, which demonstrated their effectiveness for evaluating the properties of coatings and advantage to the development and application of coating products.
3.4 Comparison of electrochemistry failure time and macroscopic defects of the film
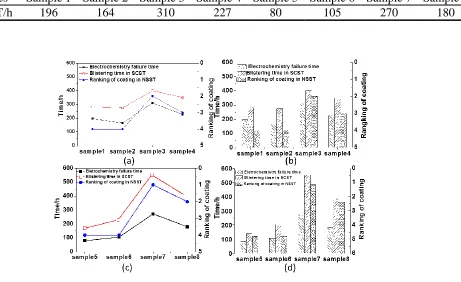
Table 4. the electrochemistry failure time of sample 1-8.
samples Sample 1 Sample 2 Sample 3 Sample 4 Sample 5 Sample 6 Sample 7 Sample 8
the EFT/h 196 164 310 227 80 105 270 180
Figure 10. Comparison of the EFT and macroscopic blistering. The figure respectively shows the electrochemical failure time, blistering time in SCST and the ranking of coatings in NSST.
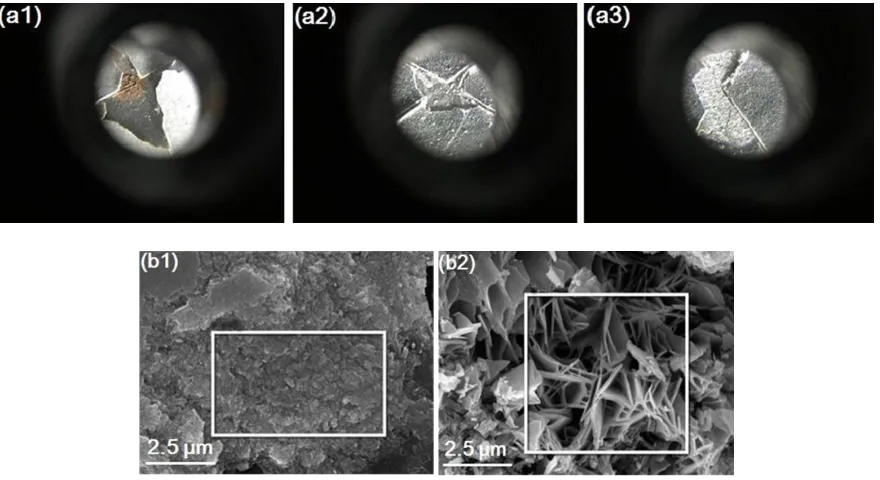
Experiments show that the EFT does not correspond to the appearance of macroscopic defects on the coatings surface. After the electrolyte solution reaches the coating/steel interface and the strong corrosion electrochemical reaction occurs, the adhesion between the coating and the substrate is gradually weakened and the surface exhibits macroscopic blisters finally [22-23]. For example, the morphologies of blisters on the coating surface of sample 7 are shown in Fig. 11.
[image:12.596.83.544.109.391.2]
Figure 11. (a) Optical photos of blisters on the coating surface of sample 7: (a1) and (a2) in NSST; (a3) in SCST; (b) SEM micro morphologies of the rust in the coating/steel interface of sample 7.
The EFT is often less than the time to generate macro-defects, where there is a time interval. The time interval is significantly important for shortening the time of conventional corrosion tests. From Fig. 10, the maximum time interval reduced by about 50%. According to the mechanism analysis of blistering, the adhesion of the coatings has a significant correlation with blistering. Improving the adhesion of coating can enhance the ability to resist stress inside the coating body [28],thus expanding the blistering time of the coatings and the time interval. For example, in Fig. 10 and Table 4, sample 7 and 8 have better adhesion and greater the time interval. The above results show that the use of the EFT can significantly shorten the test time. Note that in this experiment, the defined EFT depends on the appearance of the diffusion arc at the low frequency region in the impedance diagrams due to the effects of corrosion products. However, it may not be suitable for other anticorrosive coatings with sacrificial-to-barrier protection mechanism since the second arc appears in the impedance spectrum at the early stage [29], which enables us to redefine the electrochemical failure time, taking the specific failure mechanism into consideration. More work about waterborne coatings with other pigments is in progress.
As we know, some electrochemical parameters have been proposed to evaluate the properties of coatings, such as fb, 10Hz, etc. But for a specific coating, whether these methods have a consistent
[image:13.596.80.520.69.309.2]
links between EIS and conventional corrosion tests. Historically, the focus of associating the EIS with conventional corrosion tests was to establish a link between the rank based on impedance data and the classification determined visually [8].
4. CONCLUSIONS
The good comprehensive performance of the paint is obtained when the 600-mesh-sized MIO is used and the PVC is 39% by EIS and general performance test.
The electrochemical behavior of waterborne epoxy micaceous iron oxide paint shows that the coating resistance first decreases rapidly, and then declines slowly until the coating failed. The two methods for quickly evaluating properties of coatings are consistent, reflecting both the changes of coatings performance and their relationship with coating properties. Both the variations of the partial fitting coating resistance and the phase angle at 10 Hz are almost identical with the variation of the coating resistance. The decrease of Rpart to 106 Ω·cm2 and the decline of 10Hz to the range of 10°-20°
indicate the strong corrosion reactions occur in the steel/coating interface and the diffusion behaves obviously.
Using the defined EFT can obviously shorten the conventional corrosion test cycle, which is expected to be used in product development. Improving the adhesion of coatings on steel substrates may enhance the ability to resist the stress inside the coatings body, thereby extending the time interval and drastically shortening the characterization time compared with the conventional corrosion test.
ACKNOWLEDGEMENTS
The authors would like to acknowledge the Science and Technology Projects of Guangdong, China (Grant No. 2013B090600056).
References
1. Y. F. Zhu, J. P. Xiong, Y. M. Tang, and Y. Zuo. Prog. Org. Coat., 69 (2010) 7. 2. Y. Cubides and H. Castaneda. Corros. Sci., 109 (2016) 145.
3. S. Skale, V. Dolecek and M. Slemnik, Prog. Org. Coat., 62 (2008) 387. 4. X.M. Li, B. Faber, B. Minch and H. Castaneda, Corrosion, 70 (2014) 615. 5. M. Mahdavian and M. M. Attar, Corros Sci., 48 (2006) 4152.
6. I. Sekine, K. Sakaguchi and M. Yuasa, J. Coat. Technol., 45 (1992) 64. 7. F. Mansfeld. J. Appl. Electrochem., 25 (1995) 187.
8. F. Mansfeld and C. H. Tsai, Corrosion, 49 (1991) 958.
9. A. T. Xu, F. Zhang and F. Jin, Int. J. Electrochem. Sci., 9 (2014) 5116. 10.X Li and H Castaneda, Corros. Eng. Sci. Techn., 50 (2015) 218. 11.C. N. Su, W. Wu, Z. P. Li and Y. Guo, Corros. Sci., 99 (2015) 42.
12.F. Mahdavi, Mike Y.J. Tan and M. Forsyth, Prog. Org. Coat., 88 (2015) 23. 13.C. Yu, P. Wang and X. H. Gao, Int. J. Electrochem. Sci., 10 (2015) 538.
17.Y. J. Zheng, Z. C. Liu, Powder Technol., 207 (2011) 335.
18.P. Kalenda, A. Kalendová, V. Štengl, P. Antoš, J. Šubrt, Z. Kváa, S. Bakardjieva, Prog. Org. Coat., 49 (2004) 137.
19.B. Nikravesh, B. Ramezanzadeh, A. A. Sarabi and S. M. Kasiriha, Corros. Sci., 53 (2011) 1592. 20.A. Kalendová, D. Vesely, I. Sapurina and J. Stejskai, Prog. Org. Coat., 63 (2008) 228.
21.J. M. Hu, J. T. Zhang, J. Q. Zhang and C. N. Cao, Corros. Sci., 47 (2005) 2607.
22.J. B. Bajat, I. Milošev, Ž. Jovanović and V. B. Mišković-Stanković, Appl. Surf. Sci., 256 (2010) 3508.
23.P. Calvez, S. Bistac, M. Brogly, J. Richard and D. Verchere, J. Adhesion, 22 (2012) 145. 24.T. Prosek, A. Nazarov, M. G. Olivier, C. Vandermiers, D. Koberg and D. Thierry, Prog. Org.
Coat., 68 (2010) 328.
25.Y. L. Huang, X. M. Yu and W. J. Qu, Int. J. Electrochem. Sci., 9 (2014) 185. 26.C. H. Hare, J. Prot. Coat. Lin., 3 (1998) 17.
27.K. R. Gowers and J. D. Scantlebury, Corros. Sci., 23 (1983) 935. 28.P. Araujo, D. Chicot, M. Staia, and J. Lesage, Surf. Eng. 21 (2005) 35. 29.K. Schaefer, and A. Miszczyk, Corros. Sci., 66 (2013) 380.