Int. J. Electrochem. Sci., 12 (2017) 1232 – 1246, doi: 10.20964/2017.02.13
International Journal of
ELECTROCHEMICAL
SCIENCE
www.electrochemsci.org
Electrochemical Corrosion and Mathematical Model of Cold
Spray Copper Composite Coating - Part II: Limiting Current
Region
Ding Rui1,, Yu Haibin1*, Li Xiangbo2
1
Ningbo Institute of Industrial Technology, Chinese Academy of Science, Ningbo 315201, China 2
Science and Technology on Marine Corrosion and Protection Laboratory, Luoyang Ship Material Research Institute(LSRMI), Qingdao 266101, China;
*
E-mail: dmoyuyang@foxmail.com
Received: 18 October 2016 / Accepted: 2 December 2016 / Published: 30 December 2016
In this paper, composite coating was prepared by cold spray technique and the corrosion behavior of the coating in solution was studied using rotating ring-disk electrode. Experiments were designed to investigate the influences of rotation rate, chloride ion concentration, solution temperature and content on the polarization behavior of the coating. The results shown that under strong convection and high temperature conditions, the cumulative effect of insoluble corrosion product CuCl weakened, corrosion current increased, and current peak disappeared gradually due to enhanced diffusion. Limiting current and rotation rate were in a log-linear relationship. When the chloride ion concentration in the solution increased, large amounts of chlorine ions were complexed with insoluble to generate soluble . So limiting current increased, potential range of limiting current narrowed, and current peak disappeared gradually. Limiting current was also in a log-linear relationship with the concentration. As cathode, particles in the coating promoted the corrosion of copper and the release of dissolved copper, which improved the antifouling efficacy of the coating. Limiting current was controlled by diffusion of , and limiting current generating mechanism was essentially the diffusion-controlled film dissolution mechanism. The mathematical model for limiting current region was built based on the reaction course proposed herein and agreed well with the experimental results, which proved the correctness of the reaction course hypothesis and the mathematical model.
Keywords: Cold spray, Electrochemical polarization, Antifouling, Corrosion, Mathematical model
1. INTRODUCTION
increasingly prominent. To date, the common method for preventing marine biofouling is application of antifouling paints. However, antifouling paints are faced with defects such as undesirable antifouling duration and film strength, while peeling of coating seriously affects the antifouling effect of paints [1-4].
Cold spray is a spraying technique based on the principles of aerodynamics. At lower temperature relative to thermal spraying, powder particles are carried into the convergent-divergent nozzle by high-pressure gas. Particles are accelerated to supersonic state of 300 1200 m/s after passing through the entire nozzle to form gas-solid dual-phase high-velocity particle flow. Particles impact the substrate in solid state, which are deposited on the substrate surface by producing large plastic deformation to form a coating [5-8]. With advantages like high density, high hardness and strong adhesion, application of cold spray coating in the antifouling field can eliminate the easily peeling defect of antifouling paints.
Figure 1. Schematic diagram of Cold Spray
electrochemical polarization behavior of the coating in 3.5% NaCl solution and build a polarization mathematical model of limiting current region based on the already-proposed mechanism.
2. EXPERIMENTAL METHODS
2.1 Preparation of cold spray coating
Coating used in the experiment was prepared by cold spray technique. The process parameters were as follows: spraying temperature of 300 ℃; pressure of 2.8 MPa; and spraying distance of 20 mm. Coating materials were copper and powders, while substrate material was Q235 steel.
Cu particles used in this experiment were metallic yellow quasi-spherical particles. As can be seen from Figure 2, diameter of Cu powders was generally around , with uniform distribution of particle size, smooth surface and good sphericity, which facilitated production of good quality coating as reported in reference 32.
Figure 2. SEM image of (a) Cu powder and (b) Cu2O powder
was dark red powders, which were mostly spherical, with dispersed distribution of particle size ranging from 1 m to 10 m, as shown in Figure 2. However, most of these particles aggregated to form 10 m to 20 m large particles. Reference 32 reported the influence of particle size on the deposition effect. Aggregation of powder particles increased their size above 10 m, which was more conducive to the deposition of particles [2,32].
Coating composed of (mass ratio) was used as the experimental object in all experiments except for the experiment investigating the influence of content in the coating. 2.2 Sample processing
surface was polished on the metallographic polisher sequentially with W5.0 and W2.5 diamond pastes, cleaned with alcohol moistened cotton ball, then dried and sealed for subsequent use.
2.3 Electrochemical testing system
Structure of the rotating ring-disk electrode used in the experiment has shown in reference 9. Experimental material, i.e. cold spray coating, was removable. Rotating ring-disk electrode parameters: disk diameter of 5 mm; ring-disk spacing of 1 mm; ring width of 1 mm; and collection efficiency of 31%.
The schematic diagram of the electrochemical testing system has shown in in reference 9. Rotation rate was controlled with electrode rotator (Princeton, USA). Model
electrochemical workstation (Princeton, USA) was used for polarizing disk electrode, as well as recoding of disk electrode potential and current data. Ring electrode potential was set (at 600 mV for detection of cuprous ions, whereas at for detection of copper ions) with model
potentiostat (Xinrui Instruments Co., Ltd., Shanghai). Model electrochemical workstation (Princeton, USA) was used as the data recording system to record the ring electrode current data. Polarization process was scanned by potentiodynamic method at a rate of 0.333 mV/s.
2.4 Experiment influencing factors
In all the experiments concerning the influences of rotation rate and solution temperature T on the coating polarization, 3.5% NaCl solution was used. Temperature was controlled with constant temperature water bath.
In the experiment investigating the influence of rotation rate, was set at 200, 300, 650, 1300, 1900, 2500 and 3200 (rpm), respectively.
In the experiment investigating the influence of , solutions with concentrations of 0.1, 0.2, 0.5, 1.0, 2.0, 3.0 and 4.0 were used, at controlling temperature of 25 ℃, of 8.0, and rotation rate of 1300 rpm.
2.5 Metallographic experiment and micro-area potential detection
2.6 X-ray diffraction patterns
Phase analysis was performed on the coating before and after polarization using model D8 ADVNCE X-ray diffractometer (Bruker-AXS, Germany). Experimental parameters: diffraction source of Cu target; scanning range of 5-90°; scanning speed of 0.3 s/step; step size of 0.02°; working current of 40 mA; and working voltage of 40 mV.
3. EXPERIMENTAL RESULTS
In our previous study, the typical anodic polarization curve of cold spray copper composite coating was divided into three parts [9]:
(1) Tafel active dissolution region ( );
(2) Peak current and limiting current region 1 ( );
(3) High potential region ( ). High potential region further comprised two parts: (3-1) Current growth region and (3-2) limiting current region 2.
Among them, Tafel active dissolution region has previously been discussed [9]. This paper focuses on the peak current and limiting current region 1, while the high potential region will be discussed in the future work.
3.1 Influence of rotation rate
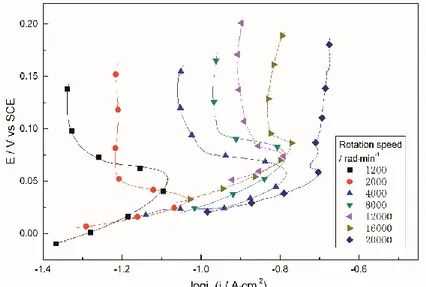
Figure 3 presents the anodic polarization curves of limiting current region 1 at different rotation rate. Current increased with increasing rotation rate. Meanwhile, current peak exhibited a narrowing trend with increasing rotation rate, indicating that at high rotational speeds, diffusion enhanced, and accumulation effect of CuCl weakened. As shown in Figure 4, log-slope between limiting current density and rotation speed was 0.47.
Figure 3. Anodic polarization curves in limiting current region 1 at different rotation rate ( ,
Figure 4. Log-liner relationship between and ( , , )
3.2 Influence of Cl- concentration
Figure 5 shows the polarization curve for limiting current region 1 at different
concentration. Limiting current increased with increasing concentration. In addition, at high chloride ion concentration, potential range of limiting current narrowed, and current peak disappeared gradually. This was because large amounts of were complexed with insoluble to generate soluble , which led to weakened accumulation of . Limiting current and concentration were in a log-linear relation as shown in figure 6, with a slope of 0.886.
Figure 5. Anodic polarization curves in limiting current region 1 at different concentration ( , 8000 rad∙min-1
Figure 6. Log-liner relationship between and concentration ( , 8000 rad∙min-1
, )
3.3 Influence of temperature
Figure 7. Anodic polarization curves of limiting current region 1 at different temperature ( ,
Figure 7 shows the polarization curves for limiting current region 1 at different temperatures, where the limiting current increased with rising temperature. This may be because the rise of temperature accelerated the oxidation reaction of copper, which also increased the diffusion coefficient D and reduced the dynamic viscosity γ of the solution[33]. According to the convection-diffusion transfer flux formula γ for rotating disk electrode derived by Levich [33], with increasing diffusion coefficient D, transfer flux J increased, and limiting diffusion current increased.
In addition, as the temperature rose, current peak first became apparent, and then disappeared gradually. This may be because the adsorption of corrosion product on the electrode surface was an endothermic process. Rise of temperature facilitated the adsorption, and the peak current region which reflected the adsorption process of CuCl was distinct. However, continuous rise of temperature would aggravate the thermal motion and complexation reaction of and to inhibit the adsorption process, so the peak current disappeared gradually.
3.4 Role of Cu2O
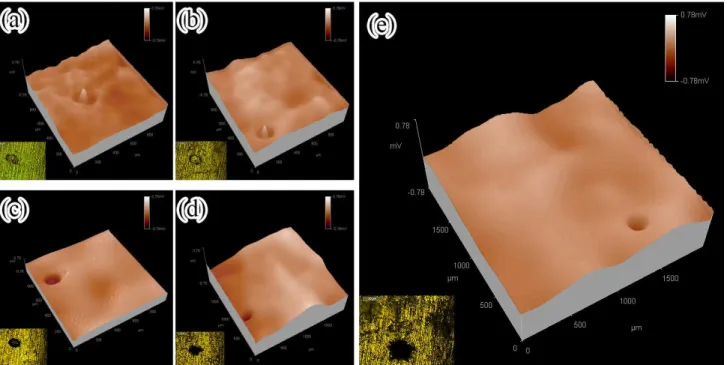
To study the role of in the electrochemical corrosion process of the coating, metallographic picture of particles and surrounding area in the coating immersed in 3.5% NaCl solution for different times were recorded and corresponding potential distributions were detected as shown in figure 8.
In the early stage of immersion, potential particles was high, which acted as cathode. Copper around the particles exhibited an annular low potential region, which existed as anode (Figure 8a). particles formed micro-battery with the surrounding copper to promote the corrosion of the later. With the prolongation of immersion time, peripheral region of particles formed an annular groove due to corrosion of copper and dissolution of cuprous oxide (Figure 8b). Since the copper ions hydrolyzed to form H+, and the anions in the solution migrated into the groove under the action of electric field, the solution within the groove became more corrosive. Hence, grooving corrosion expanded, anode region presented an expanding trend, and potential shifted towards more negative direction (Figure 8c). When immersed for 20 days, pitting corrosion was formed at the original location of particles (Figure 8d) as its exfoliation due to the corrosion of surrounding copper and its dissolution under the action of . There was no longer the presence of cathode region in the potential distribution diagram (Figure 8d). Pits grew with the prolongation of immersion time (Figure 8e). As can be seen from Figure 8e, anode region expanded, and potential shifted to the negative direction.
Figure 8. Metallographic picture and potential distribution of particles in the coating immersed for (a) 1 day, (b) 5 days, (c) 15 days, (d) 20 days, (e) 30 days in 3.5% NaCl solution ( ) 3.5 Reaction mechanism
Electrochemical dissolution of copper and copper alloys in chlorinated solution has been extensively studied [15-31], with development of three different reaction mechanisms and the establishment of corresponding mathematical models for Tafel active dissolution region [19-31]. However, these reaction mechanisms and mathematical models all assumed the charge transfer process to be a quasi-reversible process, which tacitly approved the control step as a diffusion process and thus could not effectively reflect the real situation.
Figure 9 presents the XRD patterns of coating before and after polarization. Corrosion products were mainly and , of which might be generated by oxidization and hydratation of . Hence, we propose the following reaction mechanism.
Figure 10. Schematic of the electrochemical reaction mechanism
When the coating was immersed in seawater, three processes proceeded sequentially on its surface: (A) chloride ion adsorption; (B) parallel competition between anodic dissolution and oxide film formation; and (C) dissolution of oxide film. These three processes are elaborated in detail below.
Process (A):
adsorbed on the coating surface to form the transitional product :
↔
This reaction was a common initial step for the anodic dissolution and oxide film formation in process (B).
Process (B):
Transitional product could proceed different reactions, i.e. different sub-processes: anodic dissolution process (B1) and oxide film formation (B2).
Firstly, could further adsorb and oxidize to convert to a soluble anodic oxidation product, which was precisely the anodic dissolution process (B-1).
↔
↔
Next, transitional product no longer continued to adsorb and could be directly oxidized to insoluble film, which was the oxide film formation process (B-2).
↔
↔
CuCl film further reacted to form Cu2O film.
Anodic dissolution and oxide film formation processes were in a mutually competing, parallel reacting relationship.
Process (C):
Oxide film would also be damaged by and in the solution to produce dissolution:
↔
↔
↔
Which was precisely the dissolution process of oxide film.
3.6 Mathematical model for anodic limiting current region
Table 1. Symbol Description
k4, k-4 Chemical reaction equilibrium constant
r Formation rate or Consumption rate
α Transfer coefficient
n1 Charge number
F Faraday constant
E Electric potential
R Universal gas constant
T Thermodynamic temperature
Vz Normal flow velocity
c Concentration
z Distance from electrode surface
Rotation rate (angular velocity)
γ Dynamic viscosity
D Diffusion coefficient
J Diffusion rate
i Current density
Anode limiting current was generated because at a certain critical current density, CuClads
produced by reaction (A-1) could directly lose electrons in the absence of the action of Cl- to generate CuClads (reaction B2-1). CuClads further formed CuCl film, i.e. reaction (B2-2), while CuCl film hindered the electrochemical reaction and mass transfer process. Dissolution process of CuCl film under the complexation of Cl- was precisely reaction (C-1). Initially, CuCl production rate was greater than the rate of complexation by Cl-, so that CuCl could be effectively accumulated. With increasing amounts of CuCl accumulation, CuCl production rate slowed down to be consistent with the CuCl complexation dissolution rate and the diffusion rate of resulting CuCl2 , so as to establish an equilibrium. Therefore, limiting current was controlled by diffusion process, and the limiting current generating mechanism was essentially the diffusion-controlled film dissolution mechanism.
Based on reaction (C-1), production rate by film dissolution could be obtained. Since CuCl had already formed a layer of film, its concentration was 1:
4 4 2
CuCl k Cl k CuCl
r
2
(1)
Diffusion process of CuCl2 conformed to the convection-diffusion equation:
22Z dz c d D dz dc z
V (2)
In this section, c represented the concentration, while D was the diffusion coefficient of
. z was the vertical distance to the electrode surface; Vz was the velocity of water in the vertical direction on electrode surface; and Vz(z) denoted that the flow velocity was a function of z [33]. was the rotation rate, whereas γ was the dynamic viscosity of solution.
3/2 1/2 2 Z z 0.51 zV [33] (3)
Next, the convection-diffusion equation was solved. Let m dz dc
, the following could be obtained by integrating (2):
z dz V D 1 k m ln z 0 Z
(4)
Equation (4) could be rewritten as an exponential form:
z0
Z zdz
V D 1 exp k dz dc
m (5)
When z = 0, we have:
0 z dz dc k
(6)
By reintegrating equation (5), the following was obtained (for the distinction between the two integrations, z in the first integration was written as y):
z 0 y 0y y dy dz B
V D
1 exp k
c (7)
B was a constant.
Boundary condition 1: When z = ∞, c = 0, then
0 y 0y ydy dz
V D
1 exp k
B (8)
By substituting (8) into (7), complete expression for CuCl2 concentration was obtained:
z 0 0 y 0 y y 0y V y dy dz
D 1 exp k dz dy y V D 1 exp k
c (9)
On the electrode surface (i.e. at z = 0), CuCl2 concentration was:
0 y 0 y 0z V ydy dz
D 1 exp k
c (10)
0 y 0y ydy dz
V D
1
exp (11)
Integral term in the exponential part of (15) was calculated first as follows
y0
y ydy
V (12)
By substituting (3) into (12), the following was obtained:
3 y 51 . 0 dy y 51 . 0 dy y V 3 2 / 1 2 / 3 y 0 2 2 / 1 2 / 3 y 0 y
(13)By substituting (13) into (11), the following was obtained:
0 3 / 1 3 z b 3 / 1 0 3 z b 0 bz z b d e b 1 dz e dze 3 1/3 1/3 (14)
Where D 3 51 . 0 b 2 / 1 2 / 3
. Assuming that x = b1/3z, then equation (14) was written as
0 3 3 / 2 3 x 3 / 1 0 x 3 /1 e x dx
b 3 1 dx e b
1 3 3
(15) Given t = x3, then (15) was written as
6 / 1 2 / 1 3 / 1 3 / 1 0 3 / 2 t 3 /
1 1.62D
3 4 b 1 dt t e b 3
1
(16)Where Γ(x) was the gamma function, Γ(4/3) = 0.8934. Expression of integral form (11) was precisely equation (16), thus
1/3 1/2 1/6 0y
0
y y dy dz 1.62D
V D
1
exp
(17)By substituting (17) into (10), the following was obtained:
6 / 1 2 / 1 3 / 1 0
z 1.62kD
c (18)
Boundary condition 2: When z = 0, CuCl2 diffusion rate CuCl ,z 0
2
J could be described by Fick's first law because of the stiction effect. Moreover, electrode surface normal direction was opposite to the direction of CuCl2 concentration gradient, hence:
Dk dz dc D J 0 z 0 z , CuCl2
(19)
Regardless of whether the reaction was diffusion controlled or electrochemically controlled, in steady equilibrium state, CuCl2 production rate rCuCl2,z0 was equal to the
2
CuCl diffusion rate
0 z , CuCl2
J at z = 0. Besides, the two were opposite in direction. 0 z , CuCl 0 z ,
CuCl2 Dk r 2
J (20)
By substituting (1) into (20), the following was obtained:
k CuCl k Cl k
D 4 2 z 0 4 (21)
6 / 1 2 / 1 3 / 1 4 4 D k 62 . 1 D Cl k k (22)
Current i could be represented by the diffusion rate
0 z , CuCl2
J of CuCl2 at z = 0. Since the anode current direction was consistent with the diffusion direction of CuCl2:
2/3 1/2 1/64 6 / 1 2 / 1 3 / 2 4 0 z 0 z , uCl C 1 D 62 . 0 k D 62 . 0 Cl Fk FDk dz dc FD FJ n i 2 (23) Where n1 was the number of charges (n1 = -1) carried by CuCl2.
As can be seen from the above equation, current i was independent of potential E in the limiting current region, which was evident from various polarization curves. When temperature T rose, diffusion coefficient D and current i increased, which were consistent with the results in Figure 7. In addition, equations (24) and (25) derived from (23) coincided with the results in Figures 4 and 6, respectively.
1Cl log d i log d
(24)
5 . 0 log d i log d
(25)
Therefore, the mathematical model could effectively reflect the electrochemical behavior of coating in the anode limiting current region.
Many researches have been done to studied the electrochemical behavior of copper in NaCl solution, and three different reaction mechanisms and corresponding mathematical models of Tafel region were developed. There are many researches involved the limiting current, and a small number of them proposed the relevant polarization kinetic equations and mathematical models. For example, Moreau [25] and J. Wang [10] studied the electrochemical polarization behavior in limiting current region of copper in stationary seawater and the relevant polarization kinetic equation in stationary seawater environments was proposed:
[ ] (26)
[ ] (27)
Equation 27 is an approximation of equation 23 with the condition of tends to zero, and equation 26 is further approximations of equation 27 when the reaction C-1 is regarded as equilibrium. Therefore, the kinetic equation 23 of the rotating electrode can not only reflect the static solution environment, but also reflect the dynamic solution environment. It is more universal.
4. CONCLUSION
relationship with the Cl- concentration. As cathode, Cu2O particles in the coating promoted the corrosion of copper and the release of dissolved copper, which improved the antifouling efficacy of the coating. Limiting current was controlled by diffusion process of , and the limiting current generating mechanism was essentially the diffusion-controlled film dissolution mechanism. The mathematical model for limiting current region 1 was built based on the reaction course proposed herein agreed well with the experimental results, which proved the correctness of the reaction course hypothesis and the mathematical model.
References
1. R. Ding, X. B. Li, J. Wang and L. K. Xu, Paint Coat. Ind., 44 (2014) 5. 2. R. Ding, X. B. Li, J. Wang and L. K. Xu, Mater. Rev., 26 (2012) 13. 3. R. A. Horne, Syll. Epi. Barc., 577 (1952) 109.
4. S. N. Ma and Z. P. Zhang, Chi. Surf. Eng.,22 (2009) 19.
5. A. P. Alkimov, V. F. Kosarev and A. N. Papyrin, Dokl. Akad. Nauk., 315 (1990) 1062. 6. R. E. Blose and T. J. Roemer, Proc. Int. Therm. Spr. Conf., 1 (2003) 103.
7. J. Karthikeyan and C. M. Kay, Proc. Int. Therm. Spr. Conf., 1 (2003) 117. 8. T. Stoltenhoff, H. Kreye and H. J. Richter, J. Therm. Spr. Tech., 11 (2002) 542. 9. R. Ding, X. B. Li, J. Wang and L. K. Xu, Int. J. Electrochem. Sci., 8 (2013) 5902. 10. R. Ding, X. B. Li, J. Wang and L. K. Xu, Chi. J. Mater. Res., 27 (2013) 212. 11. J. Chen, Z. Qin and D. W. Shoesmith, Corr. Eng. Sci. Tech., 46 (2011) 138. 12. J. E. Lee, H. D. Lee and G. E. Kim, Environ. Eng. Res., 17 (2012) 17. 13. M. M. Antonijevic and M. B. Petrovic, Int. J. Electrochem. Sci., 3 (2008) 1. 14. M. Yeganeh and M. Saremi, Micro. Nano. Lett., 6(2011) 26.
15. D. Digby, S. Sharifi and J. Linder, Meet. Abstr, 2 (2011) 1748. 16. H. P. Lee and K. Nobe, J. Electrochem. Soc., 133 (1986) 2035.
17. X. N. Liao, F. H. Cao, L. Y. Zheng and et al., Corr. Sci., 53 (2011) 3289. 18. M. Braun and K. Nobe, J. Electrochem. Soc., 126 (1979) 1666.
19. G. Bianchi, G. Fiori, P. Longhi and F. Mazza, Corr., 34 (1978) 396. 20. G. Faita, G. Fiori and D. Salvadore, Corr. Sci., 15 (1975) 383.
21. A. L. Bacarella and J. C. Griess, J. Electrochem. Soc., 120 (1973) 459. 22. S. R. de Sanchez and D. J. Schiffrin, Corr. Sci., 22 (1982) 585.
23. W. H. Smyrl, J. Electrochem. Soc., 132 (1985) 1556.
24. C. Deslouis, B. Tribollet, G. Mengoli and M. Musiani, J. App. Electrochem., 18 (1988) 374. 25. A. Moreau, Electrochimica Acta, 26 (1981) 497.
26. B. Tribollet and J. Newman, J. Electrochem. Soc., 131 (1984) 2780.
27. G. Kear, F. C. Walsh, D. B. Barker, K. S. Stokes, Leighton Buzzard, UK (2000). 28. M. E. Walton and P. A. Brook, Corr. Sci., 17 (1977) 317.
29. M. Georgiadou and R. Alkire, J. App. Electrochem., 28 (1998) 127.
30. F. King, M. J. Quin and C. D. Litke, J. Electroanal. Chem., 385 (1995) 45. 31. R.K. Flatt and P.A. Brook, Corr. Sci., 11 (1971) 185.
32. Schmidt T, Gartner F and Assadi H, Acta. Mater., 54 (2005) 729. 33. V. G. Levich and C. W.Tobias, J. Electrochem. Soc., 110 (1963) 251.