Int. J. Electrochem. Sci., 14 (2019) 7270 – 7280, doi: 10.20964/2019.08.92
International Journal of
ELECTROCHEMICAL
SCIENCE
www.electrochemsci.org
Short Communication
One-Step Synthesis of Anatase Nanocrystalline TiO
2at a Low
Temperature for High Photocatalytic Performance
Wei Chao 1,2, Ying Pengzhan 3,*, Qiang Yinghuai 3,*, Xia Qingrui 3, Gu Xiuquan 3
1 School of Chemical Engineering, China University of Mining and Technology, No1, Daxue Road,
Xuzhou, 221116, China
2 College of Xuhai, China University of Mining and Technology, No1, Jinshan Road, Xuzhou, 221008,
China
3 School of Materials Science and Engineering, China University of Mining and Technology, No1,
Daxue Road, Xuzhou, 221116, China
*E-mail: weichaoxh@163.com
Received: 5 April 2019 / Accepted: 11 June 2019 / Published: 30 June 2019
In this study, the titanium dioxide is prepared at 353 K in one hour using a one-step method. The titanium dioxide prepared using this method consists of anatase clusters with sizes of approximately 5 nm. We find that it has a specific surface area of 504 m²/g, the average pore diameter of a stacking hole was 71 Å, and the band gaps were approximately 3.25 eV. The photocatalytic activity and stability of the titanium dioxide prepared using this method on methyl orange and rhodamine B was as good as that of P25. This method may have a grander prospect for the industrial production of the photocatalyst due to its property of convenience and energy-saving.
Keywords: one-step; anatase titanium dioxide; low temperature; nanocrystalline materials
1. INTRODUCTION
Since the photocatalytic water splitting reaction was discovered by Fujishima and Honda nearly 40 years ago, TiO2 is an important semiconductor oxide with commercially exploitable physical and
chemical properties [1, 2]. Titanium dioxide has three different crystalline structures, including anatase, rutile and brookite, among which anatase titanium dioxide has high photocatalytic activity. In most situations, when the particle size is reduced greatly, especially to several nanometer scale, the surface-to-volume ratio increases, which improve their catalytic properties. Therefore, tremendous interest has been shown in studies of preparation of anatase titanium dioxide nanomaterials for photocatalytic applications.
into three categories, which includes a solid-phase method, a gas-phase method and a liquid-phase method. The liquid-phase method is the most commonly used method[3-5]. The general preparation process of anatase titanium dioxide nanomaterials is complex, as the process is complicated and control is difficult. Also, there are numerous influencing factors in the gas-phase, the solid-phase, or the liquid-phase methods. The titanium source used in the preparation process is unstable and readily hydrolysed, and the preparation conditions are harsh[6-9]. Moreover, the preparation temperature is above the boiling point of water[10]. The synthesis always involves calcination to cause secondary agglomeration of the particles.
In this study, a one-step preparation method for nano-titanium dioxide production is proposed. This process does not need a high temperature and extra calcination, which means it is more feasible — the proposed process results in titanium dioxide that has excellent photocatalytic properties.
2. MATERIALS AND METHODS 2.1 Materials
Ethylene glycol (C2H6O2, 99%) and tetrabutyl titanate (C16H36O4Ti, 99.0%) were purchased from
the Shanghai Aladdin Biochemical Technology Co.Ltd. Ammonium sulfate [(NH4)2SO4, 99.0%],
ammonium hydroxide (NH4OH, 25%-28%), sodium sulfate (Na2SO4, 99%) and sulfuric acid (H2SO4,
95.0%-98.0%) were obtained from the Sinopharm Chemical Reagent Co.Ltd. P25 titanium dioxide was purchased from Germany Degussa Company. Methyl orange and rhodamine B were obtained from Tianjin Chemical Reagent Research Institute Co. Ltd.
2.2 Material Preparation
A mixture of 1 mL of tetrabutyl titanate and 10 mL of ethylene glycol was prepared. Before the mixture dissolves in 200 mL of 0.1 mol/L sulfuric acid containing 7.0 g of ammonium sulfate, the mixture needs to be stirred for 20 min. At last, The stirred-mixture should be kept in a water bath at 353 K for one hour. The resultant white slurry was centrifuged, adjusted to neutral with a mixture of ammonium hydroxide and deionized (DI) water (1:1 by volume). Subsequently, rinsed by DI and dried at 333 K for two hours in a vacuum.
In this synthesis process, ethylene glycol was used as the complexing agent, a dilute sulfuric acid solution was the solvent, tetrabutyl titanate was the titanium source, and ammonium sulfate was the dispersant.
2.3 Photocatalytic Activity
experiments were performed in an internal photochemical reactor containing an 80 W UV lamp. During the illumination, taking 5.0 mL of reactants from the reaction solution every 5-10 min to keep the concentration of the remaining methyl orange. The reactants were then separated from the catalyst using a centrifuge. The degraded solution was then separated from the samples using a centrifuge. The whole photodegradation reaction was performed at room temperature with a neutral pH.
2.4 Photoelectrochemical tests
Photoelectrochemical tests were performed on CHI 760E electrochemical workstation (Chenhua, Shanghai, China) in a three-electrode configuration, which consists of a working electrode, a Pt counter electrode and reference electrode. 0.5 mol/L sodium sulfate solution was used as the electrolyte; an 85 W full spectrum Xenon lamp was used as the light source. The working electrode was prepared as follows: The F-doped SnO2 coated glass was placed vertically in the prepared solution and kept in a
water bath at 353 K for one hour. The prepared electrodes were cleaned and dried at 333 K for two hours in a vacuum.
2.5 Characterization
X-ray diffraction (XRD) was performed on the Bruker X-Ray Diffraction device (Model D8 ADVANCE) with Cu Kα radiation from 10 to 80 at a scanning speed of 2.4 min-1. The X-ray tube voltage and current were set at 45 kV and 40 mA, respectively. The morphology and chemical composition of the sample was examined by transmission electron microscopy (TEM, FEI Tecnai F20, 120 kV), selected area electron diffraction (SAED), high-resolution transmission electron microscopy, and energy dispersive X-ray spectroscopy (HRTEM/EDX, FEI Tecnai G2 30, 300 kV). UV-vis diffuse reflectance spectra (DRS) were recorded on a Varian Cary 300 Scan UV-vis-NIR spectrometer with BaSO4 as the background between 250 and 800 nm. The nitrogen adsorption/desorption isotherms of the samples were measured on a Micrometrics ASAP 2000 system at 77 K. Before the measurements, the samples were degassed at 353 K overnight. X-ray photoelectron spectroscopy (XPS) of these materials was recorded in a Thermo Fisher ESCALAB 250 xi, England, using Al Kα radiation (1486.6 eV). Binding energies were calculated concerning C 1s at 284.8 eV. Binding energies were measured with a precision of ±0.05 eV. The photoluminescence (PL) spectrum was conducted on a Varian Cary 3000. Raman spectra were measured by a Bruker Raman Spectroscopy Senterra that employed a 532 nm laser beam and a CCD detector at a resolution of 9 cm-1.
3. RESULTS AND DISCUSSION
3.1 Phase Composition of TiO2
The X-ray diffraction patterns of TiO2 are shown in Figure 1(a). The sample shows characteristic
(004), (200), (105), (211), and (213) crystal planes (JCPDS 21-1272),respectively. The diffraction peaks of the sample indicate that the crystal grains are nanocrystalline, or partially amorphous of TiO2.
Figure 1(b) shows the Raman spectrum taken of the TiO2 prepared by the proposed method. The
TiO2 exhibit a similar feature, with four Raman peaks at approximately 155 (Eg), 409 (B1g), 514
(A1g+B1g), and 637 (A1g) cm-1, corresponding to the Raman fundamental modes of the anatase phase,
respectively. Compared with the standard Raman peaks of the anatase phase, the peaks of 155 and 409 cm-1 shift to a high wavenumber[11]. The result may be due to the smaller particle size of TiO2 and the
weaker surface atoms due to a lack of adjacent atoms, or the existence of an amorphous phase.
Figure 1. XRD patterns (a) and Raman spectrum (b) of TiO2 prepared using this method.
3.2 Microstructure of TiO2
[image:4.596.103.480.227.371.2] [image:4.596.136.456.451.739.2]
Figure 3. Nitrogen adsorption-desorption isotherms and pore size distributions of the titanium dioxide prepared using this method.
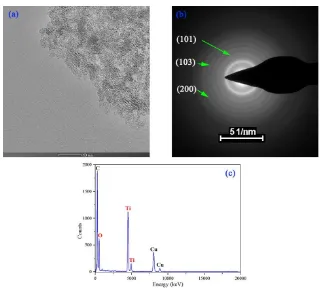
The TEM images (Figure 2a) demonstrate that the sample contains the uniform particles with near-spherical morphologies about 5 nm. The examination of the SAED (Figure 2(b)) shows that the image consists of a series of diffraction rings. The appearance of the diffraction rings indicates that the sample is polycrystalline and has a high degree of crystallinity. The broadening of the diffraction rings indicates that the sample is dominated by nanocrystals. The sample contains only two elements of titanium and oxygen according to the results of EDS(Figure 2c). Measurements and calculations show that the sizes of the diffraction rings are 3.502, 2.443, 1.851 nm, which is consistent with that of anatase titanium dioxide (101), (103), (200) — those facets with the results of XRD.
Figure 3 shows the pore size distribution curve calculated from the desorption branch of the nitrogen isotherm by the BJH method and the corresponding nitrogen adsorption-desorption isotherms of the sample. The adsorption and desorption curves have obvious hysteresis loops and belong to the typical IV curve defined by the IUPAC, indicating that the sample may consist of mesoporous materials according to the nitrogen adsorption curve. The specific surface area is 504 m²/g, and the pore of average is 71.0 Å. According to the TEM images, it can be contributed to the mesoporous structure obtained from the titanium dioxide is the aggregation of titanium dioxide clusters.
3.3 XPS
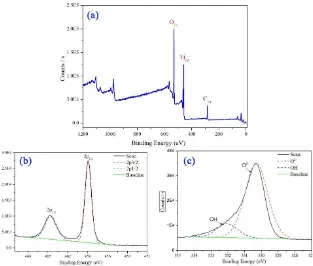
The typical survey and high-resolution spectra are shown in Figures 4. The survey spectra of the sample contain the O 1s, C 1s, and Ti 2p peaks of TiO2. However, the source of the carbon element
[image:5.596.169.429.72.264.2]
Figure 4. XPS survey AlKα photoelectron spectra (a), high-resolution XPS spectra of the Ti 2p peaks (b), and O 1s peaks (c) of the titanium dioxide prepared using this method.
The O 1s signal for the TiO2 particles is shown in Figure 4c, indicating a peak at 530.30 eV
assigned to O2-. Also, there is a shoulder located toward the side of the higher binding energies. The curve resolved O 1s signal of the titanium dioxide prepared using this method results in a second peak located at a binding energy of 532.05 eV. This secondary peak is attributable to OH species on the surface. In additions, the difference between the binding energies of the attributable hydroxyl (OH) and oxide (O2-) species was 1.75 eV, which is close to the reported value of 1.8 eV[12, 13].
The binding energy difference of 71.4 eV between the observed peak positions of Ti 2p3/2 and O 1s (oxide) is also in excellent accordance with reported literature values[14, 15].
3.4 UV–vis Diffuse Reflectance Spectrum and Photoluminescence Spectrum
The UV–vis diffuse reflectance spectra of the sample is shown in Figure 5 (a). It is evident that the sample absorbs more light in the range of 350–400 nm, consistent with the absorption range of anatase titanium dioxide. This result indicates that the TiO2 prepared by this method is primarily anatase.
Figure 5. UV–vis absorption spectra (a), transformed diffuse reflectance spectra (b) and fluorescence spectra (c) of the titanium dioxide prepared using this method.
There are three main emission peaks at 392, 407, and 491 nm in Figure 3(c) corresponding to the emission peaks of the semiconductor band gap at 3.16, 3.05, and 2.53 eV, respectively. The emission peak at 392 nm coincides with the intrinsic absorption band gap of TiO2. The emission peak at 407 nm
may originate from the band edge of the free exciton absorption band. The emission peak at 491 nm originates from the transition of the free carrier band[16]. The fluorescence emission peak indicates the recombination probability of photogenerated carriers. When the peak value is high, the recombination probability of photogenerated carriers is high, and the photocatalytic activity decreases. Figure 5(c) shows that the peak value of TiO2 prepared by this method is slightly higher than the P25. At the same
time, the recombination probability of photogenerated carriers is slightly higher than the P25.
3.5 Photocatalytic Activity
Figure 6a shows a decrease in the concentration of methyl orange both in the presence of the sample and P25 under light irradiation. The adsorption capacity of TiO2 prepared by this method was
slightly higher than that of P25 due to its high specific area. The self-degradation of methyl orange was not obvious, which indicates that the stabilization of methyl orange is reliable under UV light irradiation. However, in the presence of the various photocatalysts, there was an excess of 95% degradation of the methyl orange after irradiation of the sample and P25 for 30 min. The photocatalytic activity of TiO2
prepared by this method was as good as that of P25. TiO2 had a large surface area, a certain amount of
stacking holes, and the grain size was approximately 5.0 nm. Also, the structure of TiO2 prepared by this
[image:7.596.117.482.71.340.2]
had an excellent photocatalytic ability. Rhodamine B is a cationic dye, and methyl orange is an anionic dye. Figure 6 (b) shows rhodamine B was used as a degradation agent to test the degradation ability of the two materials for cationic dyes. The degradation curve shows that the degradation ability for cationic dyes of TiO2 using this method was slightly higher than that of P25. Compared with the results of other
[image:8.596.78.519.206.539.2]researchers (Table 1), the titanium dioxide prepared using this method has excellent photocatalytic performance.
Figure 6. The photocatalytic degradation of methyl orange (a) and rhodamine B (b) in the presence of TiO2 prepared using this method and P25 under UV light irradiation; Cyclic degradation curves
(c) of TiO2 prepared using this method and P25 for the degradation of methyl orange.
Table 1. Photocatalytic degradation of pollutants in presence of TiO2
Catalyst Pollutants Time Degradation
Efficiency References
P-25 (1g/L) Phenol
aqueous(0.21mM) 60 min 80%
Gorska et al.[17] TiO2 (1g/L) Phenol
[image:8.596.66.530.660.747.2]
Fe-doped TiO2
(0.5g/L)
Phenol
aqueous(0.35mM) 480min 70%
Naeem et al[18] P-25 (1g/L) Bromothymol
Blue(0.25mM) 60min 90%
Haque et al[19] TiO2 (0.1g/L) Rhodamine B(10mg/L) 60min 80% Qin et al.[20]
TiO2 (1g/L) Fast Green(0.31mM) 60min 85% Saquib et
al.[21]
Recycle experiments were conducted under UV light, which is to investigate the recycle rate of TiO2 prepared using this method and P25, respectively, and the results are shown in Figure 4 (c). The stability of P25 was slightly higher after three degradations than that of TiO2 prepared using this method.
[image:9.596.71.529.70.178.2]3.6 Photoelectrochemical properties
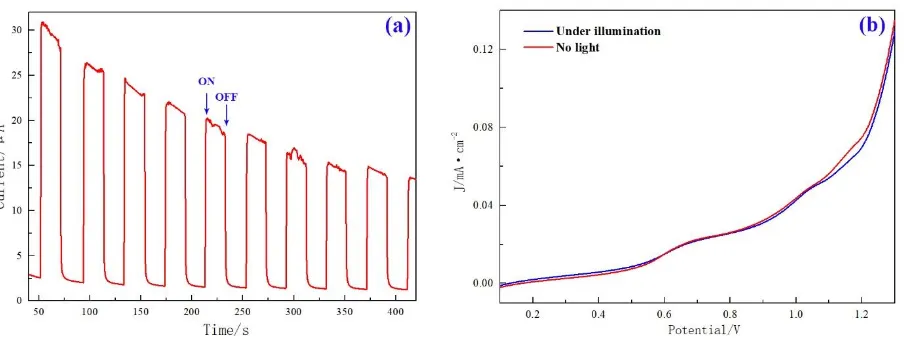
Figure 7. Photocurrent curves of TiO2 thin films prepared using this method (a) and I-V curves (b).
Figure 7 (a) presents the UV-vis photocurrent of the TiO2 under the irradiation of UV-vis light
and an anodic bias of 1.0 V. It is showing the photocurrent versus time for a TiO2 thin film electrode with a sensitivity of 1e-5 under the light illumination of 75000 Lumen. The reason why the photocurrent
drastically decreased after the beginning of a few seconds of lighting. This phenomenon could be attributed to the recombination of photogenerated carriers. There is no photoelectric reaction under a dark condition, which demonstrates that the wide band gap of TiO2 is too wide for the photoelectrons and holes to transport. However, the vast difference in photocurrent between lighting and dark and the photocurrent became significantly decreased with the cycle-index., which is mainly caused by the detachment of TiO2 film.
As can be seen from the Figure 7 (b), the electric current increases with the increasing of the impressed voltage .when the impressed voltage increase is increased to 1.15V, the current of the TiO2
film increases rapidly. Furthermore, the photocurrent of the nano-TiO2 film rises to 0.132 mA/cm2.
[image:9.596.74.526.315.488.2]
between nano-TiO2 and FTO (conductive glass), which can explain why the low photocurrent occurs.
This experiment also tests the dark current density-voltage curve without illumination to do further research about the effect of calcination on the properties of TiO2 film. The dark current is generated by
the recombination of electrons on the conductive surface of FTO and SO24- in the electrolyte solution;
this is why the beginning of the dark current corresponds to a lower open circuit potential, and the photoelectric conversion efficiency is higher.
4. CONCLUSION
TiO2 prepared by this method consisted of anatase nanocrystals, and this was proven by XRD,
Raman spectrum and TEM. Besides, the specific surface area during a certain amorphous phase was 504 m²/g, and the average pore diameter was 71 Å. The photocatalytic activity and stability of TiO2 prepared
by this method were as good as those of P25. This method produced a high-efficiency nano-anatase titanium dioxide in one-step that had a low temperature, needed only a short time to synthesise, did not involve calcination to avoid secondary agglomeration, and was performed in a high-pressure reactor environment. This method may have a grander prospect for the industrial production of a photocatalyst due to its property of convenience and energy-saving.
ACKNOWLEDGEMENTS
This work was supported by the Natural Science Foundation of the Jiangsu Higher Education Institutions of China. (No. 18KJD430009) and the Innovation Project of the Jiangsu Province.
References
1. A. Fujishima, Electrochemistry, 79 (2011) 759. 2. A. Fujishima and K. Honda, Nature, 238 (1972) 37. 3. U. Diebold, Surf. Sci. Rep., 48 (2003) 53.
4. R. Asahi, T. Morikawa, T. Ohwaki, K. Aoki and Y. Taga, Science, 293 (2001) 269.
5. S. Eslava, M. Mcpartlin, R. I. Thomson, R. J. M. and W. D. S., Inorg. Chem., 49 (2016) 11532. 6. J. Yuan, E. Wang, Y. Chen, W. Yang, J. Yao and Y. Cao, Appl. Surf. Sci., 257 (2011) 7335. 7. H. Zhou, X. P. Zou and Y. R. Zhang, Electrochim. Acta, 192 (2016) 259.
8. Y. Liu, D. Sun, S. Askari, P. Jenish, M. Maciasmontero, S. Mitra, R. Zhang, W. F. Lin, D. Mariotti and P. Maguire, Scientific Reports, 5 (2015) 15765.
9. S. K. Mohapatra, K. S. Raja, V. K. Mahajan and M. Misra, Journal of Physical Chemistry C, 112 (2015) 11007.
10.Y. A. Attia and T. A. Altalhi, Res. Chem. Intermed., 43 (2017) 4051.
11.X. Chen, Y. Luo, A. C. S. Samia and C. Burda, Adv. Funct. Mater., 15 (2010) 41. 12.E. McCafferty and J. P. Wightman, Surface & Interface Analysis, 26 (1998) 549. 13.G. Simmons and B. C. Beard, J. Phys. Chem., 91 (1987) 1143.
14.X. Chen, L. Liu, P. Y. Yu and S. S. Mao, Science, 331 (2011) 746.
15.B. Erdem, R. A. Hunsicker, G. W. Simmons, E. D. Sudol, V. L. Dimonie and M. S. El-Aasser, Langmuir, 17 (2001) 2664.
16.J. Wu, H. C. Shih, W. Wu and C. Chen, J. Cryst. Growth, 281 (2005) 384.
18.K. Naeem and O. Feng, Microporous & Mesoporous Materials, 116 (2009) 378. 19.H. M. M and M. M, Dyes & Pigments, 75 (2007) 443.
20.X. Qin, L. Jing, G. Tian, Y. Qu and Y. Feng, J. Hazard. Mater., 172 (2009) 1168. 21.M. Saquiba, M. A. Tariqa, M. Faisala and M. Muneerb, Desalination, 219 (2008) 301.