Int. J. Electrochem. Sci., 12 (2017) 6445 – 6464, doi: 10.20964/2017.07.66
International Journal of
ELECTROCHEMICAL
SCIENCE
www.electrochemsci.org
Degradation Kinetics of 4-chlorophenol Wastewater and
Toxicity Evolution in the Process of Electrochemical
Reduction-Oxidation Coupling under Three-Electrode Diaphragm System
Dandan Xu1, Yan Wang1, Hui Wang1,*, Zhaoyong Bian2,* 1
College of Environmental Science and Engineering, Beijing Forestry University, Beijing 100083, PR China
2
College of Water Sciences, Beijing Normal University, Beijing 100875, PR China *
E-mail: [email protected], [email protected]
Received: 7 April 2017 / Accepted: 14 May 2017 / Published: 12 June 2017
Electrochemical reduction-oxidation process was used to degrade simulated paper wastewater using three-electrode diaphragm system with Pd-Fe/graphene gas-diffusion cathode. The degradation efficiency and toxicity variation assessment were analyzed during the 4-chlorophenol (4-CP) wastewater degradation process. The 4-CP wastewater was degraded effectively and the removal efficiency of chemical oxygen demand (COD) in simulated paper wastewater was 78.2% (anodic), 80.7% (cathodic 1) and 81% (cathodic 2). The toxicity inhibition effect of two cathodic and anodic almost reached 100%, 100%, and 81.0% at 120 min, respectively. The comparison showed concentration for 50% of maximal effect (EC50) of simulated paper wastewater increased with the raise of EC50 of 4-CP. The elimination of toxicity exhibited a hysteresis effect and a rise tendency within 60 min, which might be attributed to the formation of more toxic intermediates such as benzoquinone. A good kinetics model was used to predict degradation of 4-CP and two possible reaction pathways were proposed, featuring a series of steps including cleavage of C-Cl bond, hydrodechlorination, hydroxyl radical addition and oxidation. The Pd-Fe/graphene gas-diffusion cathode was promising to dechlorination and detoxication of simulated paper wastewater containing 4-CP.
Keywords: simulated paper wastewater;4-chlorophenol; reduction-oxidation process; kinetics; toxicity
1. INTRODUCTION
bleaching process, paper wastewater produces a large number of chlorinated organic compounds, especially the chlorinated phenols, that are the main components of persistent organic pollutants (POPs). The chlorinated phenols compounds include 4-chlorophenol (4-CP), 2,4-dichlorophenol, 2,4,6-trichlorophenol, and pentachlorophenol etc. [2]. Chlorophenols are ubiquitous in various industrial wastewater, such as manufactures of preservatives, pesticides and dyes, and pulp and paper industries [3, 4]. 4-CP has been listed as a priority pollutant due to their teratogenic, carcinogenic, mutagenic, persistence and high toxicity [5-7]. 4-chlorophenol is difficult to the natural- and bio-degradation because of their low water solubility and vapor pressure [8]. As a consequence of its wide usage and negative health impacts, it is necessary to develop efficient method to remove 4-CP simulated paper wastewater.
Various technologies have been mooted to eliminate paper wastewater in recent years. Although biodegradation is eco-efficient and environment friendly, it cannot effectively degrade organic compounds from toxic wastewater [9, 10]. With this context, electrochemical technologies have been regarded as great progress, especially for the treatment of biorefractory substances. The most important advantages of electrochemical methods for the treatment of wastewater are their high efficiency, mild operating condition, ease of automation, versatility, and low cost. The main electrochemical procedures utilize for the remediation of wastewater are electrocoagulation, electro-Fenton, electroreduction, electrochemical oxidation [11]. Electron-Fenton has been widely investigated for organic pollutants elimination in environment due to in-situ production of hydrogen peroxide [12]. Then combining with externally added Fe2+ as catalyst to produce hydroxyl radicals as main oxidizing agent. However, ferrous ions are destroyed easily by hydroxyl radicals and negatively affect the oxidation process [13]. Recently, electrochemical oxidation has been used for removal of organic pollutants, and achieves good results [14]. But it is difficult to achieve complete dechlorination and detoxification in chlorophenol organic compounds treatment process [15]. On the other hand, electrochemical reduction process has effectively decreased the toxicity of chlorinated organic wastewater, but it is incapable to achieve further degradation being applied simultaneously to treat organic intermediate products [16, 17]. In comparison with anodic oxidation, cathodic reduction dechlorination on the cathode surface is usually faster and more cost-effective than that by anodic oxidation [18, 19]. As the unique properties as handling convenience, rapidness, high sensitivity, automatics and low-cost equipment, electrochemical reduction-oxidation process has received increasing attention in the pollutants treatment [20, 21]. There have been many reports regarding the catalyst material on the electrode surface during dechlorination, especially nanostructured Pd, has been found to exhibit excellent catalytic by adsorbing hydrogen to produce a reduction under mild reaction conditions [22]. Furthermore, the present of Fe plays a significant role in the production hydrogen, which might be collected by Pd to form adsorbing hydrogen, and Fe also performs direct reductive dechlorination [23]. The Pd-Fe bimetallic catalyst also allow a lower-cost means of degrading chlorophenols.
environmental protection [25]. Moreover, kinetics study contribute to further understanding the degradation pathway and mechanism toward electrochemical reduction-oxidation of 4-CP. Therefore, degradation pathway, the kinetics and toxicity assessments of simulated paper wastewater containing 4-CP degradation process still deserve to be investigated systematically during electrochemical reduction-oxidation.
The aim of the present study was to provide a thorough investigation of simulated wastewater containing 4-CP electrochemical reduction-oxidation degradation focusing on: (1) to identify degradation efficiency and toxicity change of simulated paper wastewater, (2) to compare toxicity variation between simulated paper wastewater and 4-CP during the electrolysis process, (3) to study the kinetics of 4-CP and propose the possible degradation pathway of 4-CP.
2. MATERIAL AND METHODS
2.1 Simulation of paper wastewater containing 4-CP
Paper wastewater production from pulp and paper plant is generally associated with ketones, acids and chlorinated organic compounds and other aromatic compounds, especially chlorophenols [26]. The present study chose acetovanillone, 4-chlorophenol, 2-methyl acetone, and alanine as pollutant components of simulated paper wastewater. The content of composition in simulated wastewater is showed in Table 1.
Table 1. Composition and content of simulated wastewater
Substance Acetovanillone 4-CP 2-methyl acetone Alanine
Concentration(mg L-1) 126 26.4 23.8 18
2.2 Electrolysis experiments procedures
reactor. The optimal operating parameters were the initial pH value of 7.0, current density of 25 mA cm-2 and reaction time of 120 min according previous study. The initial pH of the solution was adjusted using sodium hydroxide and hydrochloric acid. Before starting electrolysis, hydrogen gas was fed for 5 min with the rate of 25 mL s-1 to keep dissolved gas saturation. Hydrogen gas was then fed into the gas compartment during 0-60 min (electrolysis time), following air.
2.3 Analytical methods 2.3.1 Toxicity measurement
The toxicity testing was evaluated whether the transformation products formed had higher toxicity than the parent compound [28]. The acute toxicity of degradation process was assessed using the luminescent freshwater bacteria, photobacterium phosphoreum. The freeze-dried powders of photobacterium phosphoreum were purchased from the institute of Soil science, Chinese Academy of Sciences (Nanjing, China). The freeze-dried powder was rehydrated using 2 mg 100 ml-1 NaCl before testing. The temperature of test was 20 °C. The values of toxicity were presented as the concentration for 50% of maximal effect (EC50).
When the luminescent bacteria are exposed to toxic substances, the bacterial luciferase is inhibited and light intensity decrease rapidly [29]. The toxicity effects were expressed as EC50 that was the concentration of toxicant corresponding to the inhibition value of 50% at a 15 min of exposure time [30]. The samples for toxicity test were diluted in Milli-Q water to different concentration gradient. The endpoint of toxicity was the measurement of bioluminescence reduction. The toxicity value was calculated by Eq. (1)
(1)
Where I represents the inhibition of the concentrated sample to luminescent bacteria. LBis the
blank luminescent intensity. LS is the samples luminescent intensity.
Concentration addition (CA) is based on the assumption that mixture component have the same sites and similar mode of action. To predict the effect of a mixture of chemicals with same mode of action, the CA model could be written as Eq. (2) [31].
(2)
Where is the concentration Ci expressed as relative proportion of the total
concentration .
2.3.2 Other measurements
The mineralization degree of 4-CP was determined with total organic carbon (TOC) measurements performed by Shimadzu TOC-5000 analyzer. The concentration of chemical oxygen demand (COD) in simulated paper wastewater was measured using COD measuring instrument (Lianhua technology, China) during electrochemical process.
3. RESULT AND DISCUSSION
3.1 Degradation and toxicity analysis of simulated paper wastewater
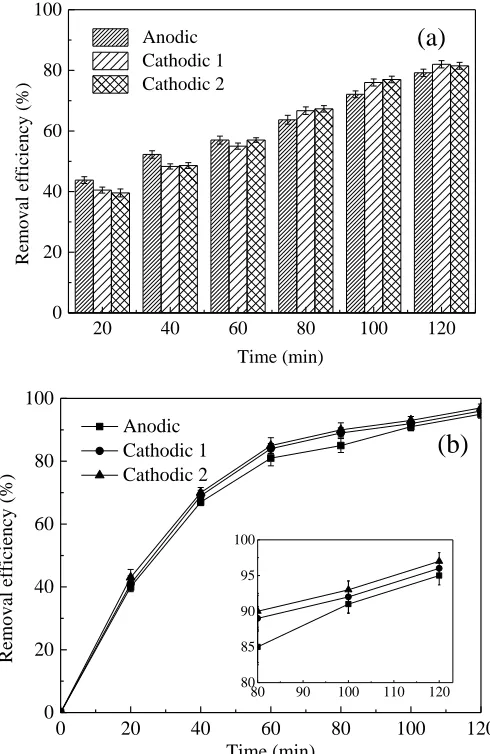
The electrochemical oxidation-reduction degradation of simulated paper wastewater of 4-CP, which was prepared according to section 2.1, was performed using Pd-Fe/graphene cathode and Ti/IrO2/RuO2 anode under optimal conditions. The original COD of simulated paper wastewater was 550 mg L-1. The removal efficiency of COD with reaction time was achieved in different electrode compartments (Fig. 1a).
20 40 60 80 100 120
0 20 40 60 80 100
Remov
al
ef
fic
ie
ncy (%)
Time (min) Anodic
Cathodic 1 Cathodic 2
(a)
0 20 40 60 80 100 120
0 20 40 60 80 100
Remov
al
ef
fic
ie
ncy (%)
Time (min) Anodic
Cathodic 1 Cathodic 2
(b)
80 90 100 110 120
[image:5.596.174.419.330.707.2]80 85 90 95 100
The COD removal increased constantly in two cathodic and anodic compartments with electrolytic reaction process. At 60 min, the removal rate reached about 50%. And the end of the electrolysis reaction, the COD elimination rates in anodic compartment, cathodic compartment 1 and cathodic compartment 2 were 78.2%, 80.7%, and 80.1%, respectively. It proves electrochemical reduction-oxidation process is effective to remove organic matter and reduce the concentration of COD in simulated paper wastewater.
The removal efficiency of 4-CP in simulated paper wastewater was investigated in different electrode compartments and the result is presented in Fig. 1b.
It had high removal efficiency of simulated wastewater containing 4-CP in different electrode compartments. The concentration of 4-CP in simulated paper wastewater decreased with the reaction time, the removal efficiencies of cathodic 1, cathodic 2 and anodic compartment were 96.8%, 96.4% and 95.3% after 120 min, respectively. And degradation efficiency using Pd-Fe/graphene cathode was obviously higher than that using Pd/graphene (89.6%) and Pd/RGO/foam-Ni cathode (95.1%) in the cathodic compartment at 120 min reported by Liu and Wang [20, 32], it proved Pd-Fe/graphene cathode was more suitable and promising to 4-CP degradation. And in the whole electrolysis process, the conversion rate in the cathodic was higher than that of the anodic. It was suggested that during the first 60 min, -Cl was replaced by an active hydrogen species to generate Cl- with hydrogen gas feeding using Pd-Fe/graphene gas diffusion cathode. The catalyst Pd-Fe/graphene was used for the hydrodechlorination of 4-CP. Then the cathodic compartment produced H2O2 as a result of exist of air after 60 min. And H2O2 was decomposed into hydroxyl radial (HO·) and O2-· [20]. The HO··serves strong oxidizing property [33]. The Pd-Fe/graphene catalyst improved reduction ratio of O2 to H2O2 in the air feeding. In anodic compartment, MOx(·OH) or MOx+1 seems to be involved in anodic indirect electrochemical oxidation, but it is difficult to achieve high removal efficiency because of low MOx(·OH) or MOx+1 concentration on the anode [17]. However, the oxidizing ability of H2O2 was strong during oxygen reduction on Pd-Fe/graphene gas diffusion electrode, HO· oxidized organic pollutants to smaller molecule products. The result indicates that Pd-Fe/graphene gas-diffusion cathode has strong electrocatalytic ability for 4-CP in simulation paper wastewater.
As we all known, 4-CP is high toxic substance and has potential risk on aquatic ecosystem. In order to evaluate the main toxic effect of 4-CP to simulated paper wastewater and toxicity pattern of the reaction system, the toxicity changes of simulated paper wastewater and individual 4-CP during electrochemical oxidation-reduction degradation process are compared in Fig. 2. Then the EC50 of initial simulated paper wastewater was 51.0% (Fig. S1).
in two cathodic were approximately 100% at 120 min. It demonstrated that paper wastewater was degraded into lower toxic products in cathodic compartments using Pd-Fe/graphene gas diffusion cathode. The chlorine substituent in the organic compounds contributes to the toxicity of aromatic compound. Therefore, it proves Pd-Fe/graphene gas-diffusion cathode is more suitable to reduction dechlorination and fast oxidation organic pollutant in simulated paper wastewater without high toxic products.
0 20 40 60 80 100 120
0 20 40 60 80 100
EC
50
of paper was
te
wate
r(%)
Time (min)
Anodic (paper) Cathodic 1 (paper) Cathodic 2 (paper)
0.0 0.3 0.6 0.9 1.2 1.5 1.8
Anode (4-CP) Cathodic 1 (4-CP) Cathodic 2 (4-CP)
EC
50
of 4-CP
(mg
·L
-1 )
Figure 2. Evolution of toxicity of simulated paper wastewater (black line) and 4-CP (blue bar) with electrolysis time during electrochemical reduction-oxidation process in terms of percentage and concentration of inhibition of photobacterium phosphoreum after 15 min of exposure in different electrode compartment. Current density: 25 mA cm-2. Electrolyte: 0.03 mol L-1 Na2SO4. Initial pH: 7.0
Moreover, the mixture toxicity of 4-CP degradation process with electrolysis time were also calculated and analyzed. The EC50 of 4-CP at constant time intervals was calculated according the Eq. (2). It decreased from 0.39 mg L-1 to 0.042 mg L-1 within 40 min, the increased inhibitions should be related to the generation of benzoquinone, resulting in the toxicity effect of 4-CP wastewater [35]. The EC50 of 4-CP in cathodic compartments increased constantly in the whole electrochemical degradation process caused by the reduction dechlorination products produced firstly using Pd-Fe/graphene cathode. Furthermore, benzoquinone was not detected in cathodic, and toxicity was decreased with the removal of 4-CP parent molecular. That suggested the cathodic compartments achieved good degradation and detoxification using Pd-Fe/graphene gas-diffusion cathode.
[image:7.596.162.440.194.386.2]
simulated paper wastewater. Thus, it is significant to study the degradation pathways and kinetics of individual 4-CP in electrochemical reduction-oxidation process.
3.2 Degradation pathway of individual 4-CP
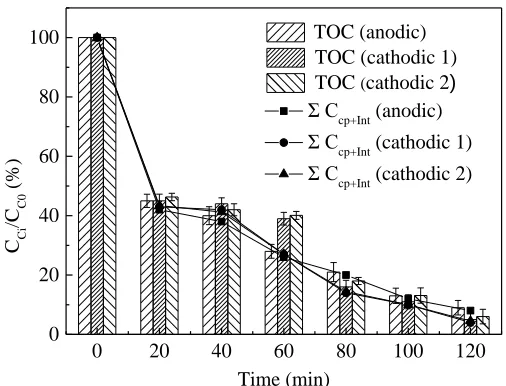
The identification of intermediates from electrochemical reduction oxidation of 4-CP using Pd-Fe/graphene cathode was evaluated by gas chromatography and mass spectrometer. And the concentration of 4-CP and intermediates were determined using HPLC and IC, and the results were shown in the previous reports [34], such as phenol, benzoquinone, hydroquinone, formic acid, acetic acid, succinic acid, and fumaric acid. A comparison of the measured TOC values and bound carbon values calculated from the concentration of the 4-CP and the intermediates (Ccp+Int) with electrolysis time are presented in Fig. 3.
0 20 40 60 80 100 120
0 20 40 60 80 100
C Ci
/C
C0
(%)
Time (min)
TOC (anodic) TOC (cathodic 1)
TOC (cathodic 2)
Σ Ccp+Int (anodic)
Σ Ccp+Int (cathodic 1)
Σ Ccp+Int (cathodic 2)
Figure 3. Concentration variation of TOC (bars) and 4-CP and main intermediates (lines) in two cathodic and anodic compartments using Pd-Fe/graphene cathode at current density of 25 mA cm-2 within 120 min. The solution contained 0.03 mol L-1 Na2SO4 at pH 7.0. Initial concentration of 4-CP: 100 mg L-1
[image:8.596.170.423.300.493.2]
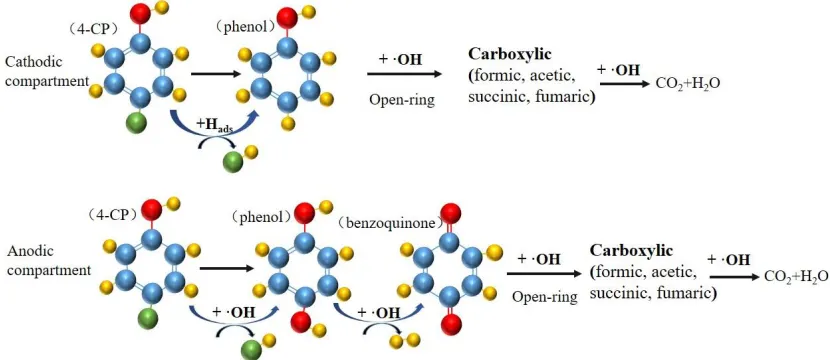
Based on the structure elucidation of degradation products, possible electrochemical degradation pathway of 4-CP under Pd-Fe/graphene gas-diffusion cathode and Ti/IrO2/RuO2 anode was proposed. After considering the experimental results analyzed above, Fig. 4 shows possible reaction pathway for 4-CP degradation.
Figure 4. Proposed degradation pathways for 4-CP in electrochemical reduction-oxidation process in cathodic and anodic compartments using Pd-Fe/graphene gas-diffusion electrode. Current density: 25 mA cm-2. Electrolyte: 0.03 mol L-1 Na2SO4. Initial pH: 7.0
[image:9.596.91.506.158.338.2]
3.3. Kinetics study for 4-CP degradation 3.3.1 Kinetics model
4-CP degradation is dependent on both the process of the electrochemical oxidation and electrochemical reduction. It is necessary to discuss the optimizing design and step in the combined degradation process by means of kinetics model. The 4-CP degradation process showed that it probably proceed through three steps in anodic and cathodic compartment according degradation pathway, respectively. Fig. 5 represents the principal steps of 4-CP degradation on the basis of the main intermediates products. That might exist the electrochemical reduction oxidation of 4-chlorophenol to organic acids through and not through quinonic compounds simultaneously. According to the main reaction pathway of anodic and cathodic compartment, degradation reaction rate constant (K) of chlorophenol, aromatic or phenol and organic acids were obtained.
Figure 5. Principal pathways of 4-CP degradation by electrochemical reduction-oxidation process in cathodic and anodic compartments
The following set of differential equations could be obtained according to the reaction diagram in anodic compartment:
(3) (4) (5)
In the above reaction equations, Ki (i=1, 2, 3) is the apparent rate constant that 4-CP was
degraded into aromatic organic, aromatic organic was degraded into organic acids and organic acids was degraded into CO2 and H2O. Where [RA1] represents the concentration of the 4-CP, [RA2] represents the concentration of aromatic intermediates, [RA3] represents the concentration of the carboxylic acids. The integration constant can be evaluated from the initial condition: At time t = 0, [RA1] = [RA1]0, [RA2] = [RA3] = 0, [RA1]0 represents the initial concentration of 4-CP. The generalized kinetics model according the equations and conditions was given by:
(6)
(7)
(8)
[image:10.596.117.476.303.366.2]
(9) (10) (11)
In the above reaction equations, Ki (i=1, 2, 3) is the apparent rate constant for the combined
process of 4-CP was degraded into phenol, phenol was degraded into organic acids and organic acids was degraded into CO2 and H2O. The integration constants can be evaluated from the initial condition, at time t = 0, [RC1] = [RC1]0, [RC2] = [RC3] = 0, [RC1]0 represents the initial concentration of 4-CP. The generalized kinetics model was given by:
(12)
(13)
(14)
3.3.2 Kinetics of different 4-CP initial concentration
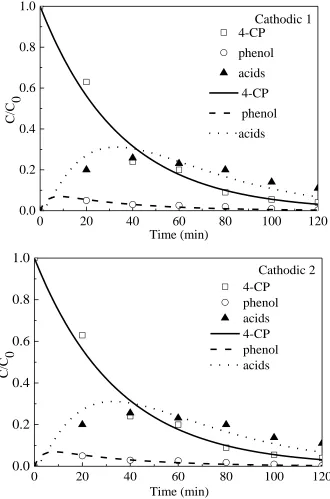
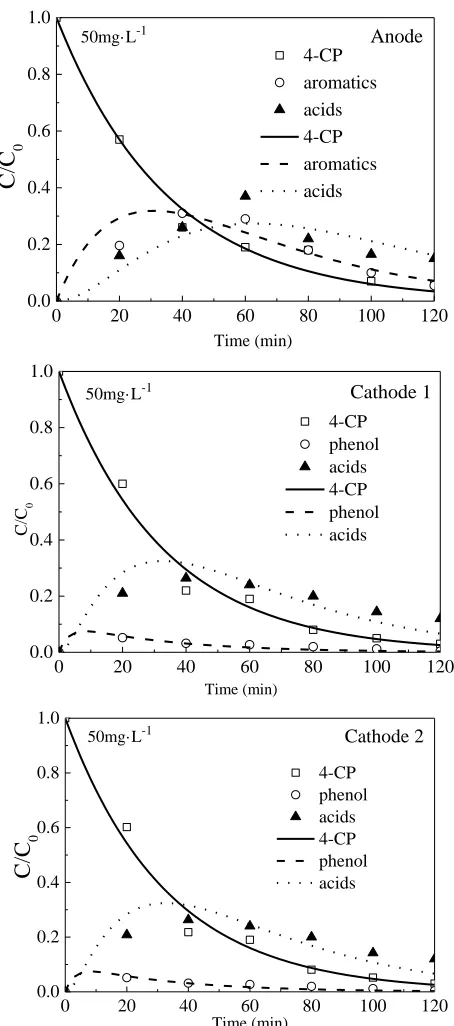
To verify the application of kinetics model, effect of different initial concentration (25 mg L-1, 50 mg L-1, 100 mg L-1, 200 mg L-1, 500 mg L-1) of 4-CP was measured. The fitting degrees for 4-CP, aromatic and carboxylic are showed in Fig. 6 and Fig. S2-S5 in anodic and cathodic compartments for five initial 4-CP concentration. Obviously, it shows well-fitting degree between experiment data and the fitted lines of the kinetics model supports well the proposed degradation model. The symbols represent the experimental data, while the continuous lines represent the calculated curves fitted by the kinetics model that proposed in section 3.1.1. The fitting kinetics equations and correlation coefficients of 4-CP degradation of 100 mg L-1 are shown in Table S1.
0 20 40 60 80 100 120
0.0 0.2 0.4 0.6 0.8 1.0
Anodic
C/C
0
Time (min)
4-CP aromatics acids 4-CP
aromatics
0 20 40 60 80 100 120
0.0 0.2 0.4 0.6 0.8 1.0
Cathodic 1
C/C
0
Time (min)
4-CP
phenol
acids
4-CP
phenol
acids
0 20 40 60 80 100 120
0.0
0.2
0.4
0.6
0.8
1.0
C/C
0
Time (min)
4-CP phenol acids 4-CP phenol acids
Cathodic 2
Figure 6. Experimental data (symbols) and model-fitting (lines) results of 4-CP, aromatics (phenol) and acids with electrolysis time during electrochemical reduction-oxidation process in two cathodic and anodic compartments. Initial concentration of 4-CP: 100 mg L-1. Current density: 25 mA cm-2. Electrolyte: 0.03 mol L-1 Na2SO4. Initial pH: 7.0
[image:12.596.133.463.79.578.2]
Table 2. Apparent kinetics constant K2 value obtained in the fit of the experiments at different initial concentration (25-500 mg L-1) in the cathodic 1, cathodic 2 and anodic compartments
C (mg·L-1) Cathodic 1 Cathodic 2 Anodic
25 0.379 0.381 0.0458
50 0.316 0.318 0.0371
100 0.324 0.328 0.0351
200 0.235 0.235 0.0322
500 0.168 0.169 0.0300
Table 3. Estimate apparent kinetics constant Ki values obtained in the fit of experiments in anodic, cathodic 1 and cathodic 2 compartments with initial concentration of 100 mg L-1 4-CP
Ki Anodic Cathodic 1 Cathodic 2
K1 0.0246 0.0288 0.0289
K2 0.0351 0.324 0.328
K3 0.0342 0.0392 0.0384
[image:13.596.56.543.111.194.2] [image:13.596.85.512.262.326.2][image:14.596.63.538.195.447.2]
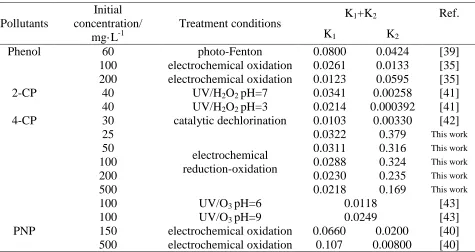
chlorophenol electrochemical reduction oxidation process to that of other processes from literatures was summarized in Table 4. It showed that the 4-CP electrochemical reduction-oxidation was high competitive and promising. Consequently, the electrochemical system both cathodic chambers and anodic could be well used for opening ring to reduce toxicity for degrading 4-CP.
Table 4. Comparison of apparent kinetic rate constants of several treatment processes for degradation of phenols in different initial concentration
Pollutants
Initial concentration/
mg·L-1
Treatment conditions K1+K2 Ref.
K1 K2
Phenol 60 photo-Fenton 0.0800 0.0424 [39]
100 electrochemical oxidation 0.0261 0.0133 [35] 200 electrochemical oxidation 0.0123 0.0595 [35]
2-CP 40 UV/H2O2 pH=7 0.0341 0.00258 [41]
40 UV/H2O2 pH=3 0.0214 0.000392 [41]
4-CP 30 catalytic dechlorination 0.0103 0.00330 [42]
25
electrochemical reduction-oxidation
0.0322 0.379 This work
50 0.0311 0.316 This work
100 0.0288 0.324 This work
200 0.0230 0.235 This work
500 0.0218 0.169 This work
100 UV/O3 pH=6 0.0118 [43]
100 UV/O3 pH=9 0.0249 [43]
PNP 150 electrochemical oxidation 0.0660 0.0200 [40]
500 electrochemical oxidation 0.107 0.00800 [40]
4. CONCLUSION
SUPPLEMENTARY MATERIAL:
40 50 60 70 80 90 100
20 25 30 35 40 45 50 55 60 Rela ti ve lumino si ty (%) Concentration (%) y=-0.58+79.45 R2=0.9679
Fig. S1 Concentration relationship of simulated paper wastewater to inhibition percentage of photobacterium phosphoreum after 15 min of exposure
0 20 40 60 80 100 120
0.0 0.2 0.4 0.6 0.8 1.0 4-CP aromatics acids 4-CP aromatics acids C/C 0 Time (min) Anode 25mg·L-1
0 20 40 60 80 100 120
0.0 0.2 0.4 0.6 0.8 1.0 C/C 0 Time (min) Cathode 1 4-CP phenol acids 4-CP phenol acides 25mg·L-1
0 20 40 60 80 100 120
[image:15.596.177.417.107.290.2]0.0 0.2 0.4 0.6 0.8 1.0 4-CP phenol acids 4-CP phenol acids Cathode 2 C/C 0 Time (min) 25mg·L-1
[image:15.596.64.532.345.686.2]
0 20 40 60 80 100 120
0.0 0.2 0.4 0.6 0.8 1.0
Anode
C/C
0
Time (min) 4-CP aromatics acids 4-CP aromatics acids
50mg·L-1
0 20 40 60 80 100 120
0.0 0.2 0.4 0.6 0.8 1.0
Cathode 1
C/C
0
Time (min)
4-CP phenol acids 4-CP phenol acids 50mg·L-1
0 20 40 60 80 100 120
0.0 0.2 0.4 0.6 0.8 1.0
C/C
0
Time (min)
4-CP phenol acids 4-CP phenol acids
[image:16.596.182.409.73.586.2]Cathode 2 50mg·L-1
0 20 40 60 80 100 120
0.0 0.2 0.4 0.6 0.8 1.0 Anode C/C 0 Time (min) 4-CP aromatics acids 4-CP aromatic acids 200mg·L-1
0 20 40 60 80 100 120
0.0 0.2 0.4 0.6 0.8 1.0 C/C 0 Cathode 1 Time (min) 4-CP phenol acids 4-CP phenol acids 200mg·L-1
0 20 40 60 80 100 120
0.0 0.2 0.4 0.6 0.8 1.0 C/C 0 Time (min) 4-CP phenol acids 4-CP phenol acids
Cathode 2
[image:17.596.69.522.76.422.2]200mg·L-1
Fig. S4 Experimental data (symbols) and model-fitting (lines) results of 4-CP, aromatics (phenol) and acids with electrolysis time during electrochemical reduction-oxidation process in two cathodic and anodic compartments. Initial concentration: 200 mg L-1. Current density: 25 mA cm-2. Electrolyte: 0.03 mol L-1 Na2SO4. Initial pH: 7.0
0 20 40 60 80 100 120
0.0 0.2 0.4 0.6 0.8 1.0 C/C 0 Time (min) 4-CP aromatics acids 4-CP aromatic acids Anode 500mg·L-1
0 20 40 60 80 100 120
0 20 40 60 80 100 120
0.0 0.2 0.4 0.6 0.8 1.0
4-CP phenol acids 4-CP phenol acids
C/C
0
Time (min)
Cathode 2
[image:18.596.179.417.78.257.2]500mg·L-1
Fig. S5 Experimental data (symbols) and model-fitting (lines) results of 4-CP, aromatics (phenol) and acids with electrolysis time during electrochemical reduction-oxidation process in two cathodic and anodic compartments. Initial concentration: 500 mg L-1. Current density: 25 mA cm-2. Electrolyte: 0.03 mol L-1 Na2SO4. Initial pH: 7.0
Table S1. Fitting equations in the kinetics study and values of the correlation coefficient in anodic, cathodic 1 and cathodic 2 compartments with initial concentration of 100 mg L-1 4-CP
Compartment Fitting equation R2
K1 Anodic y=0.8609e-0.024x 0.981
Cathodic 1 y=0.9458e-0.028x 0.982
Cathodic 2 y=0.9449e-0.028x 0.982
K2 Anodic y=4.129(e-0.028x-e-0.035x) 0.994 Cathodic 1 y=0.0975(e-0.031x-e-0.324x) 0.986 Cathodic 2 y=0.0965(e-0.029x-e-0.328x) 0.981 K3 Anodic y=-2.280e-0.019x+1.846e-0.054x-4.122e-0.034x 0.986 Cathodic 1 y=-2.756e-0.031x+0.1130e-0.318x-2.869e-0.099x 0.998 Cathodic 2 y=-3.089e-0.029x+0.1093e-0.328x-3.198e-0.039x 0.998
Table S2 Estimate apparent kinetics constant Ki values obtained in the fit of experiments in anodic, cathodic 1 and cathodic 2 compartments with initial concentration of 25 mg L-1 4-CP
K Anodic Cathodic 1 Cathodic 2
K1 0.0297 0.0322 0.0322
K2 0.0458 0.379 0.381
[image:18.596.94.505.397.600.2] [image:18.596.89.510.667.726.2]
Table S3 Estimate apparent kinetics constant Ki values obtained in the fit of experiments in anodic, cathodic 1 and cathodic 2 compartments with initial concentration of 50 mg L-1 4-CP
K Anodic Cathodic 1 Cathodic 2
K1 0.0285 0.0311 0.0304
K2 0.0371 0.316 0.318
K3 0.0314 0.0380 0.0384
Table S4 Estimate apparent kinetics constant Ki values obtained in the fit of experiments in anodic, cathodic 1 and cathodic 2 compartments with initial concentration of 200 mg L-1 4-CP
K Anodic Cathodic 1 Cathodic 2
K1 0.0246 0.0230 0.0237
K2 0.0322 0.235 0.235
K3 0.0271 0.0340 0.0343
Table S5 Estimate apparent kinetics constant Ki values obtained in the fit of experiments in anodic, cathodic 1 and cathodic 2 compartments with initial concentration of 500 mg L-1 4-CP
K Anodic Cathodic 1 Cathodic 2
K1 0.0224 0.0218 0.0219
K2 0.0300 0.168 0.169
K3 0.0254 0.0314 0.0315
ACKNOWLEDGEMENTS
This work was supported by Beijing Natural Science Foundation (No. 8172035), and the National Natural Science Foundation of China (No. 51278053 and 21373032).
References
1. N. Jaafarzadeh, F. Ghanbari, M. Ahmadi, M. Omidinasab, Chem Eng J, 308 (2017) 142. 2. G. W. Muna, N. Tasheva and G.M. Swain, Environ Sci Technol, 38 (2004) 3674.
3. S. W. Zhou, C. B. Zhang, X. F. Hu, Y. H. Wang, R. Xu, C. H. Xia, H. Zhang, Z. G. Song, Appl Clay Sci, 95 (2014) 275.
4. Y. H. Wang, K. Y. Chan, X.Y. Li, S. K. So, Chemosphere, 65 (2006) 1087. 5. M. Munoz, M. Kaspereit, B. J. M. Etzold, Chem Eng J, 285 (2016) 228.
6. F. Duan, Y. Z. Yang, Y. P. Li, H. B. Cao, Y. Wang, Y. Zhang, J Environ Sci, 26 (2014) 1171. 7. T. Ndlovu and O. A. Arotiba, Int J Electrochem Sci, 10 (2015) 8224.
8. M. P. Titus, V. G. Molina, M. A. Baños, J. Giménez, S. Esplugas, Appl Catal B-Environ, 47 (2004) 29.
9. M. S. Lucas, J. A. Peres, C. Amor, L. Prieto-Rodríguez, M. I. Maldonado, S. Malato, J Hazard Mater, 225–226 (2012) 173.
10.K. Eskelinen, H. Särkkä, T. A. Kurniawan, M. E. T. Sillanpää, Desalination, 255 (2010) 179. 11.C. A. Martínez-Huitle, M. A. Rodrigo, I. Sirés, O. Scialdone, Chem Rev, 115 (2015) 13362. 12.T. X. H. Le, M. Bechelany, S. Lacour, N. Oturan, M. A. Oturan, M. Cretin, Carbon, 94 (2015)
1003.
[image:19.596.86.510.111.170.2] [image:19.596.91.509.223.281.2] [image:19.596.88.510.349.407.2]
14.I. Sirés, E. Brillas, M. Oturan, M. Rodrigo, M. Panizza, Environ Sci Pollut Res, 21 (2014) 8336. 15.H. Olvera-Vargas, N. Oturan, E. Brillas, D. Buisson, G. Esposito, M. A. Oturan, Chemosphere,
117 (2014) 644.
16.G. Chen, Z. Y. Wang and D. G. Xia, Electrochim Acta, 50 (2004) 933.
17.H. Wang, Z.Y. Bian, G. Lu, L. Pang, Z.P. Zeng, D. Z. Sun, Appl Catal B-Environ, 125 (2012) 449. 18.V. Sáez, M. D. E. Vicente, A. J. Frias-Ferrer, P. Bonete, J. Gonzalez-Garcia, Water Res, 43 (2009)
2169.
19.X. H. Mao, A. Ciblak, M. Amire, A. N. Alshawabken, Environ Sci Technol, 45 (2011) 6517. 20.S. L. Liu, H. Wang, Z.Y. Bian, Water Sci Technol, 71 (2015) 22.
21.C. Sun, S. A. Baig, Z. Lou, J. Zhu, Z. X. Wang, X. Li, J. H. Wu, Y. F. Zhang, X. H. Xu, Appl Catal B-Environ, 158-159 (2014) 38.
22.C. B. Molina, A. H. Pizarro, J. A. Casas, J. J. Rodriguez, Appl Catal B-Environ, 148 (2014) 330. 23.H. J. Luo, C. L. Li, C. Q. Wu, W. Zheng, X. Q. Dong, Electrochim Acta, 186 (2015) 486.
24.C. Brinzila, L. Ciríaco, M. J. Pacheco, A. Lopes, R. C. Ciobanu, Adv Eng Forum, 8 (2013) 370. 25.D. Vlastos, M. Antonopoulou and I. Konstantinou, Sci Total Environ, 551-552 (2016) 649. 26.D. Pokhrel and T. Viraraghavan, Sci Total Environ, 333 (2004) 37.
27.X. Z. Song, Q. Shi, H. Wang, S. L. Liu, C. Tai, Z. Y. Bian, Appl Catal B-Environ, 203 (2016) 442. 28.Q. Han, H. J. Wang, W. Y. Dong, T. Z. Liu, Y. L. Yin, H. F. Fan, Chem Eng J, 262 (2015) 34. 29.A. Karci, Chemosphere, 99 (2014) 1.
30.R. Daghrir, A. Dimboukou-Mpira, B. Seyhi, P. Drogui, Sci Total Environ, 490 (2014) 223. 31.M. Faust, R. Altenburger, T. Backhaus, H. Blanck, W. Bödeker, P. Gramatic, V. Hamer, M.
Scholze, M. Vighi, L. H. Grimme, Aquat Toxicol, 63 (2003) 43-63. 32.Y. Liu, L. Liu, J. Shan, J. D. Zhang, J Hazard Mater, 290 (2015) 1.
33.I. Sirés, J. A. Garrido, R. M. Rodríguez, E. Brillas, N. Oturan, M. A. Oturan, Appl Catal B-Environ, 72 (2007) 382.
34.Y. Wang, Q. Shi, H. Wang, Z. Y. Bian, Environ Sci, 37 (2015) 1437 (in Chinese). 35.Z. C. Wu and M. H. Zhou, Environ Sci Technol, 35 (2001) 2698.
36.E. Illés, E. Szabó, E. Takács, L. Wojnárovits, A. Dombi, K. Gajda-Schrantz, Sci Total Environ, 472 (2014) 178.
37.M. M. Zheng, J. G. Bao, P. Liao, K. Wang, S. H. Yuan, M. Tong, H. Y. Long, Chemosphere, 87 (2012) 1097.
38.A. Z. Li, X. Zhao, Y. N. Hou, H. J. Liu, L. Y. Wu, J. H. Qu, Appl Catal B-Environ, 111-112 (2012) 628.
39.F. He, L. C.Lei, J Zhejiang Univ Sci, 5 (2004) 198.
40.M. H. Zhou, Z. C. Wu, X. J. Ma, Y. Q. Cong, Q. Ye, D. H. Wang, Sep Purif Technol, 34 (2004) 81.
41.Y. S. Shen, Y. Ku, K. C. Lee, Water Res, 29 (1995) 907.
42.S. O. Ko, D. H. Lee, Y. H. Kim, Environ Technol, 28 (2007) 583. 43.W. S. Kuo, Chemosphere, 39 (1999) 1853.