functional sites in the artemisinin resistance malaria protein K13
.
White Rose Research Online URL for this paper:
http://eprints.whiterose.ac.uk/149773/
Version: Published Version
Article:
Coppée, Romain, Jeffares, Daniel C orcid.org/0000-0001-7320-0706, Miteva, Maria A et
al. (2 more authors) (2019) Comparative structural and evolutionary analyses predict
functional sites in the artemisinin resistance malaria protein K13. Scientific Reports.
10675. p. 10675. ISSN 2045-2322
https://doi.org/10.1038/s41598-019-47034-6
[email protected]
https://eprints.whiterose.ac.uk/
Reuse
This article is distributed under the terms of the Creative Commons Attribution (CC BY) licence. This licence
allows you to distribute, remix, tweak, and build upon the work, even commercially, as long as you credit the
authors for the original work. More information and the full terms of the licence here:
https://creativecommons.org/licenses/
Takedown
If you consider content in White Rose Research Online to be in breach of UK law, please notify us by
Comparative structural and
evolutionary analyses predict
functional sites in the artemisinin
resistance malaria protein K
Romain Coppée , Daniel C.
Je ares
, Maria A. Miteva , Audrey Sabbagh & Jérôme Clain
Numerous mutations in the Plasmodium falciparum Kelch K protein confer resistance to artemisinin derivatives the current front line antimalarial drugs K is an essential protein that contains BTB and Kelch repeat propeller KREP domains usually found in E ubiquitin ligase complexes that target substrate protein s for ubiquitin dependent degradation K is thought to bind substrate proteins, but its functional/interaction sites and the structural alterations associated with artemisinin resistance mutations remain unknown. Here, we screened for the most evolutionarily conserved sites in the protein structure of K as indicators of structural and or functional constraints We inferred structure-dependent substitution rates at each amino acid site of the highly conserved K protein during the evolution of Apicomplexa parasites. We found two solvent-exposed patches of extraordinarily conserved sites likely involved in protein-protein interactions, one in BTB and the other one in KREP The conserved patch in K KREP overlaps with a shallow pocket that displays a di erential electrostatic surface potential relative to neighboring sites and that is rich in serine and arginine residues. Comparative structural and evolutionary analyses revealed that these properties were also found in the functionally-validated shallow pocket of other KREPs including that of the cancer related KEAP protein Finally molecular dynamics simulations carried out on PfK R T and C Y artemisinin resistance mutant structures revealed some local structural destabilization of KREP but not in its shallow pocket These ndings open new avenues of research on one of the most enigmatic malaria proteins with the utmost clinical importance.
Current eforts to control malaria are threatened by the spread in Southeast Asia (SEA) of Plasmodium falci-parum parasites that are resistant to artemisinin derivatives (ARTs)1. Treatment failures are now reported in some geographic areas of SEA for the current front-line ART-based combination therapies1–3. Artemisinin resistance (ART-R) is deined as parasites exhibiting in vivo a delayed clearance time following an ART-based treatment1 and in vitro an increased survival rate following a brief exposure to a high dose of ART4. his phe-notype is primarily conferred by single non-synonymous mutations in the P. falciparum k13 (pk13, also named
pkelch13) gene5,6. Multiple pk13 ART-R alleles have emerged concomitantly in the early 2000’s7, until a speciic, multidrug-resistant lineage carrying the pk13 C580Y allele spread and nearly reached ixation, especially in the East hailand-Cambodia-Lao PDR-Vietnam region5,7–10.
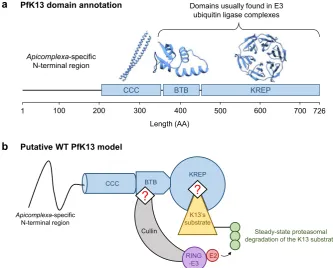
pk13 encodes a 726-amino acid protein (PfK13) consisting of a poorly conserved Apicomplexa-speciic N-terminal region and three annotated, highly conserved domains9 (Fig. 1a): a coiled-coil-containing (CCC; amino acids 212–341), a BTB (Broad-complex, tramtrack and bric-à-brac; also known as BTB/POZ; amino acids 350–437) and a C-terminal Kelch-repeat propeller (KREP; amino acids 443–726) which harbors nearly all pk13
alleles associated with ART-R5,7. Using large scale mutagenesis screens, the k13 gene was reported as essential for the intraerythrocytic growth of both P. falciparum and P. berghei asexual parasites11,12. Removal of PfK13,
Université de Paris UMR MERIT IRD F Paris France Department of Biology and York Biomedical Research Institute University of York Wentworth Way York YO DD UK Université de Paris Inserm U MCTR CiTCom UMR CNRS Paris France Centre National de Référence du Paludisme Hôpital Bichat Claude Bernard Assistance Publique des Hôpitaux de Paris F Paris France Correspondence and requests for materials should be addressed to A S email audrey sabbagh parisdescartes fr or J C email jerome clain parisdescartes fr)
Received: 11 March 2019
Accepted: 3 July 2019
Published: xx xx xxxx
through conditional mislocalization of the protein or diCre-based gene deletion, leads to an arrest at the early intraerythrocytic ring stage followed by a slow transition to condensed parasite forms13. he timing of the growth arrest in PfK13-inactivated parasites is consistent with the ART-R phenotype being expressed at the early ring stage14. In addition, parasites carrying pk13 ART-R mutations exhibit an altered intraerythrocytic cell cycle, with a lengthened ring stage and a shortened trophozoite stage, relative to wild type (WT)15. At the molecular level, naturally-occurring pk13 mutants associate with several key features: an increased expression of unfolded protein response pathways, detected by the in vivo transcriptomics analysis of 1,043 P. falciparum isolates from patients with acute malaria response16; lower levels of ubiquitinated proteins17,18; 2-fold lower abundance of PfK13 protein, as measured by quantitative dimethyl-based proteomics analysis of Cambodian isogenic strains19 (note that a diferent result was reported for two African isogenic strains20); and a basal, constitutive phosphorylation of the parasite eukaryotic initiation factor-2α (eIF2α) at the early intraerythrocytic stage, which controls the repres-sion of general translation and ART-induced latency15,21. Altogether, it seems that the parasite acquires ART-R by altering its cell cycle such as it spends more time at a developmental stage that is less sensitive to ART drugs (early ring), while at the same time mounting a response mitigating ART-induced damages. Some indications of the interactors with PfK13 partially clarify its function. For example, PfK13 was immunoprecipitated with the phosphatidylinositol 3-kinase (PfPI3K), an enzyme producing the lipid phosphatidylinositol 3-phosphate (PI3P) involved in protein export from the P. falciparum endoplasmic reticulum and which cellular levels associate with ART-R17. Ubiquitination of PfPI3K and its subsequent proteasomal degradation are decreased in pk13 mutant parasites. he increased abundance of PfPI3K, and its lipid product PfPI3P, in mutant parasites may inluence host cell remodeling and neutralize ART toxic proteopathy17,20.
These experimental data and the Gene Ontology annotation of PfK13, which contains BTB and KREP domains, are consistent with the hypothesis that PfK13 may function as an E3 ubiquitin ligase substrate adaptor (Fig. 1b)17,21–23. Many BTB- and/or KREP-containing proteins are found in multi-subunit RING-type E3 ligase complexes in which substrate protein(s) will be ubiquitinated24–27. In those complexes, the BTB domain mediates both varying oligomerization architectures and the recruitment of a scafold Cullin protein which interacts with RING E3 protein, whereas the KREP domain serves as a receptor for substrate protein(s) to be ubiquitinated. he E3 ligase activity of RING then catalyzes the transfer of ubiquitin from the ubiquitin-conjugating enzyme
CCC PfK13 domain annotation
1 100 200 300 400 500 600 700 726
BTB KREP
Length (AA)
Domains usually found in E3 ubiquitin ligase complexes
Apicomplexa-specific
N-terminal region
Putative WT PfK13 model
CCC BTB
KREP
Apicomplexa-specific N-terminal region
Cullin
RING -E3
E2 K13’s substrate
Steady-state proteasomal degradation of the K13 substrate
a
b
[image:3.595.154.488.48.316.2]?
?
(E2) to the protein substrate(s)24,28. Some KREP domains contain at their bottom side a shallow pocket involved in the binding of substrate protein(s)24. For example, the shallow pocket of KEAP1 and KLHL3, from the large BTB-Kelch family of proteins, directly binds to the transcription factor Nrf2 and some WNK kinases, respectively, and controls their ubiquitination29,30. Importantly, PfK13 is reported to be the sole BTB-KREP-containing protein in Plasmodium while mammals include ~60 members, each targeting speciic substrate(s)31. herefore, PfK13 may bind several substrates, in addition to PfPI3K.
Although it is expected that PfK13 may act similarly to other BTB-Kelch proteins involved in ubiquitination activities17, the putative binding regions and functionally important sites of PfK13 and the structural alteration(s) associated with PfK13 ART-R mutations remain uncharacterized (Fig. 1b). Because of its high conservation9 and essentiality across Apicomplexa species11–13,32, the function of K13 likely remained unchanged during Apicomplexa evolution. As a consequence, we would expect that amino acid replacements at the functional sites of K13 would be strongly detrimental to protein function, and would be purged by purifying selection. To ind the most con-served amino acid sites of K13, we inferred substitution rates for each amino acid site of the WT K13 sequence from 43 Apicomplexa species, taking into account both the spatial correlation of site-speciic substitution rates in the protein tertiary structure and the species phylogeny33. We identiied in BTB and KREP two solvent-exposed patches of extraordinarily conserved sites, likely involved in protein-protein interactions. As controls, we found similarly evolutionarily conserved and located patches in several BTB- and KREP-containing proteins found in mammals, including KEAP1. Finally, we tested through molecular dynamics simulations whether the R539T and C580Y ART-R mutations in PfK13 altered some structural properties of the KREP domain and its putative binding sites.
Results
K sequence sampling multiple alignment and phylogenetic reconstruction
Forty-threeamino acid sequences from distinct Apicomplexa species were unambiguously identiied as orthologous to PfK13 in sequence databases, encompassing 21 Plasmodium and 22 other Apicomplexa K13 sequences (Cryptosporidia, n = 7; Piroplasmida, n = 7; and Coccidia, n = 8). he length of K13 protein sequences ranged from 506 (Eimeria brunetti) to 820 (Hammondia hammondi) amino acids (Supplementary Table S1). By visual inspection, the three annotated domains of K13 (CCC, BTB and KREP) were very conserved (see the K13 sequence alignment in Supplementary Fig. S1), whereas the N-terminal region preceding the CCC domain appeared much more variable in length and amino acid composition, to a point of not being even detected in databases for many non- Plasmo-dium Apicomplexa species. Since K13 sequences aligned poorly in that region, the irst 234 amino acid positions of the K13 multiple alignment were removed, along with other positions showing a high divergence level and/ or gap enrichment among sequences (32 amino acid positions; Supplementary Fig. S1). he inal K13 multiple sequence alignment contained 514 amino acid positions which covered the whole CCC, BTB and KREP domains. he average pairwise sequence identity in that cleaned K13 sequence alignment was 64.6%, ranging from 48.6% for the Babesia bigemina-Cryptosporidium ubiquitum comparison to 99.2% for the P. chabaudi spp. pair. his is well below the average pairwise sequence conservation found among Plasmodium species (84.9%, with a mini-mum value of 78.3% for the P. vivax-P. chabaudi adami pair).
The maximum-likelihood phylogenetic tree built from the curated alignment of the corresponding
Apicomplexa k13 cDNA sequences revealed four monophyletic groups: Cryptosporidia, Plasmodium, Piroplasmida
and Coccidia, all supported by high bootstrap values (≥98%; Supplementary Fig. S2). he group of Hematozoa k13 sequences appeared as paraphyletic (bootstrap value = 100%), with Piroplasmida unexpectedly clustering with Coccidia (Supplementary Fig. S2). he phylogenetic relationships of Plasmodium k13 sequences were largely consistent with the acknowledged phylogeny of Plasmodium species, except for bird-infecting Plasmodium k13
sequences (P. gallinaceum and P. relictum), which appeared related to human-infecting P. ovale spp. sequences, although this grouping was poorly supported (bootstrap value = 47%; Supplementary Fig. S2).
The k
sequence has evolved under strong purifying selection
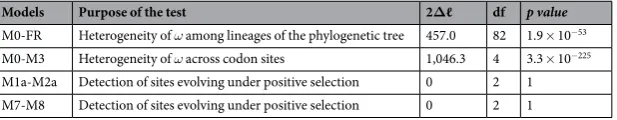
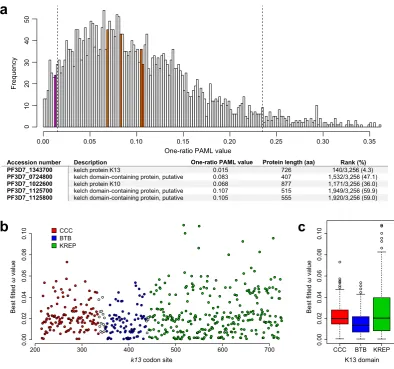
To evaluate the selective pressure acting on k13 which relects its level of conservation during evolution, we used codon substitution models to esti-mate the rate of non-synonymous to synonymous substitutions, ω=dN/dS, across codon sites of the k13 sequence (site models) and branches of the k13 phylogeny (branch models). A series of nested likelihood ratio tests (LRTs) using diferent sets of site and branch models were carried out using the codeml tool from the PAML package34. When applied to the k13 codon alignment, LRTs of codon and branch models indicated varying substitution rates ω both across codon sites of the k13 sequence (M0-M3 comparison, p= 3.3 × 10−225) and among branches of the k13 phylogeny (M0-FR, p= 1.9 × 10−53; Tables 1 and S2). his suggests that k13 has evolved under a variable selective regime both across codon sites and among lineages. No evidence of positive selection was found in any of the tree branches (Supplementary Fig. S3). Similarly, site models incorporating positive selection (M2a and M8) provided no better it to the data than those including only purifying selection and neutral evolution (M1a and M7: 2∆ℓ = 0 in both cases; Table 1), thus supporting an absence of detectable adaptive selection events at any k13 codon site over the long time scale of Apicomplexa evolution. Altogether, the data indicate that much of the K13 protein, except the N-terminal region which was not studied here, has been strongly conserved over evolutionary time.When considering the one-ratio PAML value for 3,256 protein-coding genes previously estimated by Jefares
et al.35 using six Plasmodium species, k13 ranked among the 5% most conserved protein-coding genes of the
proteome (sized-rank: 6/393), whereas four other ive- or six-bladed KREP protein-coding sequences showed much less intense levels of conservation than k13 (Figs. 2a and S5).
Variable levels of amino acid conservation between the annotated domains of K
We thencompared the conservation level between the annotated domains of K13 (CCC, BTB and KREP) using ω esti-mates obtained under the best itted PAML model M3 that indicates a variable selective regime among codon sites (Supplementary Table S2). First, we noted that the three domains have evolved under strong purifying selection with most codon sites being highly conserved during evolution (Fig. 2b). BTB was however found to evolve under more intense purifying selection than either CCC (p= 1.6 × 10⁻⁴, Mann-Whitney U test) or KREP (p= 1.0 × 10⁻³), and no diference in ω estimates was detected between CCC and KREP (p= 0.75; Fig. 2c). To conirm these results, we inferred site-speciic substitution rates at the protein level using the FuncPatch server which considers their spatial correlation in protein tertiary structure (hereater called λ substitution rates)33. λ could not be inferred for the CCC domain because of the lack of a resolved 3D structure. he analysis conirmed that BTB was more conserved than KREP during Apicomplexa evolution (p= 5.4 × 10⁻⁵, Mann Whitney U test).
The BTB domain of K resembles that of KCTD proteins and exhibits a predicted functional patch
We then performed a more extensive study of the BTB and KREP domains of K13 because of their likely role in mediating K13 functions and the availability of their tertiary structures. To detect patches of slowly evolving amino acid sites in the BTB-KREP structure, we focused on the site-speciic substitution rates λ at the amino acid level mentioned above. λ, estimated using FuncPatch, has been shown to provide a more reliable estimation of the conservation level at amino acid sites compared to standard substitution estimates, especially in the case of highly conserved proteins33,36.Although K13 shares similarities with the BTB-Kelch family of proteins that are commonly found in E3 ubiq-uitin ligase complexes5, the BTB domain of K13 exhibited atypical features compared to this protein family. First, the K13 BTB fold appeared shortened, lacking the A6 helix and the N- and C-terminal extensions26 (Fig. 3a), similarly to the Elongin C protein which acts as an E3 ubiquitin ligase adaptor mediating the ubiquitination of substrates37. Second, the primary BTB sequence of K13 grouped with those of the potassium (K+) channel tetramerization domain (KCTD) protein family (Fig. 3b). Finally, the BTB of K13 exhibited a higher similarity in tertiary structure with that of KCTD17 (used as reference for KCTD proteins) compared to those of Elongin C and KEAP1 (the later used as reference for BTB-Kelch proteins): the root-mean-square deviations (RMSDs) of atomic positions for pairs of superimposed BTB domains were 1.13 Ångström (Å) for K13-KCTD17, 2.33 Å for K13-Elongin C and 2.17 Å for K13-KEAP1. In all, these results suggest that K13 BTB is related in sequence and structure to that of KCTD proteins. KCTDs are soluble non-channel proteins containing a BTB domain (but no KREP) involved in variable oligomerization architectures and oten acting as versatile scafold in E3 ubiquitin ligase complexes27.
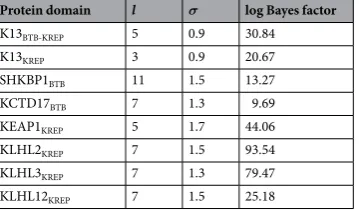
To identify putative functional sites in K13 BTB, we examined whether a spatial correlation of the site-speciic substitution rates λ was present in the K13 BTB-KREP tertiary structure. Despite a low standard deviation of substitution rates across amino acid sites, a signiicant spatial correlation was found (Table 2). he 10% most con-served sites predicted by FuncPatch formed one clearly bounded patch on the BTB surface and consisting of sites located at the B2-B3 and B4-A4 loops and at the A4 helix (positions/residues 355–358/NVGG, 397–399/DRD and 402–403/LF using the PfK13 sequence numbering; Fig. 3c). To test whether a similarly located, conserved patch was also found in the BTB domain of KCTD proteins – to which K13 BTB is the most similar – we inferred site-speciic substitution rates λ from 124 and 139 orthologous sequences of SHKBP1 and KCTD17, acting as E3 ubiquitin ligase adaptors mediating the ubiquitination of substrates27. For both proteins, the 10% most conserved BTB positions formed a patch that partially overlapped with the one of K13, with positions 357 (B2-B3 loop), 397 and 398 (B4-A4 loop) being shared between the three patches (PfK13 sequence numbering; Fig. 3d and Table 2). hese positions are usually involved in BTB-BTB interactions in tetrameric or pentameric states of KCTDs27 or in BTB-Cullin interactions in some other BTB-containing protein families in monomeric or dimeric states26, as in the X-ray structure of the Elongin C-Cullin2 complex (Supplementary Fig. S6)37. his suggests that these K13 BTB sites may be involved in some protein-protein interactions.
The KREP domain of K exhibits a conserved rigid solvent exposed shallow pocket
InKREP-containing proteins, the KREP domain usually serves as the receptor for substrate(s) further ubiquiti-nated24,28. Before examining the conservation level of the K13 KREP domain, we irst re-evaluated its architecture using the resolved 3D structure of PfK13 KREP (PDB code 4YY8, chain A; unpublished results)38. he PfK13
Models Purpose of the test 2∆ℓ df p value
M0-FR Heterogeneity of ω among lineages of the phylogenetic tree 457.0 82 1.9 × 10−53
M0-M3 Heterogeneity of ω across codon sites 1,046.3 4 3.3 × 10−225
[image:5.595.158.467.46.106.2]M1a-M2a Detection of sites evolving under positive selection 0 2 1 M7-M8 Detection of sites evolving under positive selection 0 2 1
KREP structure is composed of six repeats of the kelch motif/blade5,39. As expected, each blade is a β-sheet sec-ondary structure involving four twisted antiparallel β-strands (numbered A to D). he innermost A strands line the central channel of the KREP fold whereas the outermost D strands are part of the KREP outside surface. he top face of the domain, containing the central channel opening, is formed by residues from several strands and from AB and CD loops. Although we cannot exclude that the central channel can carry some functions, it was reported to be mainly a structural consequence of kelch motif assembly40. he bottom face of PfK13 KREP is composed of residues from the DA and BC loops and contains a shallow pocket, similarly to other KREP struc-tures24. Since there is no conventional deinition for the shallow pocket delineation in KREP fold, we deined it as the amino acids forming the surface plan of the pocket and protruding out of the plan (n = 19 positions; Figs. 4a and S7).
To characterize the pattern of conservation within the domain, we superimposed the site-speciic substitution rates λ inferred by FuncPatch onto an amino acid sequence alignment of the six blades (Fig. 4b), custom-produced
One-ratio PAML value
Frequenc
y
0.00 0.05 0.10 0.15 0.20 0.25 0.30 0.35
01
0
20
30
40
50
Accession number Description Rank (%)
PF3D7_1343700 kelch protein K13 0.015 726 140/3,256 (4.3)
PF3D7_0724800 kelch domain-containing protein, putative 0.083 407 1,532/3,256 (47.1) PF3D7_1022600 kelch protein K10 0.068 877 1,171/3,256 (36.0) PF3D7_1125700 kelch domain-containing protein, putative 0.107 515 1,949/3,256 (59.9) PF3D7_1125800 kelch domain-containing protein, putative 0.105 555 1,920/3,256 (59.0)
One-ratio PAML value Protein length (aa)
200 300 400 500 600 700
0.00
0.02
0.04
0.06
0.08
0.10
CCC BTB
0.00
0.02
0.04
0.06
0.08
0.10
Best fitted
ω
value
Best fitted
ω
value
KREP K13 domain k13 codon site
CCC BTB KREP
a
[image:6.595.156.551.45.414.2]b
c
Figure 2. Conservation level of the K13 protein, domains and codon sites. (a) Conservation level of k13
compared to those of all protein-coding genes of Plasmodium. he one-ratio PAML values, calculated for 3,256 orthologous genes among six Plasmodium species (P. falciparum, P. berghei, P. chabaudi, P. vivax, P. yoelii and
from a structural alignment of the six blades using PyMOL (Figs. 4a and S8). We found that: (i) the conservation level signiicantly difered between the six blades (p= 3.0 × 10⁻³, Kruskal-Wallis H test), with blade VI exhibit-ing the lowest level of conservation (Figs. 4b and S9); (ii) loops were surprisingly more conserved than strands (p= 5.0 × 10⁻³, Mann-Whitney U test; Fig. 4b); (iii) the solvent-exposed A and D strands were less conserved
RhoBTB
BTB-ZF BTB-NPH3
MATH-BTB
KCTD
KCNA
Tree scale: 1
BTB-NPH3
BTB-ZF
BTB-Kelch
RhoBTB
MATH-BTB K13
Elongin C
Skp1 KCTD
KCNA
B1 A1 B2 B3 A2 A3 B4 A4 A5 A6 A7 A8
BTB core fold
c
b
d a
10% most conserved sites
(based on λ substitution rates)
10% most conserved sites of K13 BTB
10% most conserved sites of SHKBP1
K13 BTB
SHKBP1 K13 BTB
KCTD17 BTB
10% most conserved sites of KCTD17 BTB K13 BTB
SHKBP1
KCTD17 BTB
N355 G357
G358
D397
R398
D399 L402
**** *** **
N-ter
C-ter C-ter
N-ter
A4 A4
A2 A2
[image:7.595.80.552.48.316.2]A3 A3
Figure 3. Conservation and structure homology of the K13 BTB fold. (a) Linear schematic representation of the BTB fold of some BTB-containing protein families. Yellow arrows and cyan cylinders represent strands and helices, respectively. Stars in magenta correspond to the 10% most conserved K13 BTB amino acid sites (based on the ranking of the λ substitution rates, FuncPatch analysis; Supplementary Dataset S1). Structural elements are labelled. (b) Maximum-likelihood unrooted phylogenetic tree of the BTB core fold using a few reference sequences per BTB-containing protein family. Each BTB-containing protein family forms a monophyletic group, identiied with a colored background. K13 BTB is written in red color and clusters with the KCTD protein family of BTB-containing proteins. (c) Patch of slowly evolving amino acid sites in a three-dimensional view of PfK13 BTB. he amino acid sites are labelled using the PfK13 sequence as reference. (d) Superposition of the BTB fold of K13 with that of two members of the KCTD protein family. he most conserved amino acid sites for each protein was based on FuncPatch analysis and are shown in magenta, orange and red for K13, SHKBP1 and KCTD17, respectively. Other amino acid sites are shown in white, green, and cornlower blue for K13, SHKBP1 and KCTD17, respectively. hree common positions were identiied in the BTB conserved patches of K13, SHKBP1 and KCTD17: 357 on the B2-B3 loop and 397–398 on the B4-A4 loop.
Protein domain l σ log Bayes factor K13BTB-KREP 5 0.9 30.84
K13KREP 3 0.9 20.67
SHKBP1BTB 11 1.5 13.27
KCTD17BTB 7 1.3 9.69
KEAP1KREP 5 1.7 44.06
KLHL2KREP 7 1.5 93.54
KLHL3KREP 7 1.3 79.47
KLHL12KREP 7 1.5 25.18
[image:7.595.159.339.487.592.2]than the buried B and C strands (p= 1.3 × 10⁻⁶, Kruskal-Wallis H test; Fig. 4b); and (iv) the conservation level was the strongest at the blade positions 7–10 (DA loops) and 23–25 (BC loops) (Fig. 4b), which altogether formed the surface and underlying layer of the shallow pocket in the PfK13 KREP tertiary structure (Fig. 4a).
he 10% most conserved of the 284 sites in K13 KREP were all located at the bottom side of the KREP fold, and formed a statistically signiicant patch (Fig. 5a and Table 2). Importantly, the shallow pocket of K13 KREP (19 positions) was signiicantly enriched in the 10% most conserved KREP amino acid sites (p= 1.6 × 10⁻⁵, chi-squared test; Fig. 5a, Tables 3 and S3). Of note, the slowly evolving sites predicted by PAML were scattered and did not form a clearly bounded region at the shallow pocket (p= 0.704, Fisher’s exact test), and mostly cor-responded to the signature residues of KREP proteins (Supplementary Fig. S10). his was somewhat expected since PAML does not consider the statistical information from neighboring sites with similar substitution rates36.
Using the PfK13 KREP structure as reference, we also identiied three remarkable features of the conserved patch predicted by FuncPatch. First, it overlapped with a region of the shallow pocket harboring a slightly
B strands
A strands C strands D strands
A strands B strands C strands D strands 3
Mean
λs
ubstitution rate
2
1
0
A strands B strands C strands D strands
Strands
DA loops
BC loops
AB and CD loops
Side view Bottom view (shallow pocket) Top view (central channel)
Bottom face
Top face II III
IV V VI
I
I II
III
IV
V
VI
Blade
I P L V F C I G GFD G - V - EYL N S M E L L D I S Q Q C W R M C T II - P M S T K K AYF G S A V L N N F L Y V F G GNN Y - D Y K A L F E T E V Y D R L R D V W Y V S S III - N L N I P RRNN C G V T S N G R I Y C I G GYD G - S - SII P N V E A Y D H R M K A W V E V A IV - P L N T P RSSA M C V A F D N K I Y V I G GTN G - - - ERL N S I E V Y E E K M N K W E Q F P V Y A L L E A RSSG A A F N Y L N Q I Y V V G GID N E H - N I L D S V E Q Y Q P F N K R W Q F L N VI - G V P E K KMNF G A A T L S D S Y I I T G GEN G - - - E V L N S C H F F S P D T N E W Q L G P
I - S L L V P RFG H S V L I A N I
- - l - - - r - - - y - -GG- - g - - - l - s - e - y - - - -W -665-710
711-726 AA 443-474 475-522 523-569 570-615 616-664
Blade
I 1 0 1 12 1 0 01 1 1- 2- 21 0 2 11 1 1 11 2 2 22 1 0 11 1 1 II - 1 1 2 11 0 10 1 1 21 2 1 11 1 1 11 1 0 00 0 1- 1 1 00 0 1 11 0 0 00 1 0 11 3 1 33 2 1 III - 2 1 2 21 0 00 1 1 12 2 2 22 1 1 11 1 0 00 0 0- 2- 31 1 1 11 1 1 10 1 0 01 1 1 22 2 1 IV - 1 1 1 21 0 00 1 1 11 2 1 11 2 1 11 1 0 00 1 0- - - 00 0 1 11 0 1 01 2 1 11 1 0 12 1 1 V 21 1 1 11 0 00 0 1 11 2 2 21 1 1 11 1 0 00 1 2 31- 21 1 2 01 0 1 11 1 2 21 2 1 11 1 2 VI - 2 2 2 22 1 10 1 2 22 2 2 21 1 1 11 1 0 00 1 1- - - 21 1 1 11 2 1 12 1 1 21 2 1 23 1 0
I - 2 1 1 21 0 00 0 1 22 2 1 11 523-569
570-615 616-664 665-710 711-726 AA 443-474 475-522
min (λ) median (λ) max (λ)
1 3 5 7 9 11 13 15 17 19 21 23 25 27 29 31 33 35 37 39 41 43 45 47 49 50 Amino acid position in the blade alignment
a
b
[image:8.595.155.547.43.390.2]Shallow pocket
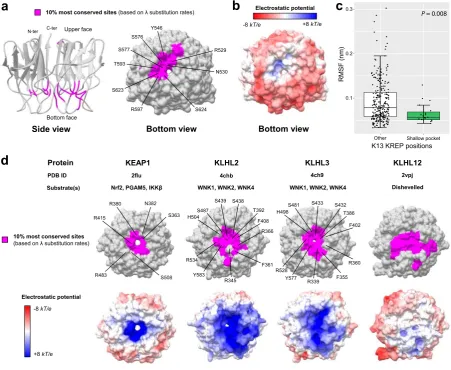
electropositive surface potential, in contrast to the overall electronegative one of the KREP bottom surface (Fig. 5b). Second, it contained several evolutionarily conserved arginine and serine residues (PfK13 R529, S576, S577, R597 and S623; Fig. 5a and Table 3), which are known to mediate protein-protein interactions in the pocket of other KREP domains41,42. And third, the shallow pocket, although being at the domain surface, was more rigid compared to the rest of the KREP structure (p= 8.0 × 10⁻³, Mann-Whitney U test), as measured by the root-mean-square luctuation values (RMSF, which measures to what extent a given residue changes its position over time) during a molecular dynamics simulation of 100 nanosecond (ns) at a temperature of 300 K (Fig. 5c; two other replicates produced similar results, data not shown). Altogether, our analyses of K13 KREP revealed that the shallow pocket is extremely conserved, poorly lexible, and diferentially charged compared to the remaining KREP bottom face.
KEAP1
R415
R483 S508
S363 N382 R380
KLHL2 KLHL3 KLHL12
S487 H504
R534
S438 S439
Y583
T392
F408
R345
F361 R366
S481 H498
R528
S432 S433
Y577
T386
F402
R339 F355
R360 10% most conserved sites
(based on λ substitution rates)
Electrostatic potential
-8kT/e
+8kT/e Substrate(s) Protein
PDB ID 2flu 4chb 4ch9 2vpj
Nrf2, PGAM5, IKKβ WNK1, WNK2, WNK4 WNK1, WNK2, WNK4 Dishevelled
d
10% most conserved sites(based on λ substitution rates) Electrostatic potential
-8kT/e +8kT/e
a
b
Bottom face Upper face N-ter C-ter
Side view Bottom view Bottom view
Y546
R529
N530
S624 S623
R597 T593
S577 S576
c
0.1 0.2 0.3
Other Shallow pocket
RMSF (nm)
P = 0.008
[image:9.595.103.555.48.418.2]K13 KREP positions
Figure 5. Conservation level and electrostatic potential across the KREP structures of K13 and other BTB-Kelch proteins. (a) Location of the 10% most conserved amino acid sites (magenta) on the three-dimensional structure of PfK13 KREP. he conservation level of positions was deined using the site-speciic substitution rates λ estimated with FuncPatch (Supplementary Dataset S1). he KREP structure is shown from the side view as cartoon (let structure) and from the bottom view as surface (right structure). he amino acid sites forming the surface of the shallow pocket and belonging to the 10% most conserved sites are labelled. (b) Electrostatic surface potential of the PfK13 KREP structure, estimated with the APBS method. Electrostatic potential values are in units of kT/e at 298 K, on a scale of −8 kT/e (red) to +8 kT/e (blue). White color indicates a neutral potential. he missing charges were added using the Add Charge function implemented in USCF Chimera. (c) Box plots showing the distribution of root-mean-square luctuations (RMSFs; Supplementary Dataset S2) for the PfK13 KREP shallow pocket positions (shallow pocket group, green) and the remaining PfK13 KREP positions (other group, white). RMSFs were calculated through a molecular dynamics simulation for a duration of 100 ns. Box boundaries represent the irst and third quartiles and the length of whiskers correspond to 1.5 times the interquartile range. he diference between groups was evaluated by non-parametric Mann-Whitney
The conserved K KREP patch is related to KREP binding activities in well characterized
BTB-Kelch proteins.
To evaluate the reliability of FuncPatch to infer conserved functional sites in the con-text of KREP folds, we studied four other BTB-Kelch proteins found in mammals and which are functionally and structurally well-characterized and involved in E3 ubiquitin ligase complexes (KEAP1, KLHL2, KLHL3 and KLHL12). All these proteins are known to bind substrate proteins through validated binding residues located in their KREP shallow pocket: Nrf2 for KEAP142, WNK for KLHL2 and KLHL341, and Dishevelled for KLHL1243. Using large sets of orthologous amino acid sequences (ranging from 129 sequences for KLHL12 to 162 sequences for KLHL2), a statistically signiicant spatial correlation of site-speciic substitution rates λ was detected for each KREP fold (Table 2). In each case, the 10% most conserved KREP positions clustered in their respective shallow pocket (highest p= 1.4 × 10⁻⁷ for KEAP1, chi-squared test; Fig. 5d and Supplementary Table S3) and included some critical amino acid residues for substrate binding. he shallow pocket of KEAP1, KLHL2 and KLHL3 KREP structures also showed a markedly electropositive surface potential while that of KLHL12 was more neutral and similar to that of PfK13 (Fig. 5d). herefore, these results demonstrate the reliability of our structural-evolutionary approach to detect functional sites in a context of KREP folds.K KREP positions involved in ART R are not associated with basic structural and long term
evolutionary parameters.
Several non-synonymous mutations in PfK13 KREP have been reported to confer ART-R to P. falciparum parasites from SEA5–9. Here, we tested whether these ART-R positions have spe-ciic evolutionary or structural properties. herefore, K13 KREP positions were classiied as associated (n = 28) or not (n = 256) with an ART-R mutation, on the basis of the last World Health Organization (WHO) status report on ART-R (listed in Supplementary Table S4)44. First, we observed a wide distribution of ART-R posi-tions across the KREP fold (Fig. 6a), but none located at the shallow pocket, although this trend was not sta-tistically conirmed (p= 0.23, Fisher’s exact test; 0/19 ART-R mutations for the shallow pocket positions, and 28/265 ART-R mutations for the remaining PfK13 KREP positions). Second, no diference in the inter-species spatially correlated site-speciic substitution rates λ was observed between the two groups of KREP positions (p= 0.96, Mann-Whitney U test; Supplementary Fig. S11). Of note, ten positions associated with an ART-R muta-tion exhibited a substantially higher substitumuta-tion rate than posimuta-tion 580 – associated with the pk13 C580Y allele which has outcompeted other alleles in the East hailand-Cambodia-Lao PDR-Vietnam region7 (Supplementary Table S4). Finally, three structural parameters were also estimated for each position using the WT PfK13 KREP structure45: the relative solvent accessibility (RSA) which measures to what extent an amino acid is accessible toAAa position Ref. AAa (P. fal) PfK13 mutantb
Sequence variation across Apicomplexa
species λ
-based KREP rank n, (%)c Plasmodium
(n = 21)
Non-Plasmodium (n = 22)
451 F — F (21) H (16); C (4); T (2); S(1); N (1) 132 (46.48)
456 Y — Y (21) H (12); I (7); P (2); Y (1) 125 (44.01)
482 Y SAFR Y (21) Y (17); H (5) 37 (13.03)
498 N IAFR N (21) Q (13); Y (7); H (2) 44 (15.49)
529 R KAFR R (21) R (22) 1 (0.35)
530 N KAFR/YAFR N (21) N (22) 9 (3.17)
546 Y — Y (21) F (22) 13 (4.58)
551 I — I (21) I (19); V (3) 86 (30.28)
576 S LAFR S (21) S (22) 3 (1.06)
577 S PAFR S (21) S (22) 10 (3.52)
593 T SAFR T (15); A (6) T (22) 19 (6.69)
597 R — R (21) R (22) 12 (4.23)
623 S CSEA S (21) S (22) 2 (0.70)
624 S — S (21) A (15); G (7) 23 (8.10)
640 I VAFR I (21) I (19); M (2); V(1) 42 (14.79)
671 M — M (21) M (17); L (3); I (1); F (1) 73 (25.70)
672 N — N (21) D (22) 47 (16.55)
688 E — E (21) Q (22) 45 (15.85)
[image:10.595.156.501.46.331.2]717 F — F (21) Y (19); S (3) 33 (11.62)
Table 3. Conservation level of the protein sites constituting the K13 KREP shallow pocket. aAA: amino acid
position. Ref. AA indicates the wild type amino acid in PfK13. bNone of the PfK13 mutant positions located at
the K13 KREP shallow pocket was reported to confer the ART-R phenotype. All PfK13 mutants presented here have been described in one or two parasite samples from large population surveys5,8,9,91,92. AFR (Africa) and SEA (Southeast Asia) refer to the geographic origin of the PfK13 mutant parasite isolate. che rank attributed
the solvent, the side-chain weighted contact number (WCNsc) which estimates how densely packed a residue is within the protein tertiary structure, and the RMSF mentioned above (which measures to what extent a given residue changes its position over time). No diference was detected for these structural parameters between the
a
Positions associated with ART-R mutations
Candidate (n = 19)
Validated (n = 9)
Shallow pocket
b
443 493 543 593 643 693 443 493 543 593 643 693
PfK13 KREP amino acid
3 1 Kf PP E R Ko ni m a aci d WT C580Y
443 493 543 593 643 693 443 493 543 593 643 693
PfK13 KREP amino acid
3 1 Kf P P E R Ko ni m a aci d WT R539T
Level of correlation
0 0.05 0.1 0.15 0.2 0.25 0 0.05 0.1 0.15 0.2 0.25 44 3 4 51 45 9 46 7 47 5 48 3 49 1 49 9 50 7 51 5 52 3 53 1 53 9 54 7 55 5 56 3 57 1 57 9 58 7 59 5 60 3 61 1 61 9 62 7 63 5 64 3 65 1 65 9 66 7 67 5 68 3 69 1 69 9 70 7 71 5 72 3 R M SF (n m) RM S F( n m)
PfK13 KREP amino acid
Larger fluctuations in C580Y ART-R system
C580Y
R539T Larger fluctuations in R539T ART-R system
I II III IV V VI I
I II III IV V VI I
WT system
R539T ART-R system WT system
C580Y ART-R system
# H-bond Tim e (n s ) Ti m e( ns) R539 T539 C580 Y580 -1 0 1 0.5 -0.5 -1 0 1 0.5 -0.5 WT WT
1 2 3 4 5 6
# H-bond
1 23 4 5 6 0
0 0 10 20 30 40 50 60 70 80 90 100 0 10 20 30 40 50 60 70 80 90 100
c
d
Shallow pocket C580 C532 IV V III VI IV V VI III Shallow pocket Y580 IV III Shallow pocket E606 R539 3.2 4.9 T539 III IV Shallow pocket II II E606 Nter CterTop side (central channel)
Bottom side (shallow pocket)
C580Y R539T
[image:11.595.96.554.47.512.2]A578S
KREP positions associated or not to ART-R (RSA: p= 0.44; WCNsc: p= 0.46; RMSF: p= 0.20, Mann-Whitney
U test; similar results were obtained with other replicates for RMSF; Supplementary Fig. S11). Altogether, these results suggest that K13 KREP positions involved in ART-R are not associated with basic structural and long-term evolutionary parameters.
PfK ART R mutations cause local structural destabilization of KREP
Next, we tested whetherthe introduction of amino acid changes that confer ART-R would alter the PfK13 KREP structure, and more spe-ciically the putatively functional shallow pocket. Here, we focused on the ART-R mutations C580Y and R539T because they are the most prevalent and associated with very high level of ART-R respectively. he mutations were introduced individually in silico, then the mutant structures were subjected to molecular dynamics simula-tions during 100 ns (namely C580Y ART-R and R539T ART-R systems). As controls, we studied the WT structure and an ART-sensitive mutant structure (A578S, commonly found in Africa; A578S ART-S system). In all the mutant systems, we did not detect any striking global defect of the KREP structure, as assessed by the total num-ber of hydrogen bonds (H-bonds) in KREP (Supplementary Fig. S12a) and by both the RMSD (Supplementary Fig. S12b) and solvent accessible surface area (Supplementary Fig. S12c) that were averaged across all KREP positions. Also, the electrostatic surface potential of the WT and mutant structures were similar (Supplementary Fig. S12d).
We then looked at individual positions across the molecular dynamics simulations of the WT and mutant systems by examining the spatial luctuations of KREP backbone Cα atoms (RMSF data). Larger luctuations of amino acid residues from blades IV, V and VI were observed in the mutant ART-R systems compared to the WT system (Fig. 6b). his contrasts with the A578S ART-S system in which fewer luctuations were found compared to the WT system (Supplementary Fig. S13a). he luctuations were similar for the amino acid residues forming the shallow pocket in the mutant systems compared to the WT system (Supplementary Fig. S14a). We further calculated the dynamical cross-correlation maps (DCCMs) which measure for each pair of residues whether they move in the same direction (correlated motions) or in opposite directions (anti-correlated motions), using the backbone Cα atoms along the molecular dynamics simulations. Increased anti-correlated motions were observed in the mutant ART-R systems – especially for R539T – compared to the WT system (Fig. 6c), involving amino acid residues located on blades IV, V and VI, which is consistent with RMSF proiles. No diference in correlated and anti-correlated motions of KREP residues was found between the A578S ART-S and WT systems (Supplementary Fig. S13b).
Finally, we looked at the local environment of the mutant residues. In the C580Y ART-R system, a puta-tive disulide bridge C532-C580 (blade III-blade IV) was lost (Fig. 6d). In addition, H-bonds involving C580Y (blade IV) with amino acid residues from blades III, IV and V were found only during the irst ten ns of the simulation whereas they were not found at all in the WT system (Fig. 6d). he gain and then early, deinitive loss of these H-bonds suggested a local rearrangement of the amino acids close to C580Y and that the loss of the disulide bridge destabilizes the C580Y structure. In the R539T ART-R system, the R539T residue (blade III) was involved in a drastically lower number of H-bonds, including the complete loss of the salt bridge with E606 (blade IV), which was systematically found during the 100 ns simulation in the WT system (Fig. 6d). he loss of an inter-blade H-bond may afect structure stability. In the A578S ART-S system, one new intra-blade H-bond with G591 (blade IV) was recurrently gained and lost during simulations compared to the WT system (Supplementary Fig. S13c), suggesting that it is not critical for the structure stability. Interestingly, none of the tested mutations was found to alter the H-bond network at the shallow pocket (Supplementary Fig. S14b).
Altogether, these results suggest that pk13 R539T and C580Y ART-R mutations cause local structural desta-bilization of KREP rather than directly altering the putative binding region (shallow pocket).
Discussion
Combining evolutionary and tertiary structure information provides a powerful and eicient way to gain insight into the functionality of protein sites45. People usually search for amino acid sites that have evolved more rapidly than expected under a neutral model and interpret them as a signature of adaptive evolution corresponding to a gain of new function(s)46,47. Here, we focused on the most slowly evolving, patches of amino acid sites in 3D structure to identify sub-regions of K13 that are likely to play a function conserved during the long time-period of Apicomplexa evolution. Detecting highly conserved sites in extremely conserved genes, such as pk13, through population genetics would require a very large sampling of gene sequences48, which has not yet been reached for
pk139.
S577 and S623; Table 3). In KEAP1, KLHL2 and KLHL3, the corresponding conserved arginine and serine resi-dues directly bind acidic peptides derived from their substrates, the transcription factor Nrf2 and kinases WNK respectively41,42. he electrostatic surface potential of the shallow pocket of K13 is slightly positive, therefore the K13 substrate molecule(s) may also harbor an electronegative binding motif. Altogether, these results indicate that the shallow pocket of K13 KREP exhibits several properties of a conserved, binding surface and we speculate that it may be critical for the recognition of K13 substrate molecule(s). We propose that conserved arginine and serine residues are putative candidate binding sites in the shallow pocket of PfK13, a hypothesis that could be tested by biochemical experiments using recombinant K13 KREP domains. In P. falciparum, PfPI3K is a likely partner candidate as it is immunoprecipitated with full-length PfK13, and its ubiquitination and proteasomal degradation are altered by the PfK13 C580Y mutation on the KREP domain17. Another candidate may be the PK4 kinase which phosphorylates eIF2α, a key mediator of translation-mediated latency involved in ART-R15.
he pk13-mediated ART-R mechanism in P. falciparum is related to the binding activity of PfK1317, presuma-bly through the KREP domain since ART-R mutations cluster in this PfK13 domain5,7,8. In KEAP1, cancer-related missense mutations in the KREP domain were reported to be pathogenic through diverse molecular efects such as reduced binding of Nrf2 (mainly mutations at Nrf2 binding sites in the shallow pocket) and decreased protein stability or abundance (mutations outside the shallow pocket)49–51. In PfK13, it is interesting to note that the 28 validated or candidate pk13 ART-R alleles are largely distributed across the PfK13 KREP structure and are all located outside the shallow pocket (Fig. 6a): some validated ART-R alleles have a preferential localization at positions proximal to the A and B strands (F446I, Y493H, R539T, I543T, C580Y)9 and some other candidates are found in the underlayer of the pocket. In addition, polymorphisms which have an uncharacterized phenotype were reported at 9 out of the 19 positions forming the shallow pocket, but found in only one or two parasite sam-ples from very large population surveys (Table 3). herefore, one may speculate that amino acid changes at the shallow pocket positions, that we predict to be directly involved in substrate binding, are too functionally damag-ing to provide a long-term competitive advantage. Rather, many pk13 ART-R alleles may alter other properties of PfK13 such as its abundance, for example through altered protein synthesis or folding or stability. In this scenario, a lesser abundance of mutant – but still functional – PfK13 protein would result in decreased PfK13 cellular activ-ity. In addition to the location of ART-R mutations mentioned above, several data support this stability scenario. First, the C580Y ART-R mutation leads to an approximately 2-fold lower abundance of PfK13 protein, as meas-ured by quantitative dimethyl-based proteomics analysis of several strains derived from clinical ART-resistant Cambodian parasites19 (note that a diferent result was reported for two African isogenic strains using western blot analysis20). Second, several mutations in the KREP domain of the BTB-Kelch protein Gigaxonin, which cause giant axonal neuropathy in humans52,53, were shown to decrease Gigaxonin protein abundance through altered stability, as evidenced by pulse chase experiments53. Interestingly, the Gigaxonin mutation C464Y, which is located in the KREP central channel such as C580Y in PfK13, was identiied in a compound heterozygous patient and was also associated with a decreased Gigaxonin protein abundance. hird, molecular dynamics simulations on the BTB-Kelch KLHL3 protein revealed that some pathogenic mutations localized in the central channel of KREP (such as C580Y in PfK13), have no efect on KREP-ligand interaction54. And inally, the molecular dynam-ics simulations we carried out on PfK13 R539T and C580Y ART-R KREP structures (at a temperature of 300 K during 100 ns) showed that R539T and C580Y mutations cause structural destabilization on blades IV, V and VI, at amino acid positions that are not located at the shallow pocket.
BTB appeared here as the most conserved domain of K13 over Apicomplexa evolution, and therefore likely carries critical activities. One surprising result of our study is that it most resembles the BTB domain of the KCTD protein family in primary sequence, tertiary structure and short domain size. KCTD proteins are oten found in E3 ubiquitin ligase complexes, such as BTB-Kelch proteins, but lack a KREP domain27. he shortened BTB domain of KCTDs can mediate protein oligomerization26,27,55, consistent with the dimer observed in the solved BTB-KREP crystal structures of PfK13 (PDB codes 4YY8 and 4ZGC)38,56. he BTB domain of K13 harbors a predicted, functional patch – located at the B2-B3 and B4-A4 loops and at the A4 helix – that overlaps with the patch we found on the BTB domain of KCTDs. In KCTDs, these sites make BTB-BTB contacts in tetrameric or pentameric assemblies when BTB is solved as an isolated domain27. However, the PfK13 BTB-KREP structure forms a dimer and none of the highly conserved K13 BTB positions makes BTB-BTB contacts (PDB codes 4YY8 and 4ZGC)38,56. In several solved BTB complexes, amino acids of the B4-A4 loop (corresponding to positions 397–399 in PfK13) are exposed at the BTB-Cullin binding interface26. hese discrepancies in the role of the pre-dicted BTB conserved patch could be due to the fact that additional domains (such as KREP) or partner proteins might constraint the folding of the BTB domain into oligomers or complexes. Altogether, data from the literature however support that the BTB predicted patch of K13 may mediate protein-protein interactions, possibly with a Cullin protein.
Interestingly, K13 also contains a highly conserved CCC domain which therefore likely carries critical activ-ities. Consistent with this hypothesis, pk13 R239Q, E252Q and D281V alleles located in CCC confer ART-R, although at a moderate level compared to KREP mutations3,7,57. Coiled-coils are ubiquitous protein-protein inter-action domains composed of two or more α-helices coiling together58. A CCC domain was reported in a few KREP-containing proteins (including some KCTDs) involved in cell morphogenesis but these CCC have a difer-ent domain organization than the one of K1339. he CCC of K13 may participate in K13 oligomerization and/or serve as a binding interface with other molecules59.
focus on the validation of the binding properties of the K13 KREP shallow pocket and identify its binding part-ner(s). his may help to clarify the structure-function relationship in K13.
Materials and Methods
Collection of k
orthologous sequences from genomic databases
he amino acid sequence of PfK13 (PlasmoDB code PF3D7_1343700) was queried against the specialized eukaryotic pathogen data-base EuPathDB (release 33)60 and the NCBI non-redundant protein database using blastp and tblastn searches (BLOSUM62 scoring matrix)61. A protein was considered as a likely orthologous sequence if the sequence identity was ≥30% and the e-value below the 10−3 cutof. Forty-three K13 sequences – and corresponding k13 cDNA sequences – were retrieved from distinct Apicomplexa species including 21 Plasmodium species. A detailed bio-informatics analysis was performed on each protein sequence to conirm the presence of the three annotated domains of K13 (CCC, BTB and KREP) using InterPro62.k
codon sequence alignment
Considering the greater divergence of coding nucleotide sequences ascompared to protein sequences due to the genetic code redundancy, a K13 protein sequence alignment was irst generated using MAFFT version 7 (E-INS-I strategy with BLOSUM62 scoring matrix, gap opening penalty 2.0 and ofset 0.1)63. he output alignment was visually inspected and manually edited with BioEdit v7.2.564. he positions containing gaps in at least 30% of all sequences were removed for further evolutionary analyses, as sug-gested by PAML’ author34. hen, the k13 nucleotide sequence alignment was generated with PAL2NAL65 using the cleaned K13 amino acid alignment as template.
Phylogenetic analysis of k
.
he phylogenetic relationships of k13 nucleotide sequences were inferred using the maximum-likelihood method implemented in PhyML v3.066, ater determining the best-itting nucleo-tide substitution model using the Smart Model Selection (SMS) package67. A general time-reversible model with optimized equilibrium frequencies, gamma distributed among-site rate variation and estimated proportion of invariable sites (GTR +G+I) was used, as selected by the Akaike Information Criterion. he nearest neighbor interchange approach was chosen for tree improving, and branch supports were estimated using the approximate likelihood ratio aLRT SH-like method68.Molecular evolutionary analysis of k
.
To investigate the evolutionary regime that has shaped the k13protein-coding DNA sequence during species evolution, we analyzed the non-synonymous (dN) to synonymous (dS) substitution rate ratio ω (=dN/dS), estimated by maximum-likelihood using the codeml tool from PAML v.4.834,69. ω provides a sensitive measure of selective pressure at the amino acid level by comparing substitution rates with statistical distribution and considering the phylogenetic tree topology. Typically, ω<1 indicates puri-fying selection, while ω= 1 and ω>1 indicate neutral evolution and positive selection respectively.
he variation of ω among lineages and codon sites was evaluated using codon models free-ratio (FR), M0, M1a, M2a, M3, M7 and M870,71 and statistically compared using likelihood ratio tests (LRTs)72. he details of each model and PAML interpretations can be found in Supplementary Methods S1.
In addition to k13, four other ive- or six-bladed KREP protein-coding sequences were considered to compare their ω with those estimated for the whole Plasmodium proteome. We used the ω values previously estimated by Jefares et al.35 with PAML under the one-ratio model for each of the 3,256 orthologous protein-coding genes among six Plasmodium species: P. falciparum, P. berghei, P. chabaudi, P. vivax, P. yoelii and P. knowlesi. A full description of the procedure is presented in the original paper35.
Inferring site specific substitution rates considering their spatial correlation in the K
BTB-KREP tertiary structure.
Most methods – including PAML – assume that site-speciic substitution rates are independently distributed across sites73. However, it is widely acknowledged that amino acids located close to each other in protein tertiary structures are more likely to carry out similar functions, suggesting a site interdependence in amino acid sequence evolution attributed to tertiary structure73,74. Consequently, the sub-stitution rate at the protein level (named λ in this study) was inferred using the FuncPatch server33. FuncPatch requires an amino acid sequence alignment, a phylogenetic tree and a protein tertiary structure to estimate the conservation level during species evolution and the characteristic length scale (in Å) of spatially correlated site-speciic substitution rates λ. We used the X-ray structure at 1.81 Å resolution of WT PfK13 BTB-KREP as the reference structure which does not contain the conserved CCC domain (PDB code 4YY8, chain A)38. Beforehand, a Ramachandran analysis was performed to validate the quality of the structure using MolProbity75: 96.9% and 3.1% of the amino acids were in favored and allowed regions, respectively, and there were no outliers. FuncPatch only accepts monomeric proteins as input whereas BTB-KREP of PfK13 dimerizes in crystal structure. To take into account the dimeric organization of PfK13, its tertiary structure was edited using customized python scripts (Python v2.7.13) in order to merge the two monomers (chains A and B) and the K13 sequence was duplicated in the K13 protein sequence alignment. he analysis was also done using either one of the other monomeric BTB-KREP tertiary structure and also using a disulide-bonded version of PfK13 BTB-KREP (PDB code 4ZGC, chain A)56. All these control analyses yielded similar results (data not shown) as the one presented here. he spa-tial correlation of the site-speciic substitution rates λ in the K13 tertiary structure was tested using a Bayesian model comparison, where a null model (model 0), in which no spatial correlation of site-speciic substitution rates λ is present, is compared to the alternative model (model 1). As suggested by FuncPatch’ authors, the spatial correlation was considered as signiicant if the estimated log Bayes factor (model 1 versus model 0) was larger than 8 in the dataset (conservative cutof)33.Delineation of K KREP blades and secondary structures
he KREP domain of PfK13 is composedthe primary amino acid sequence level, we irst sought to align the six blade structures. he PDB KREP struc-ture was obtained from the PfK13 BTB-KREP strucstruc-ture (PDB code 4YY8, chain A)38 and was then divided into six parts, each one containing the atomic coordinates of one blade. he six blade structures were then aligned by minimizing the RMSD of atomic positions using the align function in PyMOL Molecular Graphics System (Schrödinger, LLC) so as to identify the amino acids from the six blades that are located at exactly the same blade position. his structure alignment was then used to align the six blades at the primary amino acid sequence level. he delineation of the strands and loops was obtained directly from the PDB ile (PDB code 4YY8, chain A)38.
Structural evolutionary analysis of the BTB and KREP domains in other BTB- and KREP-
containing proteins.
To characterize the BTB domain of K13, we arbitrarily retrieved some members belonging to the main BTB-containing protein families (BTB-ZF, BTB-Kelch, RhoBTB, BTB-NPH3, MATH-BTB, KCTD, KCNA and SKP1 and Elongin C proteins; full list provided in Supplementary Table S5). A multiple pro-tein alignment was generated using MAFFT version 7 (default parameters)63 and was then manually edited with BioEdit v7.2.564 to retain only the region referring to the BTB core fold. he phylogenetic relationships were inferred with the PhyML program66 using the best-itting protein substitution model as determined by the SMS package67. he model of K13-Cullin2 complex was obtained by a structural alignment using the align function in PyMOL (Schrödinger, LLC) of the K13 BTB domain (PDB code 4YY8)38 with Elongin C using the X-ray structure at 3.2 Å resolution of Elongin C-Cullin2 complex (PDB code 4WQO)37.For further comparisons with the K13 BTB and KREP domains, site-speciic substitution rates λ were inferred with FuncPatch for the BTB and KREP domains of several mammalian KCTD and BTB-Kelch proteins, respec-tively. In the present study, the proteins were selected on the basis of their sequence homology with K13, the avail-ability of a solved 3D structure, and their known implication in a Cullin-RING E3 ligase complex as suspected for K13. In addition, only well-characterized ligand-binding function and the presence of a six-bladed KREP structure similar to the one of K13 were considered for BTB-Kelch proteins. Ater a careful review of the litera-ture, we selected two KCTD proteins: SHKBP1 (UniProt code Q8TBC3) which regulates the epidermal growth factor receptor (EGFR) signaling pathway76; and KCTD17 (Q8N5Z5) which mediates the ubiquitination and proteasomal degradation of the ciliogenesis down-regulation TCHP protein77. Considering BTB-Kelch proteins, we focused on: KEAP1 (Q14145) which interacts with its client protein Nrf2 for the induction of cytoprotective responses to oxidative stress42; KLHL2 (O95198) and KLHL3 (Q9UH77) which both participate in the ubiquiti-nation and degradation of WNK substrates regulating blood pressure41; and KLHL12 (Q53G59) which negatively regulates the WNT-beta-catenin pathway through the degradation of Dishevelled proteins43. he building of datasets is described in Supplementary Method S2, and the full list of orthologous sequences used for each mam-malian KCTD and BTB-Kelch protein is provided in Supplementary Table S6. he phylogenetic relationships were inferred using PhyML66 ater determining the best-itting protein substitution model with the SMS pack-age67. he 3D structures of KCTD BTB and BTB-Kelch KREP domains were retrieved from the PDBsum database under the following accession numbers: 4CRH for SHKBP1 (resolution: 1.72 Å)27, 5A6R for KCTD17 (resolution: 2.85 Å)27, 2FLU for KEAP1 (resolution: 1.50 Å, in complex with a Nrf2 peptide)78, 4CHB for KLHL2 (resolution: 1.56 Å, in complex with a WNK4 peptide)41, 4CH9 for KLHL3 (resolution: 1.84 Å, in complex with a WNK4 pep-tide)41 and 2VPJ for KLHL12 (resolution: 1.85 Å)24. Beforehand, the quality of each structure was validated using MolProbity75: none of the structures had amino acids identiied as outliers, and approximately 98% of the amino acids of each structure were in favored regions.
Molecular dynamics simulations and evaluation of structural properties.
Molecular dynamics simulations were carried out on the KREP domain of PfK13 containing the C532-C580 disulide bond (PDB code 4ZGC, chain A)56 using GROMACS v. 5.0.779 for a duration of 100 ns at a temperature of 300 K. Although the C532-C580 disulide bond is not present in the second resolved structure (PDB code 4YY8)38, the two thiol side-chains face each other in the 4YY8 structure and the C532-C580 disulide bond is recommended as assessed by the PROPKA program80. Because no experimentally mutant PfK13 structures are yet determined, we gener-ated mutant PfK13 KREP structures by individually introducing in silico the mutations R539T, C580Y or A578S: we used the swapaa function of UCSF Chimera to substitute the WT residue with the most probable rotameric conformation of the mutant residue81. Full parameters and options of the molecular dynamics simulations can be found in Supplementary Method S3.Amino acid lexibility was investigated by calculating root-mean-square luctuations (RMSFs) on side-chain residues using the inbuilt rmsf function in GROMACS. he number of distinct H-bonds formed within the pro-tein during simulations was counted when the donor-acceptor distance is ≤3.5 Å and donor-hydrogen-acceptor angle ≤30°, using the hbond function in GROMACS. he electrostatic surface potential of each KREP structure was calculated using the Adaptive Poisson-Boltzmann Solver (APBS) method82. Beforehand, the required pqr input iles were prepared using PDB2PQR v.2.1.183. he missing charges were added using the Add Charge func-tion implemented in USCF Chimera81. A grid-based method was used to solve the linearized Poisson-Boltzmann equation at 298 K, with solute (protein) and solvent dielectric constant values ixed at 2 and 78.5, respectively. he contact surface selection was mapped using a radius of 1.4 Å in a scale of −8 kT/e to +8 kT/e. he relative solvent accessibility (RSA), which quantiies the extent to which a given residue comes into contact with solvent, was estimated as its surface area accessible to water using the DSSP program84, then normalized with the maximal accessible surface area of each amino acid85. he side-chain weighted contact number (WCN