Int. J. Electrochem. Sci., 12 (2017) 5438 – 5449, doi: 10.20964/2017.06.35
International Journal of
ELECTROCHEMICAL
SCIENCE
www.electrochemsci.org
Electrochemical Studies on the Stability and Corrosion
Resistance of Two Austenitic Stainless Steels for Soft Drinks
Containers
D. Mareci1,†, L.C. Trinca2,*, V.V. Cotea2, R.M. Souto3,4,*
1
Department of Chemical Engineering, “Gheorghe Asachi” Technical University of Iasi, 700050 Iasi, Romania
2
Exact Sciences Department, “Ion Ionescu de la Brad” University of Agricultural Science and Veterinary Medicine, 700490 Iasi, Romania
3
Department of Chemistry, Universidad de La Laguna, E-38205 La Laguna, Tenerife, Canary Islands, Spain
4
Instituto Universitario de Materiales y Nanotecnologías, Universidad de La Laguna, E-38200 La Laguna, Tenerife, Canary Islands, Spain
†
Deceased on January 8, 2017. *
E-mail: rsouto@ull.es, lctrinca@yahoo.com
Received: 31 January 2017 / Accepted: 5 April 2017 / Published: 12 May 2017
Austenitic stainless steel alloys are used in different food industry applications, including the preparation and storage of acidified carbonated soft drinks. Yet, austenitic stainless steels are not inert materials in contact with these drinks, and eventual modifications of these alloys must be investigated.
Three carbonated soft drinks were investigated as for their effect on the stability of FeCrNi and FeCrNiMo alloys using two electrochemical techniques, namely linear potentiodynamic polarization (LPP) and electrochemical impedance spectroscopy (EIS), at 25 ºC. The high corrosion resistance of the austenitic stainless steel alloys in the soft drinks was provided by the formation of a rather stable passive film formed by metal oxides. Also, the electrochemical behaviour was related to an inhibitory action by caffeine as evidenced using potentiodynamic polarization and electrochemical impedance spectroscopy methods, with good correlations between them.
Keywords: Stainless steel; Beverages; Corrosion resistance; Electrochemical characterization; Surface analysis; Scanning electron microscopy (SEM).
1. INTRODUCTION
public associated to frequent intake especially among teenage and young populations [1-4]. Yet, there is an additional health risk source arising from degradation processes of metal containers used during both manufacturing and packaging stages, namely metal release due to corrosion and erosion [5-8], a feature that is often underestimated [9]. There are also reports that soft drinks affect metal ions release from orthodontic appliances [10-15]. Finally, carbonated drinks influence the natural components of teeth to a great extent as well [16-22].
The degradative potential of carbonated beverages towards metallic containers is greatly affected by the low pH (around 3) and the buffering capacity of the drink. Soft drinks may contain organic acids derived from fruit extracts such as citric acid from oranges, tartaric acid from grapes, or malic acid from apples [23]. Other acids may be added during the manufacturing process such as carbonic acid (in carbonated juices) or phosphoric acid (in cola drinks) in order to improve the organoleptic characteristics of the drink (taste) or to assure its sparkling characteristics [24]. Preservatives, such as added vitamin C (ascorbic acid), may also contribute to the acidity of soft drinks [25].
Austenitic stainless steels are widely employed in the beverage industry [26,27]. There are two subclasses of austenitic stainless steel: chromium-nickel (Cr-Ni), and chromium-manganese (Cr-Mn) low nickel steel. Cr-Ni steel is the most widely used, especially as the chromium nickel ratio can be modified to improve formability [28]. Molybdenum (Mo) can be added to improve corrosion resistance [29], and allows the Cr-Ni content to be increased [30]. Yet, Ni is known to promote more allergic reactions than other metals as result of metal release from corrosion [31]. Corrosion may be described as the deterioration of austenitic stainless steel by aggressive action of environmental factors [32]. Therefore, electrochemical characterization of the materials in different environments is an important tool in the material selection process [33,34].
The present work focuses on the corrosive action of some carbonated soft drinks on the stability of austenitic stainless steels by performing electrochemical monitoring during immersion tests. The present paper propose a comparative study of two austenitic stainless steels alloys, namely FeCrNi and FeCrNiMo, in three popular carbonated soft drinks from the Romanian market. Electrochemical characterization was performed using linear potentiodynamic polarization (LPP) and electrochemical impedance spectroscopy (EIS) techniques. Additionally, scanning electronic microscopy (SEM) was applied to monitor the surface condition of passive films retrieved after electrochemical tests.
2. EXPERIMENTAL PROCEDURES
checked by scanning electron microscopy (SEM) equipped with Energy-dispersive X-ray (EDX) using a VEGA II LSH (Tescan, Brno, Czech Republic) microscope operated at 30 kV accelerating voltage. The percentage values of the alloying elements in the two austenitic stainless steels are listed in Table 1. The composition values were determined as the averages from ten measurements.
Table 1. Chemical composition of FeCrNi and FeCrNiMo austenitic stainless steels determined by EDX.
C Cr Fe Mo Ni Si
FeCrNi wt.% 0.02 18.63 73.31 8.04
at.% 0.11 19.79 72.53 7.57
FeCrNiMo wt.% 0.02 17.50 69.52 2.19 10.11 0.66
at.% 0.07 18.68 69.10 1.27 9.56 1.31
The corrosion behaviour of the two austenitic stainless steels was investigated in three
[image:3.596.78.520.208.279.2]commercial carbonated soft drinks (purchased from food retail shop) with varied caffeine content, with compositions given in Table 2 in terms of general composition as indicated by the manufacturer, pH value determined with a pH-meter, total acidity by alkalimetric titration according SR 2567.1-1997, and soluble substances by refractometric analysis according STAS 2567-1997.
Table 2. Chemical composition of the three commercial carbonated soft drinks. Carbonated soft
drink
Type 1 Type 2 Type 3
Composition water, carbon dioxide, glucose-fructose syrup, citric acid (acidifying agent), sodium benzoate
(preservative), sodium citrate (acidity corrector), natural flavor
of lemon and lime
water, carbon dioxide, E150d colorant, cyclamate + potassium
acesulfame and aspartame (sweeteners),
phosphoric acid (acidifying agent), natural flavors, sodium
citrate (acidity corrector), phenol
alanine source
water, carbon dioxide, fructose corn syrup, citric acid (acidifying agent), flavors, caffeine,
ascorbic acid (antioxidant), potassium
sorbate, arabic gum (stabilizer), beta-carotene(pigment)
Caffeine / mg(100 mL)-1
0 11 19
Soluble substances / refractometric
degrees
9 0.1 12
Total acidity / (mL 1N NaOH)
(100 mL)-1
4.2 2.8 4.2
[image:3.596.56.542.447.775.2]
For the electrochemical tests, metal samples were cut from 30 mm diameter bars, wet-ground using 400, 600, 2000, and 4000 grit metallographic abrasive papers, followed by a final polishing step using 1 μm size alumina suspension. The samples were subsequently degreased with ethyl alcohol followed by ultrasonic cleaning with high purity deionized water. The steel samples were placed in a glass corrosion flow cell kit (C145/170, Radiometer Analytical, Lyon, France), exposing a 0.5 cm2 surface [35], and the cell was filled with the soft drink at 25 ± 1 oC. The electrochemical cell was completed with a saturated calomel reference electrode (SCE), and a platinum coil counter electrode. Measurements were performed using a potentiostat manufactured by PAR (Model PARSTAT 4000, Princeton Applied Research, Princeton, NJ, USA), under control by a personal computer using VersaStudio software. Upon immersion, samples were left unbiased for 1 h to attain a stable open-circuit potential (OCP) value in the soft drink environment, while monitoring the evolution of the OCP values against the reference electrode. Electrochemical impedance measurements (EIS) were performed at the open circuit potential by application of a 10 mV amplitude alternating voltage in the frequency range from 10 kHz to 1 mHz. The spectra were were analyzed in terms of an equivalent circuit (EC) using ZSimpWin 3.22 software (Princeton Applied Research). The typical guidelines for the selection of the best-fit EC were followed, namely to employ a minimum number of circuit elements, and errors below 5% for each element [35]. The linear potentiodynamic polarization test was initiated after 24 h immersion, and it was started from -1.0 VSCE up to +1.0 VSCE at a scan rate of 0.5 mVs-1
. For each electrochemical test, three specimens were monitored and their average results are reported together with by the corresponding standard deviation. After the electrochemical tests, the morphological characteristics of the corroded surfaces were evaluated using SEM.
3. RESULTS AND DISCUSSION
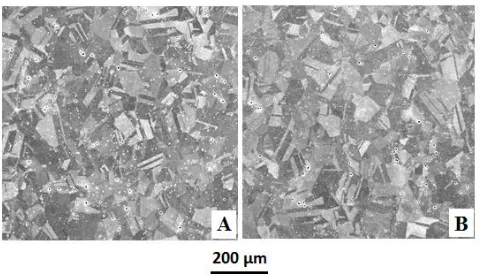
The micrographs shown in Figure 1 reveal the microstructure of the FeCrNi and FeCrNiMo alloys considered in this work. Both alloys present similar microstructures with equiaxial grains. The presence of Mo in the layer of the FeCrNiMo sample as a differential factor compared to FeCrNi is evidenced by the EDX analysis of the stainless steels given in Table 1.
[image:4.596.179.419.587.725.2]
Electrochemical impedance tests employ a small potential perturbation that has negligible effect on the condition of the sample, thus allowing for non-destructive characterization of the surface films spontaneously formed on the metals upon exposure to aqueous environments. EIS data were measured for the two alloys after different immersion periods in the acidified carbonated soft drinks under investigation, and they are displayed in Figures 2 and 3 in the form of Nyquist (i.e., complex versus real components of the impedance), and Bode plots (impedance modulus and phase angle versus frequency diagrams).
[image:5.596.114.482.213.702.2]
Figure 3. (A,C,E) Nyquist and (B,D,F) Bode impedance diagrams for FeCrNiMo austenitic stainless steel in three soft drinks at 25 oC recorded after different immersion times as indicated. Carbonated soft drink: (A,B) Type 1, (C,D) Type 2, and (E,F) Type 3.
[image:6.596.94.495.60.606.2]
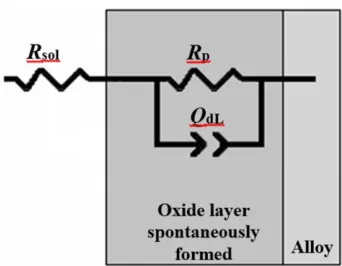
Figure 4. Electric equivalent circuit used for modeling of electrochemical impedance data.
For fitting the spectra, a constant phase element (CPE) was used instead of a pure capacitance due to the non-ideal capacitive response determined by the distributed relaxation feature of the passive oxide films, which was observed as a depressed semicircle when the spectra were plotted in the corresponding Nyquist diagrams. The impedance of the constant phase element (CPE) is given by [36]:
n CPEjω Q
1
Z (1)
where Q is the magnitude of the CPE, ω the angular frequency, j the imaginary complex number (-1)1/2, and the n value indicates the nature of the element (n = 0 corresponds to a resistor, and
n = 1 means that the CPE behaves as a pure capacitor).The passive films formed on the austenitic stainless steels contribute to the resistance and pseudo-capacitance of the compact oxide layers, where Rsol stands for the solution resistance of the test electrolyte. In this case, Rp is the polarization resistance, allowing a quantitative analysis based on the specific magnitudes of the corrosion rates. The obtained fitting parameters are listed in Table 3.
of this compound was more anodic than cathodic type inhibitor. Even higher inhibition efficiencies (ca. 92.4 %) were found for mild steel in acid environment [46].
Table 3. Electrochemical parameters extracted from impedance spectra through modeling experimental data to an electric equivalent circuit for FeCrNi and FeCrNiMo austenitic stainless steels exposed to the three carbonated soft drinks at 25 ºC as function of immersion time.
Steel Immersion time / h
QdL / µScm-2sn n Rp / Mcm2 Carbonated soft drink Type 1
FeCrNi 1 1.4 0.79 0.12
10 1.3 0.80 0.25
24 1.2 0.82 0.29
FeCrNiMo 1 1.2 0.81 0.28
10 1.2 0.81 0.31
24 1.2 0.82 0.34
Carbonated soft drink Type 2
FeCrNi 1 1.4 0.80 0.15
10 1.2 0.80 0.31
24 1.1 0.81 0.34
FeCrNiMo 1 1.3 0.80 0.22
10 1.2 0.80 0.25
24 1.2 0.81 0.38
Carbonated soft drink Type 3
FeCrNi 1 1.2 0.82 0.26
10 1.2 0.82 0.28
24 1.2 0.83 0.34
FeCrNiMo 1 1.2 0.81 0.36
10 1.2 0.81 0.39
24 0.9 0.83 0.45
[image:8.596.78.521.200.530.2][image:9.596.116.480.135.302.2]
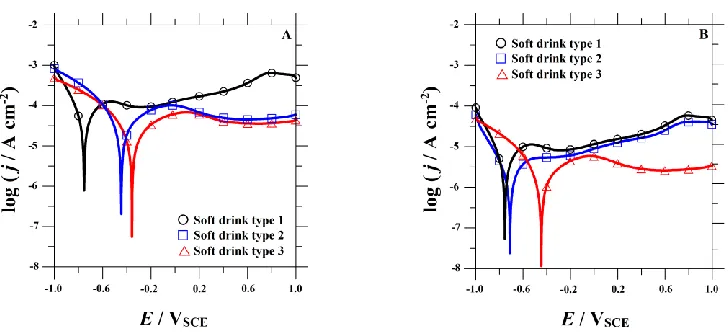
order of magnitude smaller passive currents, thus effectively releasing less soluble metal ions into the liquid environment.
Figure 5. Potentiodynamic polarization curves for (A) FeCrNi and (B) FeCrNiMo austenitic stainless steels in three carbonated soft drinks at 25 oC. They were recorded after 24 h immersion at their spontaneous open circuit potential. Scan rate: 0.5 mVs−1
.
The values of the zero current potential (ZCP) and the corrosion current density (jcor) for each material in the various carbonated soft drinks were determined by Tafel analysis of both the anodic and cathodic branches of the polarization plots. The ZCP is defined as the potential at which the current reaches a minimum during the forward potentiodynamic polarization scan. The corrosion current is representative for the degradation degree of each sample. The average values of ZCP and jcor determined from the polarization curves are presented in Table 4.
Table 4. Electrochemical parameters (average value and standard deviation of three measurements) determined from potentiodynamic polarization for FeCrNi and FeCrNiMo austenitic stainless steels after 24 h immersion in the three carbonated soft drinks at 25 ºC.
Steel Carbonated soft drink
ZCP / VSCE -βc / mVdec-1
βa / mVdec-1
jcor / μAcm-2
FeCrNi
Type 1 -0.76 (0.07) 89 (11.3) 167 (5.3) 24.9 (0.6) Type 2 -0.45 (0.05) 142 (3.2) 188 (2.1) 14.8 (0.4) Type 3 -0.36 (0.04) 132 (8.4) 178 (6.2) 7.2 (0.3) FeCrNiMo
Type 1 -0.75(0.07) 125 (6.5) 181 (4.9) 9.5 (0.3) Type 2 -0.71 (0.07) 140 (7.3) 177 (5.2) 6.7 (0.2) Type 3 -0.45 (0.04) 137 (8.1) 183 (9.9) 2.8 (0.2)
[image:10.596.254.493.279.424.2]
of austenitic stainless steels in the acidified carbonated soft drinks as shown in Figure 6. These surface defects were most probably induced, during the manufacture process of the austenitic stainless steels, due to the high surface energy produced by the plastic deformation during samples preparation. The effect of the acidified carbonated soft drinks is then mainly exerted on the pre-existing defects to become nucleation sites for the development of corrosion cracks. Cracks can lead by corrosion to crevices by inducing the degradation of metals samples through the formation of a differential aeration cell. On the other hand, the small differences between the surface aspects of the FeCrNi and FeCrNiMo austenitic stainless steels, evidenced by SEM micrographs (Figure 6) are in good agreement with the predominantly passive behavior of the materials observed from the LPP curves (cf. Figure 5).
Figure 6. Surface morphology of (A) FeCrNi (B) FeCrNiMo austenitic stainless steels retrieved from naturally aerated carbonated soft drink type 3 at 25oC after recording the potentiodynamic polarization curves shown in Figure 5.
4. CONCLUSIONS
A simple electrochemical method has been successfully used for in situ corrosion monitoring of two austenitic stainless steels employed in the food industry when exposed to various carbonated soft drinks. These electrochemical methods showed accuracy of the collected data and easiness of data collection in real-time.
The high corrosion resistance of the austenitic stainless steel alloys in soft drinks was due to the formation of a protective passive film, since low corrosion current densities, typical of passive materials, were obtained for both steel alloys.
[image:10.596.95.283.279.423.2]
The polarization resistances (Rp) for austenitic stainless steel alloys in these carbonated soft drinks increased with the immersion time because of the surface passivation phenomena.
The different contents of caffeine in the three carbonated soft drinks under investigation evidenced the corrosion inhibitive potential of this compound, and can be regarded an environment-friendly corrosion inhibitor.
Caffeine inhibition effect was characterized using potentiodynamic polarization techniques and electrochemical impedance spectroscopy, finding good agreement between the results from both electrochemical techniques.
ACKNOWLEDGEMENTS
The research described in this contribution was financially supported by the Romanian National Authority for Scientific Research, CNCS-UEFISCDI (project number PN-II-IDPCE- 2011-3-0218). The authors thank Professor Mario Rosso at Politecnico di Torino (Italy) for providing the austenitic stainless steel samples employed in this study.
References
1. G. Wyshack, R. E. Frisch, T. E. Albright, N. L. Albright, I. Schiff and J. Witschi, J. Othop. Res., 7 (1989) 91.
2. J. D. Shenkin, K. E. Heller, J. J. Warren and T. A. Marshall, Gen. Dent,. 51 (2003) 30. 3. V. S. Malik, M. B. Schulze and F. B. Hu, Am. J. Clin. Nutr., 84 (2006) 274.
4. N. P. Aptekmann and T. B. Cesar, Lipids Health Dis., 12 (2013) 119.
5. E. L. Koehler, J. J. Daly Jr., H. T. Francis and H. T. Johnson, Corrosion, 15 (1959) 45.
6. S. H. C. Sales-Peres, A. C. Magalhães, M. A. A. M. Machado and M. A. Buzalaf, Eur. J. Dent., 1 (2007) 10.
7. C. Hodge and M. M. Stack, Wear, 270 (2010) 104.
8. B. M. C. Soares, C. A. R. Anjos, T. B. Faria and S. T. Dantas, Packag. Technol. Sci., 29 (2016) 65. 9. B. B. A. Francisco, D. M. Brum and R. J. Cassella, Food Chem., 185 (2015) 488.
10. M.-J. Han, H.-C. Choe and C.-H. Chung, Met. Mater. Int., 11 (2005) 449. 11. C.-H. Chung, H.-C. Choe and J.-H. Kwak, Met. Mater. Int., 12 (2006) 357. 12. H. H. Y. Yip, R. W. K. Wong and U. Hägg, World J. Orthod., 10 (2009) 33. 13. M. Mikulewicz and K. Chojnacka, Biol. Trace Elem. Res., 139 (2011) 241.
14. M. Shanabi, A. Jahanbin, H. Esmaily, H. Sharifi and S. Salari, J. Clin. Ped. Dent., 35 (2011) 429. 15. M. Mikulewicz, P. Wolowiec, B. W. Loster and K. Chojnacka, J. Trace Elem. Med. Biol., 31
(2015) 74.
16. N. X. West, J. A. Hughes and M. Addy, J. Oral Rehab., 28 (2001) 860. 17. D. T. Zero and A. Lussi, Int. Dent. J., 55:Supp.4 (2005) 285.
18. A. U. Yap, K. W. Lye and C. W. Sau, Oper. Dent., 22 (1997) 260.
19. A. U. Yap, D. T. Tan, B. K. Goh, H. G. Kuah and M. Goh, Oper. Dent., 25 (2000) 202. 20. R. D. Paravina, L. Roeder, H. Lu, K. Vogel and J. M. Powers, Am. J. Dent., 17 (2004) 262. 21. S. Wongkhantee, V. Patanapiradej, C. Maneenut and D. Tantbirojn, J. Dent., 34 (2006) 214. 22. M. Kitchens and B. M. Owens, J. Clin. Ped. Dent., 31 (2007) 153.
23. J. F. Tahmassebi, M. S. Duggal, G. Malik-Kotru and M. E. Curzon, J. Dent., 34 (2006) 2. 24. D. Birkhed, Caries Res., 18 (1984) 120.
25. S. R. Grobler, G. N. Jenkins and D. Kotze, Brit. Dent. J., 158 (1985) 293.
27. A. H. Tuthill and R. Brunkow, BioProcess Int., 2:11 (2004) 46. 28. B. J. Connolly, Brit. Corros. J., 5 (1970) 209.
29. R. M. Davison and J. D. Redmond, Mater. Performance, 27:12 (1988) 39.
30. M. J. Johnson and A. L. Steel, in: Bioprocess Engineering Symposium – 1988, D. E. DeLucia, T. Diller and M. Prager (Eds.); American Society of Mechanical Engineers, New York, NY (1988), p. 53.
31. T. Eliades and C. Bourauel, Am. J. Orthod. Dentofacial Orthop., 127 (2005) 403.
32. B. Valdez Salas, M. Schorr Wiener, M. Stoytcheva, R. Zlatev and M. Carrillo Beltran, in: Food Industrial Processes - Methods and Equipment, B. Valdez (Ed.); InTech Europe, Rijeka, Croacia (2012), p. 363.
33. G. Ciurescu, J. Izquierdo, J. J. Santana, D. Mareci, D. Sutiman, S. González and R. M. Souto, Int. J. Electrochem. Sci., 7 (2012) 7404.
34. D. Mareci, B. M. Fernández-Pérez, L.C. Trinca, I. Fotea and R. M. Souto, Int. J. Electrochem. Sci., 11 (2016) 6922.
35. D. Mareci, I. Rusu, R. Chelariu, G. Bolat, C. Munteanu, D. Sutiman and R. M. Souto, Eur. J. Sci. Theol., 9 (2013) 189.
36. J. R. Macdonald, Solid State Ionics 13 (1984) 147.
37. M. Romas, A. I. Munoz, D. Mareci, C.V. Vidal, S. Curteanu and D. Sutiman, Chem. Pap., 68 (2014) 1066.
38. E. Rudolph, A. Färbinger and J. König, Food Addit. Contam. A, 29 (2012) 1849. 39. M. A. Heckman, J. Weil and E. G. de Mejia, J. Food Sci., 75 (2010) R77. 40. K.-H. Chou and L. N. Bell, J. Food Sci., 72 (2007) C337.
41. F. N. Grosser and R. S. Gonçalves, Corros. Sci., 50 (2008) 2934.
42. T. Fallavena, M. Antonow and R. S. Gonçalves, Appl. Surf. Sci., 253 (2006) 566. 43. M. Romaş, D. Mareci, S. Curteanu and D. Sutiman, Rev. Roum. Chim., 58 (2013) 11. 44. E. Espinoza-Vázquez and F. J. Rodríguez-Gómez, RSC Adv., 6 (2016) 70226.
45. G. Bolat, A. Cailean, D. Sutiman and D. Mareci, Rev. Roum. Chim., 59 (2014) 53. 46. F. S. de Souza, R. S. Gonçalves, J. Braz. Chem. Soc., 25 (2014) 81.