D
ynamic
soD
mulching
anD
use
of
recycleD
amenDments
to
increase
bioDiversity
,
resilience
anD
sustainability
of
intensive
organic
fruit
orcharDs
anD
vineyarDs
Guidelines for
economic assessment
Università Politecnica delle Marche
P.zza Roma 22, 60121 Ancona, Italy
Fruit Growing Institute
Ostromila12 str. 4004, Plovdiv, Bulgaria
Laimburg Research Centre
Laimburg 6 I-39051 Vadena (BZ), Italy
Research Institute of Horticulture
(Instytut Ogrodnictwa)
Al. 3 Maja 2/3 96-100 Skierniewice, Poland
CTIFL French technical Interprofessional Centre for Fruits and Vegetable
22 rue Bergère, 75009 Paris, France
FiBL - Research Institute of Organic Agriculture
Ackerstrasse 113, 5070 Frick, Switzerland
University Hohenheim
Evaluating innovations for a sustainable intensification
of organic orchard and vineyard
The aim of this handbook of experimental guidelines is to provide a common method for the analyses performed in the framework of the DOMINO project on practices for sustainable management of organic apple orchard and vineyard under field conditions.
Analysis refer to the economic assessement of the introducted practices including both the produciton costs and the ecosystem services value.
Indication are provided for activities run either in structured experimental stations as well as in farm trials.
DOMINO PROJECT
A. Assessment of economic value of ecosystem services
1. Definitions
Ecosystem services are defined as services provided by the natural environment that benefit people. They provide outputs or outcomes that directly and indirectly affect human wellbeing, and these considerations can link well to taking an economic approach. United Nations’ Millennium Ecosystem Assessment (MA) strongly supported the use of an ecosystems approach and provided a substantial evidence base for policy-making. The MA set out a typology of ecosystem services under four broad headings:
1) Provisioning Services are ecosystem services that describe the material or energy outputs from ecosystems. They include food, water and other resources;
2) Regulating Services are services that ecosystems provide by acting as regulators eg. regulating the quality of air and soil or by providing flood and disease control;
3) Cultural services are nonmaterial benefits people obtain from ecosystems through spiritual enrichment, cognitive development, reflection, recreation, and aesthetic experience, including, e.g., knowledge systems, social relations, and aesthetic values;
4) Supporting services are services that are necessary for the maintenance of all other ecosystem services. Some examples include biomass production, production of atmospheric oxygen, soil formation and retention, nutrient cycling, water cycling, and provisioning of habitat.
These services are:
1) Provisioning Services
• Food: Ecosystems provide the conditions for producing food. Food comes principally from managed agro-ecosystems, thus this is an important and general parameter to evaluate how new management practices can affect such service.
• Raw materials and Medicinal resources: Ecosystems provide a great diversity of materials for construction and fuel (e.g. wood, biofuels), or plant materials useful for nutraceutical purposes (e.g. essential oils) that are directly derived from wild and cultivated plant species. Ecosystems and biodiversity provide many plants used as traditional medicines as well as providing the raw materials for the pharmaceutical industry.
2) Regulating Services
• Waste and waste-water treatment: Through the biological activity of microorganisms in the soil, most waste is broken down. Thereby pathogens (disease causing microbes) are eliminated, and the level of pollution is reduced. On the other side, organic wastes can provide nutrients that would be lost or could potentially pollute the environment. Ecosystems such as wetlands filter both human and animal waste and act as a natural buffer to the surrounding environment. • Pollination: Insects and wind pollinate plants and trees which is essential for the development of fruits, vegetables and seeds. Animal pollination is an ecosystem service mainly provided by insects (sometimes also by some birds and bats) which can be promoted or not by orchard management.
3) Cultural services
• Recreation and mental and physical health: Walking and playing sports in green space is not only a good form of physical exercise but also lets people relax. The role that green space plays in maintaining mental and physical health is increasingly being recognized, despite difficulties of measurement.
• Aesthetic appreciation and inspiration for culture, art and design: Language, knowledge and the natural environment have been intimately related throughout human history. Biodiversity, ecosystems and natural landscapes have been the source of inspiration for much of our art, culture and increasingly for science.
4) Supporting services
• Soil nutrients: Because many provisioning services depend on soil fertility, the cycle of nutrients, particularly nitrogen, influences indirectly human well-being in many ways.
• Photosynthesis: Photosynthesis, besides representing the basis for plant growth and production, produces oxygen necessary for most living organisms.
2. Methodology
2.1 Perception of ecosystem services
To perform the qualitative assessment of the potential impacts of DOMINO innovative orchards management on the ecosystem services listed above, we need to ask the project partners and the farmers involved in the project, at least those that are also hosting trials, to provide an initial evaluation of the innovation/s introduced in the orchard by the project. This will be done by filling the following checklist of services having in mind to answer to the following question:
The assessment shall be done first considering the current management practices (baseline) applied in the orchard. Then, the same assessment shall be done for each specific management innovation, with reference to the baseline.
The following quality scores shall be used to fill the table:
++ Potential significant positive effect
+ Potential positive effect
0 Negligible effect
- Potential negative effect
-- Potential significant negative effect
Category Baseline Innovation 1 Innovation 2 Innovation 3 Innovation 4
Organic
baseline Cover crop Interrow materialsRecycled Row living mulch covering the rowTemporary net Provisioning services
Food
Raw materials and Medicinal resources
Regulating services
Pest
Disease
Water purification and waste treatment Pollination
Cultural Services
Recreation & tourism
Aesthetic value
Supporting Services
Soil nutrients Photosynthesis
Innovative orchards management: from Organic Baseline (organic INPUT sostitution)
The assessment shall be performed at the beginning of the trial (before) to collect the perception
of the impact of the innovations, and at the end of the trial, to collect the real assessment of
their impact. This will provide a sort of sociological appraisal of the ecoservices and will be used in conjunction with the following biophysical evaluation.
2.2 Biophysical evaluation of ecosystem services
The following table contains the parameters planned to be measured in the different trials that will be used to assess the value of each ecoservice. The table will be filled answering to the following questions: What to measure? How to measure? (both already defined) How to assess on the basis of biophysical information?
Here we suggest a workflow that will address these questions. The three stages in this process (focused on biophysical aspects) are: 1) quantification of ecosystem services, 2) mapping of ecosystem services, and 3) assessment of ecosystem services where biophysical assessment is one part of a wider integrated assessment in addition to social and economic parts.
Category Major parameters Possible parameters
Provisioning services
Food Yield and fruit quality data Raw materials and Medicinal
resources Yield and other data related to interrow and row productions
Regulating services
Pest Damage/control data, biodiversity data, soil coverage/ weeds control data
Disease Damage/control data, biodiversity data
Water purification and waste
treatment Local fertilizers use data
Pollination Yield/flowering, Biodiversity data
Cultural Services
Recreation & tourism
Dedicated short questionnaire
for visitors to the fields/trials Accessibility of quiet areas for resident population. (n°)
Area that could be used for private gardening or for sitting in, playing in and en-joying (e.g. agritourism) (n°)
Aesthetic value
Dedicated short questionnaire
for visitors to the fields/trials Aesthetic pleasure deriving from the presence of other plants in the orchard (score from 1 to 5)
Supporting Services
Soil nutrients Nutrients dynamic in soil, soil analyses
B. Assessment of economic value of ecosystem services
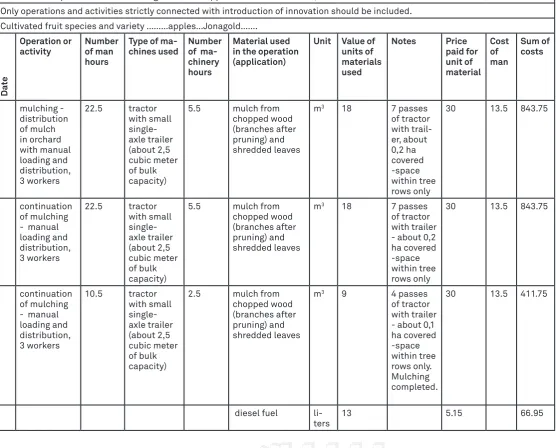
[image:11.595.24.581.325.773.2]The main objective of the task is to compare the production costs due to the innovation practices introduced by the project in the different producing regions participating in the DOMINO Project. It will be done by collecting the data from the trial sites and comparing them with the baseline (current organic) practices. The following tables (available also in Excel format) can be used as template and the data included as examples to be followed for collecting the data during the season.
Table 1 - Example for innovation of organic mulch application on an area of 0,5 ha.
Only operations and activities strictly connected with introduction of innovation should be included. Cultivated fruit species and variety ………apples…Jonagold…….
D
ate
Operation or
activity Number of man hours
Type of
ma-chines used Number of ma-chinery hours
Material used in the operation (application)
Unit Value of units of materials used Notes Price paid for unit of material Cost of man Sum of costs mulching - distribution of mulch in orchard with manual loading and distribution, 3 workers 22.5 tractor with small single-axle trailer (about 2,5 cubic meter of bulk capacity)
5.5 mulch from
chopped wood (branches after pruning) and shredded leaves
m3 18 7 passes
of tractor with trail-er, about 0,2 ha covered -space within tree rows only
30 13.5 843.75
continuation of mulching - manual loading and distribution, 3 workers 22.5 tractor with small single-axle trailer (about 2,5 cubic meter of bulk capacity)
5.5 mulch from
chopped wood (branches after pruning) and shredded leaves
m3 18 7 passes
of tractor with trailer - about 0,2 ha covered -space within tree rows only
30 13.5 843.75
continuation of mulching - manual loading and distribution, 3 workers 10.5 tractor with small single-axle trailer (about 2,5 cubic meter of bulk capacity)
2.5 mulch from
chopped wood (branches after pruning) and shredded leaves
m3 9 4 passes
of tractor with trailer - about 0,1 ha covered -space within tree rows only. Mulching completed.
30 13.5 411.75
diesel fuel
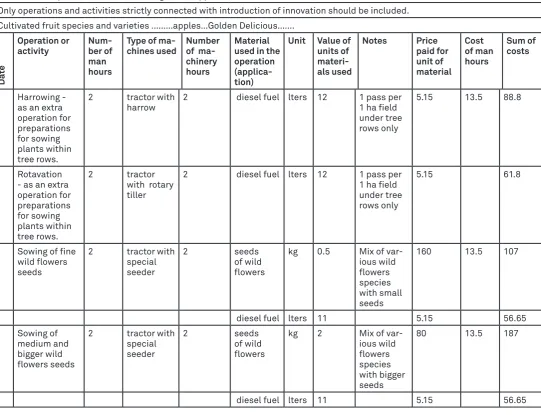
Table 2 - Example for innovation of living mulch application on an area of 1,0 ha.
Only operations and activities strictly connected with introduction of innovation should be included. Cultivated fruit species and varieties ………apples…Golden Delicious…….
D
ate
Operation or
activity Num-ber of man hours
Type of
ma-chines used Number of ma-chinery hours
Material used in the operation (applica-tion)
Unit Value of units of materi-als used Notes Price paid for unit of material Cost of man hours Sum of costs Harrowing - as an extra operation for preparations for sowing plants within tree rows.
2 tractor with
harrow 2 diesel fuel lters 12 1 pass per 1 ha field
under tree rows only
5.15 13.5 88.8
Rotavation - as an extra operation for preparations for sowing plants within tree rows. 2 tractor
with rotary tiller
2 diesel fuel lters 12 1 pass per
1 ha field under tree rows only
5.15 61.8
Sowing of fine wild flowers seeds
2 tractor with
special seeder
2 seeds
of wild flowers
kg 0.5 Mix of
var-ious wild flowers species with small seeds
160 13.5 107
diesel fuel lters 11 5.15 56.65
Sowing of medium and bigger wild flowers seeds
2 tractor with
special seeder
2 seeds
of wild flowers
kg 2 Mix of
var-ious wild flowers species with bigger seeds
80 13.5 187