R E S E A R C H A R T I C L E
Open Access
Surveillance on the endemic of Zika virus
infection by meteorological factors in
Colombia: a population-based spatial and
temporal study
Lung-Chang Chien
1, Ro-Ting Lin
2, Yunqi Liao
3, Francisco S. Sy
1and Adriana Pérez
4*Abstract
Background:Zika virus (ZIKV) infection is a pandemic and a public health emergency. It is transmitted by mosquitoes, primarily theAedesgenus. In light of no treatment currently, it is crucial to develop effective vector control programs to prevent the spread of ZIKV infection earlier when observing possible risk factors, such as weather conditions enhancing mosquito breeding and surviving.
Methods:This study collected daily meteorological measurements and weekly ZIKV infectious cases among 32 departments of Colombia from January 2015–December 2016. This study applied the distributed lag nonlinear model to estimate the association between the number of ZIKA virus infection and meteorological measurements, controlling for spatial and temporal variations. We examined at most three meteorological factors with 20 lags in weeks in the model.
Results:Average humidity, total rainfall, and maximum temperature were more predictable of ZIKV infection outbreaks than other meteorological factors. Our models can detect significantly lagged effects of average humidity, total rainfall, and maximum temperature on outbreaks up to 15, 14, and 20 weeks, respectively. The spatial analysis identified 12 departments with a significant threat of ZIKV, and eight of those high-risk departments were located between the Equator and 6°N. The outbreak prediction also performed well in identified high-risk departments.
Conclusion:Our results demonstrate that meteorological factors could be used for predicting ZIKV epidemics. Building an early warning surveillance system is important for preventing ZIKV infection, particularly in endemic areas.
Keywords:Zika virus infection, Meteorological factor, Nonlinear lagged effect, Spatial analysis
Background
Zika virus (ZIKV) was first discovered in 1947 from a monkey in the Zika Forest of Uganda. The first human cases of ZIKV infection were reported in 1954 in Nigeria. The first major outbreak of ZIKV occurred in 2007 in the Federated States of Micronesia. The first outbreak in continental South America occurred in 2015 in Brazil, followed by other countries in South America and Asian [1–3]. Now, it has spread to 70 countries with
about 1.5 million people infected with ZIKV [4]. Medical research has verified that ZIKV infection is associated with the development of microcephaly in fetuses or babies and Guillian–Barré syndrome in adults [5–7].
ZIKV is a mosquito-borne viral, mainly transmitted by Aedes aegypti and Aedes albopictus mosquitoes, which also transmit dengue and chikunkunya virus [8]. No cure or vaccine for ZIKV is available so far. Current treat-ment for ZIKV infection is focused only on treating symptoms like fever, pain, and rash. The development and mass production of ZIKV vaccine might take up to 5 years [9, 10]. While none of the vaccines has been proven to prevent ZIKV infection yet, global and local public health authorities have urged the prevention
* Correspondence:adriana.perez@uth.tmc.edu
4Department of Biostatistics and Data Science, School of Public Health,
Austin Campus, The University of Texas Health Science Center at Houston-UTHealth, 1616 Guadalupe, Suite 6.300, Austin, TX 78071, USA Full list of author information is available at the end of the article
ZIKV infection by focusing on mosquito control activ-ities and preventing mosquito bite [10,11].
The transmission of mosquito-borne diseases is associ-ated with weather change [12]. Although Aedes aegypti and Aedes albopictus mosquitoes have different biting and feeding features, the survival ofAedes mosquitoes is highly associated with meteorological factors, such as temperature and humidity [13,14]. Warmer temperature can shorten the incubation period of Aedes aegypti, which might increase the speed of the virus [13]. Previ-ous studies have explored the potential influence of wea-ther change on the abundance of Aedes mosquitoes or ZIKV [15, 16]. Hence, the risk of ZIKV transmission is characterized by its sensitivity to weather change.
Previous studies have mapped potential hot spots for the ZIKV transmission [17–19]. Regions with a higher risk of ZIKV epidemic usually had warmer temperature because mosquitoes are more abundant and active [19]. To build an early warning and prevention system, a quantitative measure to capture the risk of new ZIKV epidemic linked to different meteorological factors is needed. However, a full understanding of such dynamic correlations is currently lacking.
With the same transmission as Dengue fever, which has been investigated to have a nonlinear lagged associ-ation with weather conditions as well as spatial vulner-ability in high-risk areas [20], we supposed that ZIKV infection also had the same scenario. Thus, in this study, we proposed a spatial nonlinear model to investigate the association among ZIKV infection, weather conditions, and lagged effects. We analyzed weekly ZIKV infection cases and meteorological factors among 32 departments in Colombia, from January 2015–December 2016. We hypothesized that a higher risk of ZIKV infection might occur when specific meteorological measurements were observed at most 5 months earlier. The study aims were to: 1) Approximate how early ZIKV infection can be monitored based on meteorological factors; 2) Estimate the highest risk of ZIKV infection behind observed me-teorological measurements; 3) Identify high-risk areas of ZIKV infection after controlling for meteorological fac-tors. The ultimate goal of this study was to establish an early warning system for ZIKV infection, which can be flexibly applied in different epidemic areas.
Methods
Study area
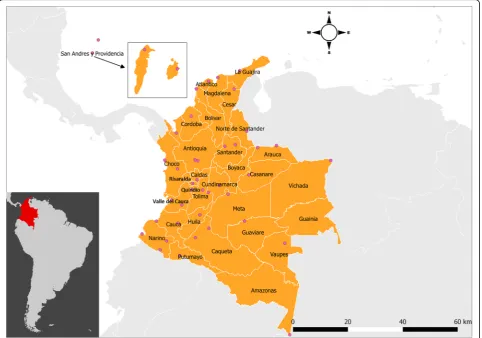
Colombia, the third-most populous country in Latin America is located in the northwest of South America, and has 32 departments (see Fig.1) [21]. The population of Colombia is concentrated in the Andean highlands and the Caribbean coast. The equator is across the southern Colombia. The climate in Colombia is characterized as tropical, so its warm and isothermal weather condition is
a favorable environment for breeding mosquitoes. The Amazon Rainforest, located in the southeastern Colombia, is one of the main habitats of mosquitoes.
Data source
We collected data on ZIKV infection records and me-teorological information in Colombia from 2015 to 2016. These data were collected at the department level, which was analogous to the state level in the United States. Weekly data on ZIKV infection counts of each depart-ment were reported to the Colombian National Institute of Health through the public health surveillance system. These data were publicly available at Epidemiological Bulletin in Colombia ( http://www.ins.gov.co/buscador-eventos/Paginas/Vista-Boletin-Epidemilogico.aspx). Note that Bogota, the capital of Colombia, only has available ZIKV infection records in 2015 and the first 2 weeks of 2016. A report mentioned that ZIKV infection in Bogota is not endemic because it is at 2640 m above the sea level, and most cases were immigrant cases from people travel-ling to Bogota from Cundinamarca [22]. Hence, we com-bined the data from Bogota and Cundinamarca before the 2nd week of 2016. Meteorological factors were obtained from 42 monitoring stations across 32 departments. These data were retrieved from the Weather Underground (https://www.wunderground.com/).
Meteorological measurements
similarly. The weekly average values for the department of all previous indicated meteorological factors were es-timated by average across monitoring stations. For the other 19 departments with only one monitoring station, weekly measurements were derived from maximum, minimum, and average values of corresponding me-teorological variables per week. For the three depart-ments without monitoring station, we applied the local tispace kriging method again to impute their me-teorological measurements from the other departments. Afterward, we applied a geodetector method in those imputed data, which is a technique to preliminarily de-tect whether covariates are responsible for an outcome measurement [23].
Statistical model
In order to take both nonlinear lag effects of meteoro-logical measurements and spatial correlation into ac-count simultaneously, we applied the distributed lag nonlinear model (DLNM) for assessing the nonlinear as-sociations among ZIKV infection, weather, and temporal lagged effect [25]. We assumed that the number of ZIKV
infection cases at time t in department d, denoted by Ydt, followed a Poisson distribution POI(μdt), where E(Ydt) =φμdt, and φ is a scale parameter. The DLNM could be regarded as a generalized linear model with additional cross-basis functions, which are interactions constituted by a nonlinear function for a covariate and a nonlinear function for a lag variable; hence, this study established the DLNM in a quasi-Poisson model frame-work to take possible over-dispersion into account:
logðμdtÞ ¼αþ X
CB Weatherð ;lagÞ þf tð Þ þfspatð Þd
þoffset; t¼1;…;104;d¼1;…;32;
[image:3.595.58.541.89.427.2]a spline of a meteorological factor and another b-spline of the lag factor. The spatial function fspat(d) describes spatial local heterogeneity of ZIKV incidence by applying Markov random fields, which follow a normal distribution with mean Xd0∈Ωdfspatðd
0Þ=N
d and variance σ2d=Nd [26]. In details, we defined a
neighborhood as an adjacent department d′ sharing a
part of boundaries of another department, and a neighborhood set containing all adjacent departments
around the department d was denoted by Ωd. The
number of adjacent departments in Ωd was denoted
by Nd, and fspat(d′) is the spatial estimated effect in each adjacent department. Thus, the mean can be regarded as the average neighborhood effect. In addition, σ2d is the original variance in the department
d, whereas the number of neighbors diluted its spatial
variance. The spatial function can evaluate the remaining variation of ZIKV incidence not explained by meteorological factors. Each department can obtain a spatial estimate from the spatial function, which can be interpreted as the logarithm of relative risk (logRR) in ZIKV of a department compared to the average of all departments. In the other words, the exponential spatial estimate can account for the excessive relative risk (RR) of ZIKV incidence in each department over the whole country. Moreover, the spatial function can detect each department as a high-risk area of ZIKV in-fection after controlling meteorological factors as the 95% confidence interval (CI) of the spatial estimate significantly greater than zero. We adopted a 3-step model selection to choose the best model. In details, the first step is to determine the best model with only one cross-basis function from 14, 16, 18, and 20 lags by comparing the quasi Akaike information criterion (QAIC) among them. The second step is to determine
the best cross-basis function with different degrees of freedoms from 3 to 7 in each meteorolgocial measure-ment. The third step is selecting the best model with one, two, and three cross-basis functions. Eventually, the best model has three cross-basis functions for
average humidity, total rainfall, and maximum
temperature with 20 lags. The chosen criterion in each step depends on the smallest QAIC (data not shown but available upon request from the authors). Each es-timated cross-basis function was transformed into RR, while the reference levels varied in different meteoro-logical factors. Diagnosis of the residuals were conducted via plots of autocorrelations and partial autocorrelations, and distribution of residuals over time.
Sensitivity analyses were performed by increasing the length of lags to 22 and 24 in the final model. We calcu-lated the similarity of estimated cross-basis function with the first 21 lags (including lag 0) by using the RV-coefficient, which is a correlation measurement between two matrices [27]. Like the general correlation coefficient, a higher RV-coefficient close to one reflects more similar-ity between two matrices with the same dimension. We also applied the analysis of variance to compare the spatial estimates to see whether the change of lag in cross-basis functions could affect the spatial function.
Data management of this study was carried out in SAS V9·3 (SAS Institute Inc., Cary). Data imputation and model fitting were conducted in the R software, version 3·3·3 (R Development Core Team, 2011). All maps were generated in QGIS v2·18·2. Statistical significance was determined by a type I error level of 0·05.
Results
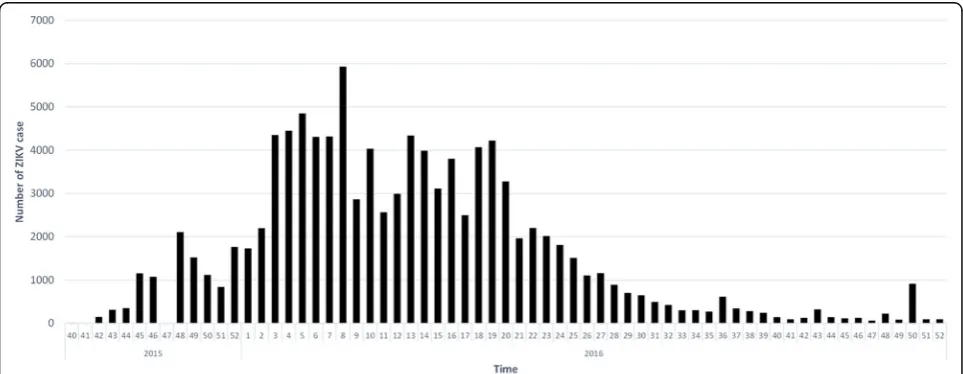
Figure 2 shows the weekly number of ZIKV infection cases since the 40th week of 2015, which is the first
[image:4.595.57.539.526.713.2]week of the official report published by Epidemiological Bulletin in Colombia. Table1 presents the total ZIKV in-fection cases and the crude incidence of ZIKV inin-fection among 32 departments in Colombia. Norte de Santander, Santander, and Valle del Cauca had over 10,000 identified ZIKV infection cases from 2015 to 2016, but the three highest crude incidence rates per 10,000 populations were observed in Arauca (120.96), Casanare (140.21), and the islands of San Andres and Providencia (192.37), which were also the only three areas with over 100 ZIKV infec-tion cases per 10,000 populainfec-tions. The initial covariate de-tection reveals that most meteorological measurements are significantly responsible for the incidence of ZIKV
infection (p-values < 0.0001), except for maximum hu-midity (p-value = 0.5288) and maximum wind speed (p-value = 0.1193), see Additional file 1: Table S2.
[image:5.595.61.541.260.723.2]Defining the lowest average humidity as the reference level by 31·29%, Fig. 3a shows a great surf around the top and right corners, indicating a large RR of ZIKV in-fection increased across all average humidity levels within 10 lagged weeks. The outbreak of ZIKV infection can be observed at least after 4 weeks (Fig. 4a), and up to 15 weeks (Fig. 4c) based on significant RRs. Longer lagged weeks with a large RR can be detected more likely in higher average humidity. Table2shows that the estimated cross-basis function of average humidity can
Table 1The total ZIKV infection cases, population, and crude incidence of ZIKV infection among 32 departments in Colombia, 2015̶2016
Department # of cases Weekly casesa Population Crude incidence (per 10,000 population)
Amazonas 293 2.50 46,950 62.41 Antioquia 2286 19.54 5,601,507 4.08 Arauca 1851 15.82 153,028 120.96 Atlantico 6743 57.63 2,112,001 31.93 Bolivar 1893 16.18 1,836,640 10.31 Boyaca 374 3.20 1,210,982 3.09 Caldas 384 3.28 898,490 4.27 Caqueta 1212 10.36 337,932 35.87 Casanare 3944 33.71 281,294 140.21 Cauca 265 2.26 1,182,022 2.24 Cesar 1596 13.64 878,437 18.17 Choco 22 0.19 388,476 0.57 Cordoba 2931 25.05 1,462,909 20.04 Cundinamarca 5083 43.44 9,007,373 5.64 Guainia 17 0.15 18,797 9.04 Guaviare 195 1.67 56,758 34.36 Huila 6963 59.51 1,001,476 69.53 La Guajira 673 5.75 655,943 10.26 Magdalena 3180 27.18 1,136,819 27.97 Meta 4301 36.76 713,772 60.26 Narino 59 0.50 1,498,234 0.39 Norte de Santander 10,512 89.85 1,208,336 87.00 Putumayo 538 4.60 237,197 22.68 Quindío 397 3.39 518,691 7.65 Risaralda 1385 11.84 859,666 16.11 San Andres and Providencia 1146 9.79 59,573 192.37 Santander 10,069 86.06 1,913,444 52.62 Sucre 1843 15.75 762,263 24.18 Tolima 7079 60.50 1,312,304 53.94 Valle del Cauca 26,908 229.98 4,052,535 66.40 Vaupes 0 0.00 19,943 0.00 Vichada 41 0.35 44,592 9.19
a
Fig. 3Relative risk (RR) of Zika virus (ZIKV) infection along lagged weeks and three selected meteorological measurements in terms of (a) average humidity, (b) logarithm of total rainfall, and (c) maximum temperature
[image:6.595.64.540.88.245.2] [image:6.595.55.540.274.694.2]detect the largest significant RR by 4·16 (95% CI = 2·41, 7·19) at lag 11 when the average humidity reached 92·14%. The whole variation of RR at lag 11 in Fig. 4b reveals that all levels of average humidity had the RR of ZIKV infection significantly greater than one after 11 weeks.
Figure3bpresents a peak in the top corner, indicating that a higher RR may more likely happen in a shorter lag and a large amount of rainfall. Defining no rainfall as the reference level, besides present week (lag 0), the most significant outbreak of ZIKV infection (RR = 1·60; 95% CI = 1·26, 2·02) can be observed after 1 week, when the weekly total rainfall accumulated to 437·03 mm (i.e., e6·08), see Table 2. Similar as average humidity, higher total rainfall was more related to ZIKV infection outbreak. However, we also observed some significant lagged effects in both high and low total rainfall. For instance, Fig. 4e reveals that the largest RR of ZIKV infection at lag 8 was 1·29 (95% CI = 1·07, 1·55) under an extreme rainfall over 1000 mm. The significant lag effect can last up to lag 14 when the weekly total rainfall increased at least 3·10 mm (i.e., e1·13), see Fig. 4f.
As the reference level was defined at 80 °F, the vari-ation of RR computed from the estimated cross-basis
function of maximum temperature reveals two peaks (Fig.3c), demonstrating that a longer lag effect may hap-pen in both lower and higher maximum temperatures. The shortest lagged effect was observed at lag 3 when the maximum temperature was between 90·61 °F and 100·43 °F (i.e., 32·56 °C and 38·02 °C), see Fig.4g. Table2 reveals that the largest RR (3·01; 95% CI = 1·61, 5·63) was observed at lag 19 when the maximum temperature in-creased to 108·00 °F (i.e., 42·22 °C). The longest lagged ef-fect can be detected at lag 20 when the maximum temperature was lower than 69·38 °F, see Fig.4i.
[image:7.595.55.539.99.415.2]Figure 5 depicts the map from the estimated spatial function, revealing a larger logRR located in the middle or south Colombia. Seventeen of the 32 departments were positively associated with ZIKV infection, but only 12 of them can be defined as ZIKV high-risk areas be-cause of a 95% CI strictly greater than zero. The result indicates that, after controlling for the meteorological effects, 37·50% (12 out of 32) of departments still showed a significantly higher risk for ZIKV infection. These departments are more likely located closer to the equator. More specifically, if Colombia was split by lati-tude at 6°N, only four high-risk departments (Sucre, Magdalena, Norte de Santander, and San Andres) were located above 6°N, and the other eight high-risk
Table 2The largest relative risk of ZIKV infection in average humidity, total rainfall, and maximum temperature by lagged week
Lag (Week)
Average humidity (%)
Largest RR
95% Confidence interval
Logarithm of total rainfall (mm)
Largest RR
95% Confidence interval
Maximum temperature (°F)
Largest RR
departments were all located between the equator and 6°N. The significantly lowest risky area was Sucre (logRR = 0·53, 95% CI = 0·07, 0·99), which is the northeast high-risk department in the mainland territory of Colombia. The significantly highest risky area was Casanare (logRR = 3·34; 95% CI = 2·91, 3·76). The equator was across three high-risk departments, including Putu-mayo, Caqueta, and Guaviare.
We compared the results of lag 0–20 weeks with those at lag 22 and 24 weeks and found similar estimates in the three cross-basis functions (data not shown). The RV-coefficients were all at least 0·93, suggesting that despite using a longer length of lags, the first 21 estimates (i.e., lag 0 to lag 20) were still similar to the original results from 20 lags. Moreover, no obvious change was found in the estimated spatial function when considering more lags (all p-values > 0·99). Compared to the final model with 20 lags, the mean square errors were 0·06 and 0·12 when using lag 22 and 24 weeks in the DLNM, respectively. The change of lag period did not affect the identification of high-risk areas. The spatial esti-mates kept the same order among these departments.
Discussion
This study established an early warning model to project the outbreak of ZIKV infection when a weather condition
with a certain measurement was observed up to 20 weeks ago. We proposed a modeling selective process to deter-mine which meteorological factors should be used. The approach can be applied flexibly in other countries with high prevalence of ZIKV infections, where meteorological measurements are available. Our findings suggest that, averaged humidity, total rainfall, and the maximum temperature can adequately detect a ZIKV infection out-break at least 3 months in advance. Since the proposed model can examine significantly positive lagged effects and geographic impacts, our findings will be applicable in the development of a ZIKV surveillance system by govern-mental agencies.
[image:8.595.59.540.88.381.2]respond; (2) meteorological factors are the main predic-tors of the disease outbreak, and they are easily accessible and manageable. Hence, using meteorological factors to monitor ZIKV infection outbreaks is reasonable, and it provides an earlier warning because ZIKV and dengue virus have the same mode of transmission pathway by mosquito vectors.
The significant association between ZIKV infection and meteorological factors is expected because vector-borne diseases are highly correlated with weather condi-tions, while advanced scientific evidence still needs further investigation besides this study. A study in Brazil verified a more direct linkage between daily rainfall, humidity, and mean temperature and ZIKV infection with human incubation and infectious periods of 4·8 days and 3·6 days, respectively [31]. Rainfall, humidity, and temperature were also used in developing a risk assess-ment model for calculating the ZIKV risk index [32].
Some of the significant high-risk departments identified by the spatial function in Colombia were separately inves-tigated in previous studies. The earliest research in Colombia estimated the basic reproductive number for the ZIKV outbreak in San Andres and Girardot (in the de-partment of Cundinamarca) using data from September 2015 to January 2016 [33]. The estimated cumulative incidence rates of ZIKV infection in over a half of munici-palities in Sucre and Tolima showed a high incidence rate of over 100 cases per 100,000 population [34,35]. We fur-ther verified that all these areas were at high risk for ZIKV infection after controlling for weather conditions.
This study is the first epidemiological research cover-ing a two-year period among several epidemic areas of ZIKV in Colombia. We conducted a population-based study to examine significant associations between ZIKV infection risk and weather change. Because there is cur-rently no curative treatment and vaccine for ZIKV infec-tion, preventing mosquito bites at individual level and vector control measures at local, regional, and national level remain the high priority for disease prevention and control. If we can estimate a potential hazard of ZIKV infection earlier by using existing measurements, there will be more time to prepare and develop effective pre-vention and control programs for vector-borne diseases. Building a surveillance system that can investigate the occurrence of ZIKV infection earlier will be useful in strengthening the efficiency of vector control programs. In addition, using meteorological measurements in a surveillance system is convenient and fast because they are usually measured at monitoring stations hourly and daily. Our research findings may not exactly reflect the same scenario in other areas, such as Brazil or Puerto Rico, because the result of the data analysis may be af-fected by the completeness of data, the length of the study period, and the geographic location of the study
area. However, this study proposed a systematic ap-proach to conduct the surveillance system, which can be modified easily and flexibly in the other areas.
Using the DLNM for monitoring ZIKV infection by meteorological factors provides a systematic method for building an early warning system. The nonlinear lag ana-lysis and spatial anaana-lysis might be applied separately, while a study has proven the importance of including a spatial function in the DLNM [36], especially in control-ling possible overestimation when analyzing spatiotem-porally imputed data. Practically, this approach can be adopted in any epidemic area when time series data are available. Since ZIKV has been verified to cause micro-cephaly in neonates [37], pregnant women living in high-risk areas should be alarmed in advance. Micro-cephaly can be detected as early as 18–20 weeks gesta-tion [38]. Therefore, as the outbreak of ZIKV infection can be monitored in advance, the outbreak of micro-cephaly might be detected earlier.
There are some limitations in this study. First, the study period was still too short because the first official report of ZIKV infection cases was not released until the 40th week of 2015 in Colombia. We believe that, like dengue fever, there should be a seasonal variation in Zika fever, while it was unlikely to have better control in the statistical model with only 2-year data. Second, the Zika fever might be under-reported, especially in the beginning of October in 2015. During that period, all departments might not have developed a systematic process to diagnose and report ZIKV infection. Third, the reported ZIKV infection data did not differentiate between those acquired locally and those acquired from other countries. We were also unable to verify whether a case was caused by mosquito bites or transmitted by sexual activities. Fourth, the interaction term between the nonlinear smoothing function of time and the spatial function is unavailable in the model, so a real spatiotemporal pattern was unable to be investigated in this study. Further research will need to incorporate sociodemographic, interpersonal/intrapersonal charac-teristics to the current model to better understanding other potential factors associated with ZIKV infection. Fourth, measurement bias may exist because the meteorological measurements were collected at the community level rather than the individual level. Lastly, this study may have an uncertainty of causal influence because of ecological design. Conducting individual-based analyses may overcome the two limitations if individual-level data are available.
evaluate whether prevention, which is carried out in a certain period of time suggested by our model, can significantly reduce the number of ZIKV infection, espe-cially in high-risk areas.
Conclusions
ZIKV is a pandemic and a public health emergency. Unlike other vector-borne diseases, it does not only affects people who are bitten by mosquitoes, but also increase the risk of microcephaly in infants born to infected mothers. Although ZIKV infection and microcephaly are not associ-ated with high mortality, it may cause unpredictable med-ical cost and family burden. Since we do not have curative treatment and vaccine for ZIKV, it is important to develop an early warning system that is efficient and inexpensive to implement because of better technique of monitoring wea-ther change. We anticipate that the proposed approach in this study can be applied in other highly endemic areas. We believe that the more data collected in the future can help build a better early warning system for ZIKV infection.
Additional file
Additional file 1:Table S1.Moran’s I test statistic of meteorological measurements.Table S2Q-statistic for meteorological measurements before and after imputations.Figure S1Scatter plots of Zika virus infection cases versus each of 15 meteorological measurements. (DOCX 907 kb)
Abbreviations
CI:Confidence interval; DLNM: Distributed lag nonlinear model; logRR: Logarithm of relative risk; RR: Relative risk; ZIKV: Zika virus
Acknowledgments
We thank the Instituto Nacional de Salud for the publication of their epidemiological bulletin on a weekly basis, which allowed us to extract the data.
Funding
The study was supported by the University of Nevada, Las Vegas and The University of Texas Health Science Center at Houston-UTHealth, and the Michael & Susan Dell Foundation [Grant 8075] during the writing of this manuscript.
Availability of data and materials
Please contact the corresponding author for data requests.
Authors’contributions
LCC designed the study, analyzed the data, and wrote the manuscript. RTL wrote the manuscript. YL collected and analyzed the data. FS edited and revised the manuscript. AP collected the data and revised the manuscript. All authors read and approved the final manuscript.
Ethics approval and consent to participate
The study protocol was approved by the Institutional Review Board at the University of Texas Health Science Center at Houston-UTHealth (IRB No. HSC-SPH-16-0959).
Consent for publication Not applicable
Competing interests
The authors declare that they have no competing interests.
Publisher’s Note
Springer Nature remains neutral with regard to jurisdictional claims in published maps and institutional affiliations.
Author details
1Department of Environmental and Occupational Health, School of
Community Health Sciences, University of Nevada, Las Vegas, 4505 S. Maryland Parkway, Las Vegas, NV 89154, USA.2Department of Occupational Safety and Health, China Medical University, No.91 Hsueh-Shih Road, Taichung 40402, Taiwan.3Department of Biostatistics and Data Science,
School of Public Health, Houston Campus, The University of Texas Health Science Center at Houston-UTHealth, 1200 Pressler Street, Houston, TX 77030, USA.4Department of Biostatistics and Data Science, School of Public
Health, Austin Campus, The University of Texas Health Science Center at Houston-UTHealth, 1616 Guadalupe, Suite 6.300, Austin, TX 78071, USA.
Received: 25 October 2017 Accepted: 4 April 2018
References
1. Dyer O. Zika virus spreads across Americas as concerns mount over birth defects. BMJ. 2015;351:h6983.
2. Kindhauser MK, Allen T, Frank V, Santhana RS, Dye C. Zika: the origin and spread of a mosquito-borne virus. Bull World Health Organ. 2016; 94(9):675–686C.
3. Petersen LR, Jamieson DJ, Powers AM, Honein MA. Zika virus. N Engl J Med. 2016;374(16):1552–63.
4. Zika virus microcephaly and Guillain-Barré syndrome.http://apps.who.int/ iris/bitstream/handle/10665/254507/zikasitrep2Feb17-eng.pdf. Accessed 6 May 2017.
5. Cao-Lormeau VM, Blake A, Mons S, Lastere S, Roche C, Vanhomwegen J, Dub T, Baudouin L, Teissier A, Larre P, Vial A, Decam C, Choumet V, Halstead S, Willison HJ, Musset L, Manuguerra J, Despres P, Fournier E, Mallet H, Musso D, Fontanet A, Neil J, Ghawche F. Guillain-Barre syndrome outbreak associated with Zika virus infection in French Polynesia: a case-control study. Lancet. 2016;387(10027):1531–9.
6. Cauchemez S, Besnard M, Bompard P, Dub T, Guillemette-Artur P, Eyrolle-Guignot D, Salje H, Van Kerkhove MD, Abadie V, Garel C, Fontanet A, Mallet H. Association between Zika virus and microcephaly in French Polynesia, 2013–15: a retrospective study. Lancet. 2016;387(10033):2125–32. 7. de Araújo TVB, Rodrigues LC, de Alencar Ximenes RA, de Barros
Miranda-Filho D, Montarroyos UR, APL d M, Valongueiro S, MdFPM d A, Souza WV, Braga C, SPB F, Cordeiro MT, Vazquez E, Di Cavalcanti Souza Cruz D, CMP H, LCA B, de Silva Castanha PM, Dhalia R, ETA M-J, CMT M. Association between Zika virus infection and microcephaly in Brazil, January to may, 2016: preliminary report of a case-control study. Lancet Infect Dis. 2016; 16(12):1356–63.
8. Musso D, Gubler DJ. Zika Virus. Clin Microbiol Rev. 2016;29(3):487–524. 9. Lin HH, Huang LM, Zika WSC. Virus molecular biology and perspectives for
vaccine development: a review. J Nurs Res. 2017;25(1):3–6. 10. Mosquito control: can it stop Zika at source?http://www.who.int/
emergencies/zika-virus/articles/mosquito-control/en/. Accessed 6 May 2017. 11. Zika Virus Vaccines.
https://www.niaid.nih.gov/diseases-conditions/zika-vaccines. Accessed 6 May 2017.
12. Patz JA, Epstein PR, Burke TA, Balbus JM. Global climate change and emerging infectious diseases. JAMA. 1996;275(3):217–23.
13. Watts DM, Burke DS, Harrison BA, Whitmire RE, Nisalak A. Effect of temperature on the vector efficiency of Aedes aegypti for dengue 2 virus. Am J Trop Med Hyg. 1987;36(1):143–52.
14. Descloux E, Mangeas M, Menkes CE, Lengaigne M, Leroy A, Tehei T, Guillaumot L, Teurlai M, Gourinat AC, Benzler J, Pfannstiel A, Grangeon J, Degallier N, Lamballerie XD. Climate-based models for understanding and forecasting dengue epidemics. PLoS Negl Trop Dis. 2012;6(2):e1470. 15. Monaghan AJ, Morin CW, Steinhoff DF, Wilhelmi O, Hayden M, Quattrochi
DA, Reiskind M, Lloyd AL, Smith K, Schmidt CA, Scalf PE, Ernst K. On the seasonal occurrence and abundance of the Zika virus vector mosquito aedes aegypti in the contiguous United States. PLoS Currents 2016; doi:
https://doi.org/10.1371/currents.outbreaks.50dfc7f46798675fc63e7d7d a563da76.
Assessing seasonal risks for the introduction and mosquito-borne spread of Zika virus in Europe. EBioMedicine. 2016;9:250–6.
17. Bogoch II, Brady OJ, Kraemer MUG, German M, Creatore MI, Brent S, Watts AG, Hay SI, Kulkarni MA, Brownstein JS, Khan K. Potential for Zika virus introduction and transmission in resource-limited countries in Africa and the Asia-Pacific region: a modelling study. Lancet Infect Dis. 2016;16(11):1237–45.
18. Bogoch II, Brady OJ, Kraemer MUG, German M, Creatore MI, Kulkarni MA, Brownstein JS, Mekaru SR, Hay SI, Groot E, Watts A, Khan K. Anticipating the international spread of Zika virus from Brazil. Lancet. 2016;387(10016):335–6.
19. Caminade C, Turner J, Metelmann S, Hesson JC, Blagrove MSC, Solomon T, Morse AP, Baylis M. Global risk model for vector-borne transmission of Zika virus reveals the role of El Nino 2015. Proc Natl Acad Sci U S A. 2017;114(1): 119–24.
20. Chien L-C, Impact YH-L. Of meteorological factors on the spatiotemporal patterns of dengue fever incidence. Environ Int. 2014;73(0):46–56. 21. World population prospects, the 2017 revision.https://esa.un.org/unpd/
wpp/. Accessed 4 Apr 2017.
22. Cundinamarca inicia carrera en contra del zika.http://www.eltiempo.com/ archivo/documento/CMS-16504651. Accessed 6 May 2017.
23. Wang JF, Li XH, Christakos G, Liao YL, Zhang T, Gu X, Zheng XY. Geographical detectors-based health risk assessment and its application in the neural tube defects study of the Heshun region, China. Int J Geogr Inf Sci. 2010;24(1):107–27.
24. Liang D, Kumar N. Time-space kriging to address the spatiotemporal misalignment in the large datasets. Atmos Environ (1994). 2013;72:60–9. 25. Gasparrini A, Armstrong B, Kenward MG. Distributed lag non-linear models.
Stat Med. 2010;29(21):2224–34.
26. Kindermann R, Snell JL. Markov random fields and their applications. Providence, R.I: American Mathematical Society; 1980.
27. Robert P, Escoufier Y. A unifying tool for linear multivariate statistical methods. The RV-coefficient. J R Stat Soc C-Appl. 1976;25(3):257–65. 28. McGough SF, Brownstein JS, Hawkins JB, Santillana M. Forecasting Zika
incidence in the 2016 Latin America outbreak combining traditional disease surveillance with search, social media, and news report data. PLoS Negl Trop Dis. 2017;11(1):e0005295.
29. Phung D, Talukder MRR, Rutherford S, Chu C. A climate-based prediction model in the high-risk clusters of the Mekong Delta region, Vietnam: towards improving dengue prevention and control. Tropical Med Int Health. 2016;21(10):1324–33.
30. Shi Y, Liu X, Kok S-Y, Rajarethinam J, Liang S, Yap G, Chong C-S, Lee K-S, Tan S, Chin C. Three-month real-time dengue forecast models: an early warning system for outbreak alerts and policy decision support in Singapore. Environ Health Perspect. 2016;124(9):1369–75.
31. Lourenco J, Maia de Lima M, Faria NR, Walker A, Kraemer MU, Villabona-Arenas CJ, Lambert B, Marques de Cerqueira E, Pybus OG, Alcantara LC, Recker M. Epidemiological and ecological determinants of Zika virus transmission in an urban setting. bioRxiv. 2017.
32. Li X, Liu T, Lin L, Song T, Du X, Lin H, Xiao J, He J, Liu L, Zhu G. Application of the analytic hierarchy approach to the risk assessment of Zika virus disease transmission in Guangdong Province. China BMC Infect Dis. 2017; 17(1):65.
33. Rojas DP, Dean NE, Yang Y, Kenah E, Quintero J, Tomasi S, Ramirez EL, Kelly Y, Castro C, Carrasquilla G, Halloran ME, Longini IM. The epidemiology and transmissibility of Zika virus in Girardot and San Andres island, Colombia, September 2015 to January 2016. Euro Surveill. 2016;21(28)https://doi.org/ 10.2807/1560-7917.ES.2016.2821.2828.30283.
34. Rodriguez-Morales AJ, Patiño-Cadavid LJ, Lozada-Riascos CO, Villamil-Gómez WE. Mapping Zika in municipalities of one coastal department of Colombia (Sucre) using geographic information systems during the 2015-2016 outbreak: implications for public health and travel advice. Int J Infect Dis. 2016;48:70–2.
35. Rodriguez-Morales AJ, Galindo-Marquez ML, García-Loaiza CJ, Sabogal-Roman JA, Marin-Loaiza S, Ayala AF, Lozada-Riascos CO, Sarmiento-Ospina A, Vásquez-Serna H, Jimenez-Canizales CE, Escalera-Antezana JP. Mapping Zika Virus infection using geographical information systems in Tolima, Colombia, 2015-2016. F1000Res. 2016;5:568.
36. Chien L-C, Guo Y, Li X, Yu H-L. Considering spatial heterogeneity in the distributed lag non-linear model when analyzing spatiotemporal data. J Expos Sci Environ Epidemiol 2016. doi:https://doi.org/10.1038/jes.2016.62. 37. Cordeiro MT, Pena LJ, Brito CA, Gil LH, Marques ET. Positive IgM for Zika
virus in the cerebrospinal fluid of 30 neonates with microcephaly in Brazil. Lancet. 2016;387(10030):1811–2.