Rochester Institute of Technology
RIT Scholar Works
Theses
Thesis/Dissertation Collections
5-1-2003
Utilization of statistical tools to identify assignable
causes of variability and model performance of a
wet electrostatic precipitator
Jennifer Wuotinen
Follow this and additional works at:
http://scholarworks.rit.edu/theses
This Thesis is brought to you for free and open access by the Thesis/Dissertation Collections at RIT Scholar Works. It has been accepted for inclusion
in Theses by an authorized administrator of RIT Scholar Works. For more information, please contact
Recommended Citation
Utilization of Statistical Tools to Identify Assignable Causes of
Variability and Model Perfonnance of a Wet Electrostatic
Precipitator
A Thesis Project Prepared by
Jennifer Wuotinen
for
Rochester Institute of Technology
Kate Gleason College of Engineering
Industrial Engineering Department
May 2003
This graduate thesis project is submitted in partial fulfillment of the requirements of the
degree of Master of Science in Industrial and Manufacturing Engineering.
Approved by:
_
Merrilee Ritter, Committee Member
3~3
/
I
Date
Graduate Project Reproduction Permission Statement
Permission Granted
Title of Graduate Project:
Utilization of Statistical Tools to Identify Assignable
Causes of Variability and Model Perfonnance of a Wet Electrostatic Precipitator
1,
Jennifer Wuotinen, hereby grant permission to the Wallace Library of the Rochester
Institute of Technology to reproduce my thesis in whole or in part. Any reproduction will
not be for commercial use or profit.
Table
of
Contents
Table
ofFigures
ii
Abstract
1
Problem
Statement
3
Literature Review
Introduction
Wastewater
Treatment
6
Combustion/Incineration
17
Air Pollution
Control Equipment
23
Statistical Tools
36
Scope
ofW
ork42
Methodology
43
Results
49
Discussion
63
Conclusions
68
Table
of
Figures
Graphs
Graph 1
Graph 2
Graph 3
Graph 4
Graph 5
Graph 6
Graph
7
Graph 8
VIP Plot
ofModel
1
50
Histogram
ofData
Appendix
Actual
vsPredicted Data for Model 1
52
Actual
vsPredicted Data for Model 5
56
Actual
vsPredicted Data
for Model 5 New Data Set
57
Actual
vsPredicted Data Model
6
60
Main
Effects Plot
62
Correlation Graph
ofAirflow
vsDraft Pressure
66
Charts
Chart 1
Chart 2
Tables
Table
1
Table
2
Table
3
Table 4
Table
5
Table
6
Table 7
X-bar
chart53
MR
chart.. .5344
Table
ofOriginal
12
variablesTable
of4
Additional
variables47
Designed Experiment
Correlation
Matrix
for Model 1
.47
51
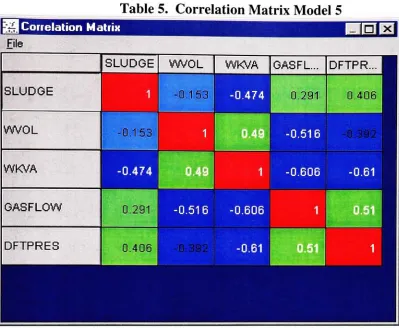
Correlation Matrix
for Model
5
58
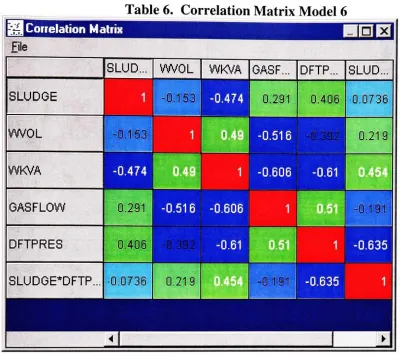
Correlation
Matrix
for Model
6
59
Appendices
Appendix A
Raw Data
Appendix B
PLS Printout
ofModel
1
Appendix
C
Control Charts
1
and2,
Histogram Graph 2
Appendix
D
Model
2,
Steady
State
Appendix
E
Model
3,
Non-steady
State
Appendix F
Model
4,
16 Predictor Variables
Appendix
G
Model
5,
Optimum
Model
with4
Predictors
Appendix H
Model
6,
Interactions
Abstract
The King's
Landing
Wastewater Treatment Plant
treats
industrial
sewerwastewaterfrom
nearly 200 manufacturing buildings for Eastman Kodak
Company
located
atKodak Park
in
Rochester,
NY.
The
averagethroughput
for
the
facility
is 28
million gallons of wastewater perday
(MGD)
anddischarges
the
resulting
effluentinto
the
Genesee River.
Through
a series ofphysical, chemical,
andbiological
treatment processes,
materials are removedfrom
the
wastewaterand sludgeis
produced.The
sludgeis
conveyedthrough
abelt
pressfor
dewatering
priorto
incineration. The dewatered
sludgeis
sentto
a multiplehearth
incinerator
with asecondary
combustion chamber/afterburnerfor
thermal
treatment.
From
the
combustion andincineration
process,
off-gases are produced.Therefore,
airpollution control equipmentis
neededto treat the
gas stream.At King's
Landing,
aninduced draft fan
creates negative pressurethrough the
hearth along
with a series of air pollution control equipment(APCE)
consisting
of a quenchchamber,
condenser/scrubber, venturi,
entrainmentseparator,
and a wet electrostatic precipitator(WESP).
This
equipment capturesthe
componentsin
the
air streamthrough
processessuch asgas
saturation,
causticneutralization,
and electron particle collection.The WESP
is
adevice
that
is
usedfor fine
particle collectionin
the
range of1
micron orless.
Upon entereing
the unit, the
particlesin
the
gas stream are given a charge.The
particles accumulate on
the
surface ofthe
WESP
and areperiodically flushed
out andcollected
in
the
wash water.The efficiency
of particles removedfrom
the
WESP
canbe
indirectly
correlatedby
the
power value measuredin
KVA (kilovolt
amps).As
the
powerdecreases,
the
particulate collectionefficiency is lowered.
This is due
to the
increased
resistance
in
the
system.Although
there
is
systemvariability,
the
King's
Landing
multiple
hearth
incinerator
and associated air pollution control equipment operatesin
accordance withallrelevant environmental standards.
The
purpose ofthis thesis
is
to
use statistical analysistools to
determine
the
significantvariables
that
affectthe
performance andefficiency
ofthe
WESP.
The WESP is
the
last
unit
in
the
airpollution control equipment(APCE)
system atKing's
Landing.
Since
the
The WESP
is subjectto the
mostvariability from
the
upstreamAPCE
as well asthe
combustion process
because it is
the
final
unitin
the
system.This
paper will analyze multiple predictorvariables,
which areinputs into
the
WESP,
anddetermine
their
significance onthe
powerreading
that
will serve asthe
responsevariable.Key
Words:
Wet
electrostaticprecipitator, variability,
air pollution controlequipment,
Problem Statement/Definition
Prior
to
January
2002,
the
WESP
power,
measuredin
kilovolt
amps(KVA),
averagedconsistently
above1.3 KVA for
arolling hour
average(RHA).
After
this
time,
the
KVA
readings
have occasionally been
observedto
be in
the
rangeof0.8-1.2
KVA
for
the
rolling hour
average.The
exactrootcauseofthis
variationin
the
powerreading is
unknown.Because WESP
poweris
anindirect
measure ofWESP
performance and collectionefficiency,
it is important
to
obtain anunderstanding
ofthe
causesfor
variation andfluctuations.
Hypothesis
statement:The variability
observedin
the
KVA levels
ofthe
WESP
is
adirect
result ofan assignable causedue
to
anupstream process variable.The
hypothesis
willbe
tested
by
analyzing
the
following
processvariables,
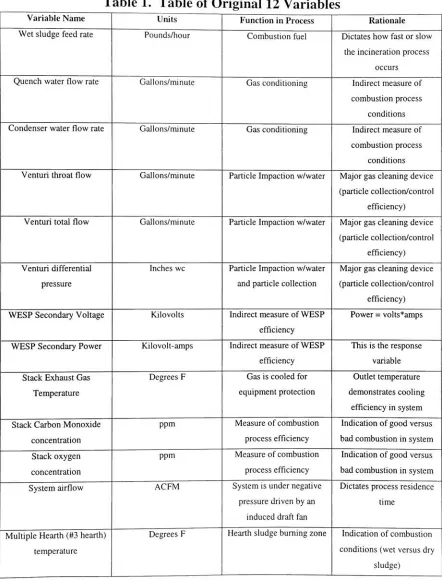
which are presumed predictor variables: wet sludgefeed
rate,
quench waterflow,
condenser waterflow,
venturiflow,
venturidifferential
pressure,
WESP secondary
voltage,
stack exhaust gastemperature,
gas airflow
rate,
exhaust stack carbonmonoxidelevel,
exhaust stack oxygenlevel,
and"3"
Literature
Review
Introduction
Four
topics
for
this thesis
were reviewedin
the
literature. These
areas were wastewatertreatment,
incineration
andcombustion,
airpollution controlequipment,
and statisticalanalysis
tools.
These
searchesincluded literature
summariesof related areas of researchandpublished
technical
papers.A
literature
search was performedto
gatherinformation
to
provide a general overviewofthe
wastewatertreatment process,
including
aspects ofthe physical, chemical,
andbiological
treatment technologies.
Another
searchwas performedto
investigate
the
incineration
and combustionprocesses,
as well as
to
gatherdetailed information regarding
the
construction andoperation of amultiple
hearth incinerator (MHT).
The
analysisofthe
air pollution control equipmentincluded
information regarding
condenser/scrubbers,
venturioperations,
andthe
basic
principles of anentrainmentseparator.
An
additional search was performed onthe
fundamentals
of a wetelectrostaticprecipitator
(WESP).
The
statistical analysistools that
were researchedincluded
descriptive
statistics,
exploratory
data
analysis, plots,
any
applicabletransformations, linear
regression,
correlation,
hypothesis tests,
and multivariate regressionanalysis(Partial Least Squares
Wastewater
Treatment
General
Overview
ofPhysical,
Biological,
Chemical
Treatment
Technologies
Incineration
Combustion
Multiple
Hearth
Incinerators
Combustion
Fundamentals
Air Pollution
Control
Statistical
Condenser
Scrubber
Venturi
Linear
Regression
(Correlation/
Significance
Test)
I
Entrainment
Separator
Wet
Electrostatic
Precipitator
(WESP)
Multivariate
Analysis
Wastewater Treatment
Process Literature Review
The
wastewatertreatment
processatthe
King's
Landing
Wastewater Treatment Plant
(KLWWTP)
represents atypical
layout
and processflow
found
throughout
mostindustrial
wastewatertreatment
systems.The
processes canbe divided into four
categories of
pretreatment,
primary
processing,
secondary
processing,
and sludgemanagement.
The
following
paragraphs willdiscuss
a general overview ofthe physical,
chemical,
andbiological
treatment technologies
usedto treat the
industrial
wastewateratKodak Park. Most
ofthe
information
representedin
this
literature
review wasderived
from internal Kodak
procedures and wastewatertreatment textbooks.
A flow
chart ofthe
KINGS LANDING INDUSTRIAL
WASTE
WATER
PURIFICATION
PLANT
linqUABf
mm
Tt UUIDAIT TIUTHIKT
tSU'U
tO MOB COIITKBl-5
Tmcicmn ifcanDiHf nufiGi
r&r.
On
SLPECE HSIDINGT4NK1
TQ
EIUUBTSrCl
Kodak Diagram
Pretreatment
Process
The
averagedaily
flow for
the
King's
Landing
Wastewater Treatment
plantis 28
milliongallons per
day
(MGD). The industrial
wastewateris
conveyedto the treatment
plantthrough
a 42"main
trunk
line
referredto
asthe
"penstock."The
flow
enters abar
screenandgoes
into
anaerated gritchamber.The
purposeof pretreatmentis
to
remove coursematerialand
large
debris from
the
wastewater.Bar Screen: The
wastewaterflows
through
the
bars
whileamechanical rakedevice is
m
Davis
andCornwell,
p.365
Aerated
Grit Chamber: The
wastewaterflows from
the
bar
screen andinto
the
gritchamber.
Air is
suppliedto the
bottom
ofthe
chamberto
agitatethe
water andhelps
to
settle out
heavy
particulate matter.The velocity
through the
chamberis
controlledby
aeration rather
than
flow
rate(Kodak
procedures).Dense
material such assand, glass,
silt,
andpebbles are considered"grit"
(Davis
andCornwell,
p.365). The
gritis
settledout prior
to
entering
the
primary
treatment
plantto
protect mechanical equipment(pumps)
from damage due
to
wearfrom pumping
solid materialin
the
wastewater.The
physical
dimensions
ofthe
aerated gritchamber atKing's
Landing
are60 ft
long
x13
ft
v. ^WUILCII.WVI
JJJIVUW, 'U 111 KJI :_... II
j
VI llillin"'.! vUl'H. ItlVi^i,Influent
Diet
Davis
andCornwell,
p.367
The
settled gritis
collectedinto 5 V-shaped hoppers
and sentto
ahydro-gritter
wherethe
grit
is dewatered. The
gritis
collected and sentto
the
multiplehearth incinerator
(MM)
for
treatment.
From
the
aerated gritchamber, the
wastewaterflows
to
ahydroelectric
turbine
wherethe
velocity head
ofthe
flow is
reducedasit descends along
averticaldrop
of
125 feet. In
the
process ofreducing
the velocity, the
energy is
absorbed and electricpower
is
producedand used on-site.From
the
turbine,
the
flow
enters a chamber whereliquid lime is
addedfor
pH adjustment.From
this
chamberthe
flow
entersthe
primary
Primary
Treatment
The
primary
treatment
process consists ofthe
equalizationbasin,
three
primary
clarifiers,
and
the
neutralization system.Equalization
Basin
The
flow from
the turbine
enters adistribution
chamberthat
contains aflow-equalization
baffle. The
equalizationofflow is necessary
to
minimize variationsin
the
wastewatervelocity
andconcentration andto
makethe treatment
process occur at a constant rate(Davis
andCornwell,
p.369). In
addition,
there
arethree
sluice gatesusedto
regulatethe
flow into
the
primary
clarifiers.Primary
Clarifiers
The
wastewaterentering
the
primary
clarifiersis
screenedfor large debris but light
organicsuspended solidsstill remain
(Davis
andCornwell,
p.372). Some
ofthese
suspended solidscan
be
removedby
gravity,
giventheproper retentiontime
for
settling.The
flow into
the
primary
clarifiers entersfrom
the
bottom
through the
center well whereis it evenly distributed
throughout the
basin. Settled
sludgeis
collectedonthe
bottom
ofthe
basin
and swept with a sweeper armto
a sludge pit.Floating
solids arecollectedwith an upper sweeper arm(skimmer)
anddeposited into
a unit calledthe
"scum
trough."The
sludge collected
from
the
primary
clarifiersis
sentto the
sludgeholding
tanks,
which willbe discussed in detail in
the
sludge management section.The King's
Landing
Treatment
Plant
containsthree
primary
clarifiers.Two
ofthe three
are130
ft in diameter
andhave
acapacity
of1.5 MG.
The
third
unitis 140 ft in diameter
andhas
acapacity
of1.9 MG. A
TO Suit
\
U
m- 2.3ni
MvhSprocketswithShear Pin Hubsand Clutches
, ft
tot
>
rJMr
-4
YrrfA
A0.5m
\KM
1
waterLevel .ipfQi5
*J*
10.5m
Adjustable
WftifS
/
iI
_jr_
CZiJ {"C
<sl
0.6
m(minJDrive Cham
bwaist
Take
Up
dcPlh50 X 150ram FlighusSpaced
Approximately
Pivoting
Flight 3m onCenters
Effluent
\
Tt X*
Davis
andCornwell,
p.373
Neutralization
System
The
neutralizationsystem consists of a covered chamber andtunnel
with associatedpiping.
The
neutralizationchamber acceptsprimary
effluentfrom
the
clarifiers wherecaustic addition
takes
placeto
neutralizethe
pH.The
neutralizationchannelconveysthe
wastewater
from
the
neutralization chamberto the
low lift
well.The
channelis 230 ft
long
and containsbaffles
for
chemicalmixing
andflow
control(Kodak
procedures).The
low lift
well contains5 low lift
pumps each rated at10,000
gallons perminute(GPM).
The
low
lift
wellsendsthe
flow
to the
high lift
well wherethe
secondary
treatment
process
begins
(Kodak
procedures).Secondary
Treatment
The
secondary
treatment
processconsists of atrickling
filter
and activatedsludge process(aeration
basin
andsecondary
clarifier)
operating in
series.The
purpose ordesign basis
for
secondary
treatmentis
to
increase
the
removal ofbiochemical
oxygendemand
(BOD)
andprovide
further
removal ofthe
suspended solidsin
the
wastewater(Davis
andCornwell,
pg.374).
The
measurementofBOD in
the
plantinfluent
andplanteffluentTrickling
Filters
The
wastewateris
pumpedinto
the
top
ofthe
trickling
filters from
the
high
lift
pumps anddistributed
throughout
the
unit.The
trickling
filters
areusedto
stabilizethe
wastewaterfeed
to the
aerationbasins
by
minimizing
the
variationsin BOD loading. The
trickling
filters
consistof a68 ft diameter
structurecovered with afiberglass dome
to
minimizeodors.
The
structureis
filled
withPVC packing
mediato
adepth
of21
ft (Kodak
procedures).
Bacteriological
growthis
formed
onthe
surfacesofthe media,
whichfeed
on
the
organic mattercontainedin
the
secondary
plantinfluent
stream andthus
reducethe
BOD. The
effluentfrom
the
filters
entersthe
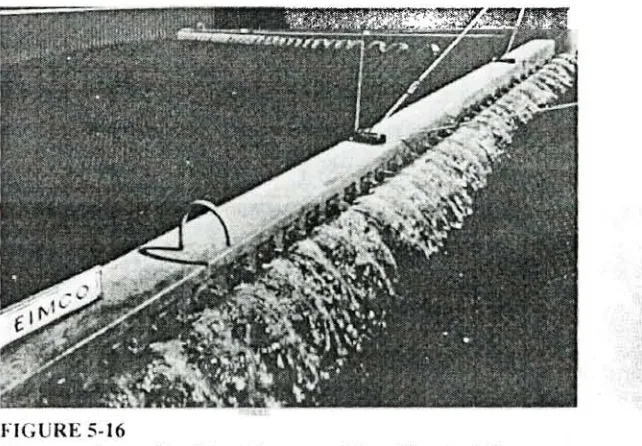
aerationbasins. Two diagrams
of atrickling
filter
are shownbelow.
FIGURE
5-16
i. i: i. ?/-> _? _fr^-~.../"!.. ;.*_i /-->
[image:18.540.111.432.306.529.2]Rotary
Distributor
\
Inlet
Waste-tt tt tt n 7X /. n 7V'A"7<
Sione
Media
i System'
p
c?
o
e? c?\^
h<3
Davis
andCornwell,
p.375
Activated
Sludge Process
The
activatedsludge process consists ofaerationbasins
andsecondary
clarifiers.The
term
"activated
sludge"refers
to
aprocesswherethe
wastewateris
mixed withbiological
sludgecontaining
microorganisms andis
agitated andaerated(Davis
andCornwell,
p.382). The
process ofinjecting
airinto
the
wastewaterin
the
aerationbasins
suppliesthe
necessary
oxygenfor
the
microorganismsto
digest
the
organic material asfood. As
the
size of
the
microorganismsincreases, they
flocculate
together to
form
a masscalled"activated
sludge"(Davis
andCornwell,
p.382). The
activated sludgemixtureis
sentto
the
secondary
clarifierto
be
settledout and returnedfor
reuseto the
aerationbasin. More
activated sludge
is generally
producedthan
is
requiredfor
this
process.The secondary
sludgeprocessing
willbe discussed further in
the
Sludge Management Section. The
KLWWTP
contains3
aerationbasins
each130
ft
squareand25
ft deep. With
anoperating level
of20
ft,
the
volumeof wastewater and sludgeis nearly 2,530,000
gallonsFI
At
(A
Davis
andCornwell,
p.382
Secondary
Clarifiers
The
clarifiersreceivethe
flow
from
the
aerationbasins
anddistribute it from
the
centerwell.
The velocity
ofthe
flow is limited
by
the
clarifier andbaffle design
suchthat the
biological
floe
will settle out of suspensionto the
bottom
ofthe
clarifier.The
settledsludge
is
collected,
andaportionofit is
returnedto the
aerationbasin. The remaining
excess sludge
is
sentto the
dissolved
airfloatation
(DAF)
chamberbefore
being
sentto
>
' '
'A
--.->
Return Sludge Lino
SludgeRemoval System
Davis
andCornwell,
p.403
Sludge Management
The
sludgefrom
the
primary
andsecondary
treatment
processesis
storedin
the
sludgeholding
tank
area.King's
Landing
uses4
sludgeholding
tanks
for
storage and sludgeblending.
Three
ofthe tanks
are50,000-gallon capacity
andthe
fourth
tank
has
a100,000-gallon
capacity (Kodak
procedures).Each
holding
tank
also contains a mixerto
keep
the
sludge agitated.The
sludge removedfrom
the
primary
clarifiersis
called"primary
sludge."
It is
removedfrom
the
clarifiers and sentto
the
holding
tanks
directly.
The
secondary
sludge(referred
to
as"activated
sludge")
is
taken
from
the
secondary
clarifiers
but
mustfirst be
thickened.
Prior
to
storagein
the
holding
tanks,
the
secondary
sludge enters
the
DAF
unit.The DAF
unitis
whereapolymeris
addedto thicken
the
sludge,
and airis forced
through
the
bottom
ofthe
unitto
pushthe
sludgeto the
top.
The
Both
types
ofsludgeareblended in
the
holding
tanksto
obtain anideal
percentage ofsolids
by
weight.Prior
to
incineration,
the
sludgeis
sentto
a mechanicalbelt
pressfor
dewatering.
The dewatered
sludge exitsthe
belt
press anddrops into
the
hearth
Incineration
and
Combustion
Literature Review
The
dewatered
sludge and gritfrom
the
wastewatertreatment
process atKing's
Landing
is
managedby
incineration.The
processofincineration is
a viable treatmentoptionfor
hazardous
wastebecause it
reducesthe total
volume andalsodetoxifies
the
waste(Theodore
andReynolds,
p.15). This
section willfirst
outlinethe
fundamentals
ofcombustion and
incineration
andwill provide an overview ofthe
construction and operation of a multiplehearth incinerator (MFfl).
Combustion
andIncineration
Combustion,
asdefined
by
the
North American Combustion
Handbook,
is "a
rapidcombination of oxygen witha
fuel,
resulting in
the
release of heat"(p.
1). Perfect
theoretical
combustion wouldimply
that
exactly
the
right
amount of air andfuel
arecombined such
that
no excess products remain.Lean
combustion meansthat too
much oxygen or excess airis
appliedresulting in
a shorterflame
and anoxidizing
condition(Reed,
p.4). Rich
combustionis
the
opposite condition wheretoo
muchfuel
and notenough oxygen
is
combinedproducing
alonger
flame,
otherwiseknown
as"incomplete
combustion"(Reed,
p.4). A
productofincomplete
combustionis
carbonmonoxide,
which
is
monitoredcontinuously
in
the
incineration
processto
determine
andensurethat
complete combustionhas
occurred.The
combustiontriangle
is
shownbelow. All
three
factors
in
the triangle
areimportant for
complete combustion(Kodak
procedures).Fuel
Heat
At
the
multiplehearth
incinerator,
the
fuel
sourceis
the
wastewater sludge andgrit, the
heat is
suppliedby
natural gasburners,
andthe
airis
supplied withthe
use ofafresh
airfan. Other important
principlesofcombustioninclude
mixing,
ignition,
andflame
stabilization.
Proper mixing
ofthe
air andfuel is
criticalto
ensureuniformity
in
the
combustion chamber.
Ignition
ofthe
fuel
occurswhenthe
supply
of airandheat
createan oxidation reaction and
the
fuel begins
to
releaseheat faster
than
the
heat is lost
to the
surroundings
in
the
chamber(Reed,
p.7). When
the
fuel
sourceis
ableto
maintainthe
combustion chamber
temperature
withoutthe
additionalheat
source,
it has
reached a stateofautogenous
burning
(Kodak
procedures).Flame
stabilizationis especially
criticalin
the
combustion processbecause it
canmakethe
difference between
efficient orincomplete
combustion.When
burning
sludge, this
is
anespecially
complicated processbecause
the
residencetime
(time it
takes to
completely
treat the
sludge)
is between
1-2
hours.
Many
factors
affectthe
stability
ofthe
flame
including
the
feed
rate ofthe
sludgeand
the
amount of available excess air andheat (Kodak
procedures).Incineration is defined
as"a
combustion processthat
uses rapidoxidation,
excessair,
andhigh
temperatures to
produceconditionsto
destroy
hazardous
wasteandits
constituents"(Gill
andQuiel,
p.1).
The
construction and operation of a multiplehearth incinerator is
discussed
below.
Multiple
Hearth
Incinerators
The
multiplehearth
incinerator
(MHT)
is
the
most commontype
usedfor
the
incineration
ofsludge
from both
municipal andindustrial
treatment
plants(Brunner,
p.95). The MHI
at
King's
Landing
wasinstalled
in 1975. It
consistsof aninsulated
steel shell andeightcompartments or
"hearths"
each
lined
withbrick refractory (Kodak
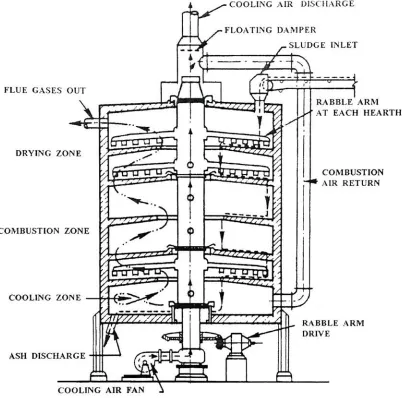
procedures).The
unitis 22 ft in
diameter
and spans4 floors
atthe
King's
Landing
facility. The figure below
FLUE GASES OUT
DRYING
ZONECOMBUSTION ZONE
COOLING ZONE
ASH DISCHARGE
COOLING AIR DISCHARGE
FLOATING DAMPER
SLUDGE INLET
*
RABBLE ARM AT EACH HEARTH
COMBUSTION AIR RETURN
RABBLE ARM DRIVE
COOLING AIR FAN
[image:25.540.70.472.42.440.2]2.2-2
Figure 2.2-1. Cross Section
ofaMultiple Hearth Furnace
EMISSION
FACTORS
1/95
The MHI is
comprised of6
maincomponents,
whichinclude
the
hearth
outershell,
rabble
system,
sludgefeed
system,
airsystems,
ashsystem,
andburner
systems(Kodak
procedures).
Outer Shell
The
outer shellis
comprisedof steel andcontains aninterior insulation
materialalong
with
the
8
refractory-linedhearths. The
shell maintainsthe
structuralintegrity
ofthe
incinerator. Each hearth is
given a numberandserves adistinct
purpose.The
"0"hearth
is
highest,
located
atthe
top
ofthe
unitandis
the
last hearth in
the
process wherethe
secondary
combustion chamberis
connected.The
"1" and"2"
hearths
areknown
asthe
"drying
zone"and
the
dewatered
sludge entersthe
incinerator
atthe
"1"hearth. The
drying
zonereleasesapproximately 10
pounds ofmoisturepersquarefoot
ofhearth
areaper
hour
(Brunner,
p.99). Hearths
"3,""4," and"5"
are referred
to
asthe
"burning
zone."
The
sludgebecomes ignitable
whenthe
moisture content reaches alevel less
than
30%
(Brunner,
p.99). The dried
sludge or "cake"drops down
to the
"3"hearth
andmay ignite
and
fall
to the
"4"hearth
to
bum. Hearths
"6" and"7"
are
the
ashcooling
zones andthe
ash
is
discharged
atthe
bottom
ofthe
"7"hearth
(Kodak
procedures).Each hearth
contains anumberofrabblearms
to
movethe sludge, cake,
or ashthroughout the
chamber.
Rabble
System
The
rabble systemis
comprisedof a center shaft connected withthe
rabble armslocated
in
eachhearth
and rotates at a given speed.The
shaft speedis
a critical parameterthat
either maintains or changes
the
burning
conditions withinthe
hearth. Each
rabble armcontains a set of
teeth
directed inward
or outwardto
facilitate
the
movementofmaterialfrom
onehearth
to the
next(Kodak
procedures).Sludge
Feed System
The dewatered
sludgetravels
from
the
belt
pressto the
sludgebunker
conveyor.The
is fed
directly
into
the
elevating
conveyor andinto
the
hearth (Kodak
procedures).The
sludge
feed
rateis
acritical componentin maintaining
the
burning
conditions withinthe
hearth. If
too
little
sludgeis
fed,
the
ideal
mixture offuel
and air willbe
compromised.Ash System
The
"7"hearth drops
the
ashinto
the
ash conveyor whereit is
conveyedto
acollectiontrailer.
The
ashconveyance systemis
pneumaticto
minimizehandling
issues
and sanitationconcerns(Kodak
procedures).Air
Handling
System
The
airhandling
systemis
comprisedof severalfans
usedfor
combustion air andcooling
effects within
the
hearth. The
combustion airfan
supplies airto
each natural gasburner
located in
the
hearths. The fresh
airfan
supplies airin
the
"3",
"5"and "7"hearths for
cooling
orto
aidthe
combustion process(Kodak
procedures).This fan
alsoprovidescooling
airto
assistduring
periods of shutdown.
The
over-fire air system suppliesairinto
the
"3"and "4"hearths
to
provideturbulence
for
propermixing
ofthe
fuel
andcombustion air.
Burner
System
The
hearth
contains12,
North-American
stylefuel
atomizationburners (Kodak
procedures).
There
are4 burners in
the
"0"hearth,
2 burners in
the
"2,""3," "5,"and "6"hearths. Natural
gasis
usedto
fuel
to the
burners
to
act asthe
heat
sourcein
the
MHI.
The
burners
are usedto
preheatthe
incinerator
and obtain propertemperature
during
startup.
They
alsoprovide additionalheat
to
dry
the
incoming
sludge andto
initiate
the
ignition
ofthe
sludge cake.The burners
alsoassistin
providing
a consistent source ofSecondary
Combustion Chamber
The secondary
combustion chamberis
also referredto
asthe
"afterburner."
The
purposeofan afterburner
is
to
enhancethe
destruction
efficiency
by
increasing
the
residencetime
ofthe
gas.The
afterburneris
asecondary form
of control wherehigh
temperatures aremaintained outside of
the
hearth
(Brunner,
p.80).
The
afterburneralso contains naturalgas
burners
to
maintain a set-pointtemperature
in
the
chamberandto
ensurecompleteAir
Pollution Control
Equipment Literature Review
Upon
incineration
ofthe
wastewatersludge,
the
offgasproducedfrom
the
multiplehearth
andsecondary
combustion chamberis directed
through
a series of airpollutioncontrol equipment
(APCE). The
purpose ofthe
APCE is
to
cleanthe
gasby
removing
particulate
matter,
acidcompounds,
andmetals.The
removal ofthe
particlesis
accomplished
through
particleconditioning.Particle conditioning
includes
methodsthat
increase
particle accumulation andpromotecondensation,
whichinclude
impaction
andadhesion of
the
particles(Bethea,
p.100). Impaction involves
the
collision ofthe
particles with a media
(typically
waterdroplets). Once
the
particle collisionoccurs,
adhesion of
the
two
compounds musttake
place.In
the
figure
below,
fiber
wouldbe
substitutedfor
waterdroplet in
this
case.stream
lines
porticl
IMPACTION
Bethea,
p.146
The
equipmentin
the
King's
Landing
process,
listed in
sequentialorder,
includes
the
quench
chamber, condenser/scrubber, venturi,
entrainmentseparator,
and wetelectrostatic precipitator
(WESP).
Upon exiting
the
WESP,
the
clean airstreamis
pulledthrough
aninduced
draft
(ID)
fan
anddirected
outto the
atmospherethrough
an exhauststack.
In
this section,
a general overview ofthe
APCE
willbe
given with more specificQuench Chamber.
The
purposeofthe
quench chamberis
to
coolthe
gasthat
exitsthe
combustion unit.
The
cooling
is
accomplishedby
using
aseries of waterspray
nozzlesdirected
inthe
streamofhot
gasflow
withinthe
chamber.The
gasflow
entersthe
chamber
from
the
top
and passesthrough the
water spray.Cooling
ofthe
gasis
necessary
to
protectthe
downstream
equipment,
aswellasincrease
particle accumulationby increasing
the
humidity
ofthe
gas streamto the
adiabatic saturation point(www.epa.gov,
p.97). When
aircontaining
a specifichumidity
andtemperature
passesoverastream of
water, the
water evaporatesandmixeswiththe
air stream.The
moisturecontentof
the
airincreases
whilethe temperature
decreases,
whichis due
to
the
latent
heat
of vaporization ofthe
evaporatedwater(Cengel
andBoles,
p.697). A
typical
exhaustgas
temperature
from
the
secondary
combustionchamber couldbe
in
the
rangeof1650F-1700
F.
The
quench reducesthat temperature to
a valueless
than
200
F
Condenser/Scrubber.
The
cooled gas stream exitsthe
quench and entersthe
condenser/scrubber unit.
The flow into
the
condenser enters atthe
bottom
andtravels
upward
through
a plastic corrugatedpacking
media.The packing
mediais
usedto
increase
the
liquid-to-gas
contactby
creating
a surfacefor
the
particles and waterdroplets
to
contact each other and collect.Above
the
packing
media,
is
a series of water nozzlesthat
spray downward into
the
gasstream and packing.The
water vaporis
condensedcontaining fine
particlesin
the
gasstreamandis
removedfrom
the
condenseroverflowline (Kodak
procedures).The remaining
gas streamexperiencesadditionalcooling
andJ
;S.Bethea,
p.281
Venturi:
The
venturiis
amechanicaldevice
that
removes particulate matterthrough
the
useofamechanical
damper.
By
restricting
the
diameter
ofthe
venturithroat
through the
andis atomized as aresult of
the
high-velocity
condition(Bethea,
p.305).
The high
differential
velocity
between
the
gas and atomizedwaterdroplets in
the
diverging
sectionof
the
venturi encouragesimpaction
ofthe
contaminants withinthe
droplets (Kodak
procedures).
Because
the
contaminates arecontainedwithin awaterdroplet,
collectionand removal
is
enhanced atthe
WESP. See figure below.
Pollutant
Laden
Gas
Venturi
'Throat"J?
%J*<.-.:*tf.:W^.
Liquid
Injection
Davis
andCornwell,
p.530
Entrainment Separator: The
gasflow
exitsthe
bottom
ofthe
venturiand entersthe
entrainmentseparatorat
the
bottom. The
purposeofthe
entrainment separatoris
to
remove entrained
metals,
particulate,
andwaterfrom
the
contaminatedairstreamandalso
to
decrease
the
velocity
ofthe
airstreamfrom
the
venturi(Kodak
procedures).The
top
ofthe
entrainment separatorcontains1-2
layers
of plasticdemister
packing,
usedto
collect andremove
large
waterdroplets. The
entire gas streamis
stillsaturated,
but
the
WESP
requiresfine
waterdroplets
for
optimal performance.Wet
Electrostatic Precipitator:
The
gasflow
exitsfrom
the
top
ofthe
entrainment%H*m
C$IK
HlflU
Tw*k<*
ttfpOft
ttVMM,
Hip. vottaqe
IfttultUr
Slrly
Gaiasi^,
/
ClteJr?4
WM*
Slit II
High
Tttrion
Cite
i
*?
Eltctred*
\t\
CO)
f
61*4cn
d-j
The basic
principle ofthe
WESP is
that
fine
particles are removedfrom
the
gas streamby
charging
the
gas with an electronicfield
that
promotes collectionofthe
particles ontothe
collection
tubes.
Next
the
particles areflushed from
the tubes
anddrained
out ofthe
WESP
andback into
the
wastewatertreatment
plant(Kodak
procedures).The
waterwash also maintains
the
saturationofthe gas,
which providesfurther cooling
andconditioning
(www.epa.gov,
p.5.2-8). The basic
constructionof aWESP
consistsofthe
outer
shell,
discharge
electrodes,
collecting
electrodes,
andinsulators
(Bethea,
p.209).
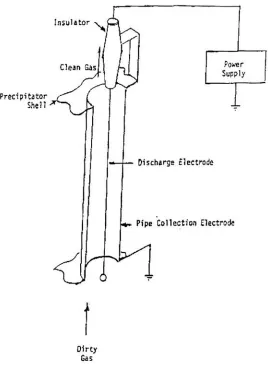
The King's
Landing
WESP design is
awirepipe,
meaning
that
a wire suspendedfrom
the
top
ofthe
unitandis
containedwithinthe
axisof along,
hexagonal
pipe and actsasthe
discharge
electrode(www.epa.com,
p.5.2-9). See figure
shownbelow.
DiodfiTEC
EJcCtro4
Principles
ofWESP
Operation
The WESP
uses electrical principles and concepts asthe
basis for
particle collection.The
gasstream enters
the
WESP
as a collection offinely
saturated gas particlestraveling
atarelatively low
velocity.The
waterdroplets
withinthe
gas stream containthe
contaminantInsulator
Precipitator
Shell
Power
Supply
T
Discharge electrode
* Pipe
Collection
Electrode [image:36.540.100.368.37.402.2]Dirty
GasFigure 5.2-1.
Cutaway
viewofWire-Pipe Electrostatic Precipitator (Reference
2).5.2-2 www.epa.gov,p.
5.2-2
Electric Field
Generation
The
electricfield
is
generatedthroughthe
use ofthe
corona-dischargeelectrodes and ahigh-voltage
powersupply
to the
WESP
The
strength ofthe
electricfield is
amajorcontributor
to the
performance ofthe
WESP
(www.epa.gov,
p.5.2-1).
The
electricfield
Corona Generation
The
coronais formed
by
the
electricfield
and representsthe
electrically
active region ofthe
gas stream(www.epa.gov.
p.5.2-4).
The
coronaitself is
a glowthat
may be
white,
bluish,
or reddishin
color andextendsinto
the
spacebetween
the
discharge
andcollection electrode
(Strauss,
p.234).Here,
the
electrons arestripped andtravel
in
onedirection,
leaving
the
remaining
positiveions
to
travel
in
anotherdirection. The
coronagenerates a
large
amountof ionsthat
possessthe
samechargeasthe
discharge
electrode.The ions
aretherefore
attractedto the
collection electrodelocated
acrossthe
hexagonal
space.
While
traveling
acrossthe space, the
ions become
attachedto the
incoming
particles
in
the
gas streamand migratetoward the
collectionelectrode(Strauss,
p.229).
Particle
Charging
The
particlespassthrough the
electricfield located between
the
discharge
and collectionelectrode.
The quantity
ofions
located in
this
regionmustbe
adequateenoughto
surround
the
entireregion of gasflow. The
moreions
the
areacontains, the
higher
the
probability
that
any individual
particle will collide with severalions
andbecome
charged(Bethea,
p.222). Once
the
particleis
charged,
it
migratestowards the
collectionelectrode.
Particle Collection: Once
the
particles arecharged and migrateto the
collectiontubes,
particlecollection
is
achieved.A
diagram
ofthe
collectiontubes, along
withthe
electronDischarge
Electrodes
Grounded
CollectorTubes
(a)
%ncziw*w. k.^k
Davis
andCornwell
p.532
:
|
Discharge
4-*
Ej
+Electrode
(+)
+- +
Collecting
- -
-Electrode
-m-:
\^
<->^
--(a)
(b)
C
IRK
6-36
-+
B
+Particle
Flushing:
Periodically
the
WESP initiates
aflushing
cycle with aduration
of several minutes.The
unit
is flushed
with waterto
removethe
collected particles onthe
collection walls.The
water
is
collected anddrained form
the
WESP
and returnedback
to the
influent
side ofthe
wastewatertreatment
process.WESP Parameters:
The
performance ofthe
WESP is
controlledby
applying
a certainlevel
ofvoltage.The
efficiency
ofthe
WESP
canindirectly
be
observedby
the
powerlevel
measuredin
kilovolt
amps(KVA). As
the
load
of particulatesincrease
to the unit, the
resistanceincreases
withinthe unit;
thus,
the
power andefficiency
arelowered (Rose
andWood,
p.177). As
arule ofthumb, increased
voltageandincreased
power yieldincreased
collection efficiency.
Although
higher
power and voltagegenerally leads
to
increased
efficiency,
if
too
much voltageis
applied,
excessivesparking
andarcing
will occur.When arcing
occurs,
damage
to the
unitis
inevitable,
along
with an associateddecrease
in efficiency (Rose
andWood,
p.186). The
voltagelevel
canbe
monitoredalong
withthe
powerandcurrent readings.The
King's
Landing
WESP
monitoredparametersdirectly
measurethe
secondary
voltage(in
kilovolts
KV)
anddisplay
the
calculatedsecondary
power(in kilovolt
ampsKVA).
Power
is
calculatedusing
the
equation:Power
=voltsX
ampshttp://www.dbugman.com/handbook/tscmh3.html.
Case Studies:
A few
case studieshave been
performedanalyzing
the
operation andefficiency
ofaWESP.
One
suchstudy
waspublishedin 1997 in
the
journal Environmental
International
entitled"White Smoke
Emission
from
aSemiconductor
Manufacturing
Plant."
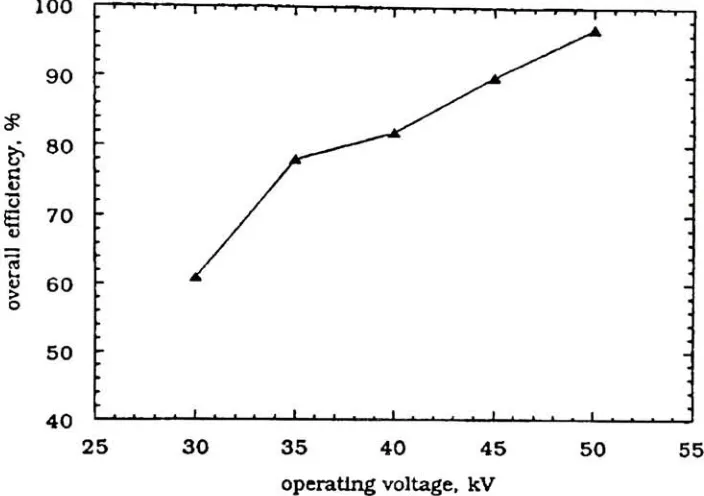
This
paper studiedthe
combined removalefficiency
of a wet scrubberin
seriesvoltage
loadings. The
resultsshowedthat
the
numberofparticlesremaining in
the
outletgas samples reducedas
the
operating
voltagesincreased.
The "white
smoke"virtually
disappeared
from
the
plant stack oncethe
WESP
voltage was above40
KV
and wasalmost
100%
efficientat50 KV. The
chartis
attachedbelow.
100
90
$
80
a
&>
u
e
VO
u
zz
(TJ l_
V >
60
o50
-40
T 1 I I i | | | "I i p
t
1 III' I 1 I . . I . . I *
25
30
35
40
45
50
55
[image:40.540.93.445.141.389.2]operating
voltage.
kV
Fig. 7.
Overall
collectionefficiency
of
the
wetESP
vsoperating
voltage.Tsai,Miao,Lu
p.496
Another
casestudy
publishedin
the
Journal
of
Environmental
Engineering
in
March,
2000,
entitled"Electrostatic
Precipitator
For Metal
andParticulate Emission
Control"discusses
the
use of a venturi scrubberandWESP
usedin
series.This study dealt
withmunicipal sludge
waste,
unlikeKing's Landing's industrial
sewer sludge.Stack
gassampling
was usedto
measurethe
performance ofthe
unitfor
metals andparticulateTABLE 5. EmissionRatesofSRVSA Municipal Sewage Sludge Incinerator #2
NewJerseyDEPE WESP inlet Stack Removal permitlimit
Parameters (Ibs/h) (IbS/h) (%) (Ibs/h)
(1) (2) (3) (4) (5)
Paniculatematter 018 0.0663 63.2 0.7
Arsenic 0.0 (7.5E-5) 0.0 (7.4E-5) 0.0014
Cadmium 8.45 E-6 2.11 E-7 97.5 0.0057
Chromium 1.02 E-5 8.52 E-6 16.5 0.066
Lead 0 0 (7.72E-5) 0.0 (7.25E-5) 0.058
Mercury 9.83 E-3 6.93 E-3 29.5 0.011
Nickel 1.18E-5 4.03 E-6 65.8 0.045
Hydrogenchloride 0.43 0.020 95.3 1.52
Carbonmonoxide 0.314 0.205 34.7 2.3
Nitrogenoxides 0.679 0.661 2.7 7.4
Sulfur dioxide 1.869 1.15 38.5 2.6
Note:Valuesinparentheses representdetection limits. Averagefluegas components massflowratesin lbs/h.
Yang
andBeltranp.236
Although
this
study did
notrelate voltage or powerto efficiency,
it did
outlinethe
mainconcepts
surrounding
suitableWESP
applications and overallperformancefor lead
andparticulateremoval.
Summary:
The
background
for
allAPCE
upstreamofthe
WESP
is
important
to
gain anunderstanding
ofthe
numberofvariablesin
this
process.This
thesis
willgobeyond
the
case studies
that
provethat
voltage and powerlevels
are performanceindicators
by
analyzing
the
upstreamAPCE
and other variablesin
the
incineration
processto
see whatStatistical Analysis Tools Literature
Review
Materials
andMethods:
Based
uponthe
information
that
wasdesired,
statistical analysistools
and applicationswere
carefully
chosen.Proper
analysis requiredthe
identification
ofpredictorandresponse variables.
This
thesis
will analyze10
predictor processvariables asthey
relateto
one responsevariable,
in
an effortto
understand and optimizethe
process with respectto
its
output.Exploratory
data
analysis willfirst be
usedto
examinethe
variables.Descriptive
statistics
include
mean,
standarddeviation,
variance,
samplesize, quartiles,
and othersummary
statistics,
aswell ashistograms,
scatter plotmatrices,
correlationmatrices,
andtrend
charts(Mendenhall
eds.,
pg 4). This
thesis
will usethe
basic
features
ofexploratory data
analysisto
startthe
analysis.The descriptive
statisticsthrough
linear
regression
tools
willbe
appliedusing
the
Minitab Statistical Software
package andthe
PLS
model willbe
developed,
using
PLSPC,
a software packageproprietary
to
Kodak.
Many
plots willbe
generatedto target
andfocus
upontime
periods of unusual orpredictive
behaviors. These
areas willbe
correlated withcertainkey
process variablesandanalyzed with process
knowledge
to
derive
solutions or explanations with respectto
the
performance ofthe
WESP.
Using
asfew dimensions
aspossible,
PLS modeling
willbe
appliedto the
process and outputdata. The
results ofthe
model willfocus further
effortson
key
parametersfor
continued analysisfor
processoptimizationfor Kodak.
Discussion:
Response
andPredictor Variables:
The
response variable measuresthe
effects ofthe
processvariables onits
output andis
also
known
asthe
"dependent
The
predictorvariables arethe
independent
process variables
that
arepresumedto
affectthe
responsevariable(Mendenhall
eds,
p.Exploratory
Data
Analysis:
A
scatterplot showsthe
relationship between
two
variables.Along
withthe
existence ofpotential
outliers,
histograms
showthe
shapes of each variable'sdata
sothat
distributional
assumptions canbe
checked.Correlations
determine
the
amount oflinear
relationships
between
pairs of variables.Trend
charts showhow
variables change overtime.
Linear Regression:
Standard linear
regressiontechniques
require assumptionsto
be
made aboutthe
data.
One
assumptionis
that
there
is
alinear relationship between
the
predictor variable andthe
response variable.Another
assumptionis
that the
valuesofthe
random errors areindependent,
have
a mean ofzero and a commonvariance,
and arenormally distributed
(Mendenhall
eds,
p.540). A
third
assumptionis
that
linear
regression assumesthat the
measurements
themselves
(the
predictorvariables)
containnoerrors(Heckler,
p.6). The
second and
third
assumptionsare nottrue
for
the
MHI
andWESP
variabledata,
whichare
highly
correlated anddefinitely
contain variability.Partial Least-Squares Regression:
The
correlationin
the
MFfi
andWESP data is why
the
partialleast-squares
(PLS)
modelwasused.
Further,
PLS
modelsthe
X
varianceas well asthe
Y
variance andtries
to
fit
amodel
that
adequately
explainsboth
sources of variability.The
background
for
the
basis
ofPLS
canbe
traced
back
to
Herman
Wold. Wold
neededa
tool
to
analyze complexmultivariate modelsderived from Psychological
andEconomic
data
(Heckler,
p.6). The data
werehighly
correlatedwithalarge
numberofvariables. .PLS
classifiesthe
X
(predictor
variables)
andY
(response variables)
asthe
observeddata.
The
unobserveddata
arethe
latent
phenomena.A latent
variableis
notdirectly
observableand
tends
to
vary in
the
populationand sample(Heckler,
p.7). Latent
variables can
be
consideredconcepts wherethe
outputssupporting
the
concepts areconsidered
healthy
if
they
are ofideal
weightfor
their
height
andhave
a normalblood
pressure.
Health
cannotbe
directly
measured,
but is
indirectly
measuredby
the
observedvariables
of weightandblood
pressure.The
fundamental
operation ofPLS is
to
computereasonably
good estimates oflatent
variables,
andbase
allfuture
computations
onthose
variablesto
optimizethe
model.PLS is
basically
atwo-step
process.The first step involves
a statistical analysisusing
partialleast
squares regression.The
secondstep
ofthe
processis
the
optimization part wherecross validationis
usedalong
with orthogonal matrices(Hoskuldsson,
p.211).
PLS
canbe
viewed as a stepwise procedure where a pair ofcomponentsin
the
X
andY
space areselected,
based
on relative closenessto
oneanother(Hoskuldsson,
p.217). This
is
also referredto
as maximum covariancebetween
the
X
variablesandthe
Y
space(Kourti,
p.13). The
process continues untilthere
are no more significant components remaining.The
main goal ofPLS is
to
reducethe
number of variablesdown
to
amanageable number
that
adequately
explainsthe
X
andY
relationship.In-depth
processknowledge is
requiredto
analyze andevaluatethe
model andits applicability
to the
process.
Cross
validationis
the
methodusedto
determine
the
necessary
number ofdimensions in
the
model.Too few dimensions
will under-fitthe
data
and explaintoo
little
ofits
variability.
Too many dimensions
will over-fitthe
data
and explain randomnoise,
aswell as process variability.
One-dimensional
data
givesthe
sameinformation
as a pair-wise correlation(Heckler,
p.7).
As
arule ofthumb, less
than
10
dimensions
areconsideredasmall number.
The
processofcrossvalidationconsists ofdividing
the
dataset into
groups.A
modelis
developed for
the
dataset
by
omitting
onegroup
at atime
andmodeling
the
remaining
groups
together.
This
model predictsthe
responses ofthe
group
that
was excluded andmeasures
the
predictionerrorfor
this
group
(Heckler,
p.7).
The
processis
repeated untilEach
dimension
inthe
final
modelhas
across-validation
value.The
number of optimaldimensions
canbe
observedwhenthe
cross validation valuedoes
notdiffer
muchfrom
one
dimension
to the
next.The PLS
model usesastandard equation with matrix notation.X is
considered
to
represent
the
predictor variables whileY is
the
response variable.T
representsthe
latent
variable predictions associated with
the
X-block
data. T is
alsoreferredto
asa"score"
(Heckler,
p.6). U is
the
latent
variable prediction associatedwiththe
Y-block data. P
represents
the
X-block loadings. The
loadings
showhow
the
latent
variables arerelatedto the
originalX
andY
variables(Kourti,
p.13). Except
withrespectto the
Y-block
loadings, Q
is
the
same concept asP. The
standard equationfor
the
PLS
modelis
shownbelow:
X
=TP' +
E
Y
=TQ'
+
F
whereE
andF
areerrorterms.
Once
the
PLS
modelis
created,
many
plotsmay be
analyzedto
gaininsight into
the
relationships
in
the
data.
Case Studies:
A
casestudy outlining
the
utilization ofPLS modeling
was writtenin
the
article"Process
Analysis
andAbnormal Situation Detection: From
Theory
to
Practice,"by
Theodora
Kourti. The
article reviewsthe
application oflatent
variablemodelsbased
onhistorical
data
andexaminesthe
pros and consfor
improving
both batch
andcontinuous processes.The
articlealsoprovidesinsight
into why
univariate controlcharts arenot goodindicators
ofequipment performanceorfinal
productquality.Univariate
control charts usehistorical
processdata from historical
runsofgoodperformance or goodproduct.
The
upperandlower
limits
are establishedby
plus andminus
3-sigma
levels from
the target
value(Kourti,
p.11). The
univariate control chartsdo
notconsiderthe
interactions
of allthe
process variables.These
chartsdo
not consideraffect
alarge
changeto the
response variable.In
mostcases,
the
simultaneous combinedeffectof all
the
variablesis
what producesthe
outcome onthe
response variable.This is
another
reasonwhy
PLS is
abetter
applicationfor
identifying
the
significant variablesand
their
effect onthe
responsevariable,
for
the
MHI
andWESP
processes.The
casestudy
discussed
in Kourti 's
articledealt
withan actual problemencountered
in
industry
that
was rectifiedusing PLS. The
process containeda
feed
streamthat
had
aknown
concentrationofcomponentA
at20%. The
stream passed
through
a series of12
separatorsuntilastream with ahigh
purity
of componentA
was produced.The
objectivewasto
maintainaconcentration of
A
greaterthan
99.5%,
whilerecovering 92%
ofA in
the
stream.
The
problemoccurredin
the
last
three
months wherethe
recovery
dropped below 92%. The company
analyzed447
process variablesfor 498
days.
A
set of442
variables wasprojectedto
7
principlecomponentsthat
couldexplain
93%
ofthe
variation and93% in
the
recovery.The
processbehavior
changedat points400
to
490. It
also showed an abnormal eventmanifested
itself along
the
first
principlecomponent.In
otherwords,
acombination of variables
from
the
first
principle component seemedto
be
related
to the
event.Contribution
plots were constructedusing information
from
the
loadings
andweightsofeach measuredvariableto
identify
the
process variables
that
numerically
contributedto
decrease
noticedalong
tl
(Kourti
p.14). It
wasidentified
in
the
study
that
only four
variableshad
the
highest
contributionto the
overall observed change.Three
ofthe
four
werecontrollableparameterswhile
the
fourth
was codependent uponthe
others.This
casestudy
showshow 447
processvariables werereducedto
4
that
required additional analysis and process
knowledge
to
fix
the
problem.Conclusions:
Using
the tools
described
above, the
WESP
functionality
and output pollution controlThe
development
of aPLS
model will attemptto
indicate
anddescribe
which predictorScope
of
Work
The
scope of workfor
this thesis
included
acomprehensiveliterature
review and researchof
the
principlesinvolved
with wastewatertreatment,
combustion andincineration,
airpollution control
equipment,
andthe
application of various statisticaltools
asthey
relateto
this
analysis.Statistical
tools
were usedto
analyzehistorical data
anddevelop
a predictive modelbased
on
the
input
variablesfor
the
performanceofthe
WESP (measured
by
powerlevel).
The
controllable variables
that
wereanalyzedfor
the
unit were: venturi pressuredrop,
wetsludge
feed
rate,
gasflow
through the system,
quench waterflow,
condenser waterflow,
and
WESP
voltage.Uncontrollable
variables examinedwere: oxygenlevel
(exiting
stack),
CO level
(exiting
stack),
and#3 hearth
temperature
(which is
afunction
ofthe
combustibility
ofthe
sludge).The
response variable observed wasthe
power measure