by r
■
eLctetIan M. Colrain B.Sc.(Hons.) in the Department of Psychology
Submitted in fulfilment of the requirements of the degree of Doctor of Philosophy
any other higher degree or graduate diploma in any university, and that to the best of my knowledge and belief the thesis contains no copy or paraphrase of material previously published or written by another person, except where due reference is made in the text of the thesis.
5. Access to, and copying of, thesis
The thesis copy lodged in the University Library shall be made available by the University for consultation but, for a period of two years after the thesis is lodged, it shall not be made available for loan or photocopying without the written consent of the author and in accordance with the laws of copyright.
After a thesis has been examined, the following authority will apply. Please complete your request, and sign below.
(i) I agree/do-ftet-agree that the thesis may be made available for loan:
(ii) I agree/de-ftet-egfee-that the thesis may be made available for photocopying.
(iii) I note that my consent is required only to cover the two-year period following approval of my thesis for the award of my degree. After this, access to the Library copy will be subject only to any general restrictions laid down in Library regulations.
Signed: c-f Date: (/
/198.1. from which date the two years embargo will apply.
SMED 12/86
Many aspects of human respiration are known to change from wakefulness to NREM sleep, including the level of ventilation, and the responsiveness to chemical respiratory stimuli. The differences in ventilation between wakefulness and sleep are due to a number of factors, one of which has been hypothesised to be the cessation of a wakefulness drive to respiration. Such an hypothesis would link the stimulation of respiration to the activity within the ascending reticular activating system, activity which varies greatly during the period of sleep onset, and which is responsible for the changes in activity seen at the cerebral cortex. The hypothesis allows the prediction that cessation of the wakefulness drive would occur rapidly and with a consistent relationship to EEG changes during the sleep onset period.
The present literature lacks an accurate description of the relationship between changes in ventilation and alterations in cortical arousal as measured by the EEG. This thesis reports three experiments designed to investigate ventilation during sleep onset and to provide such a description, in both males and females. An assessment is also made of the extent to which respiratory data collected over the sleep onset period is influenced by the measurement devices used.
Sex differences exist in the incidence of sleep related respiratory dysfunction. In addition, there is uncertainty as to whether females show sleep related decreases in the responsiveness to chemical stimuli. This uncertainty has often been explained in terms of different subjects being in different cycles of the menstrual cycle when investigated. These data led to doubt as to whether females possess a wakefulness drive to respiration and, if so, whether it is affected by progesterone levels.
The second experiment sought to investigate ventilation during sleep onset in normal young females, during both phases of the menstrual cycle. Sleep onsets were studied in five subjects in a series of single subject designs. The results obtained supported those of the male subjects. That is, decreases in ventilation were associated with the onset of theta activity in the EEG. Further, no menstrual phase differences existed in the magnitude of the ventilation decrease or in its timing relative to EEG variations. Thus, females demonstrated the same pattern of ventilation change as males, indicating that they also possess a wakefulness drive.
In the first two experiments ventilation was monitored with a mask and breathing valve attached to a pneumotachograph and flow meter. There is evidence that during wakefulness, the increased dead space and respiratory load associated with such equipment substantially elevates the level of ventilation. The existence of such an effect while awake, but not during sleep, would also explain the above results. The third experiment was designed to determine whether the decrease in ventilation, associated with the onset of theta activity, could also be obtained without the mask and associated apparatus.
within each condition as replications. Data from the first condition was used to construct regression equations to enable the estimation of tidal volume from the strain gauges.
Each subject required different regression equations for wakefulnes and sleep to accurately estimate ventilation from the strain gauge data. Different regression equations -were also required for each unique set of strain gauges used. The data indicated that the practice in earlier studies, of estimating ventilation during sleep, using regression equations based on short calibration sessions held during wakefulness, has probably involved the introduction of error.
ACKNOWLEDGEMENTS
I am extremely thankful for the work of my supervisor, John Trinder. His inspiration, friendship and assistance with the data analysis and writing of the thesis are all greatly appreciated. Thanks must also go to Lin Montgomery, who has provided much needed practical and moral support as a second supervisor. Special acknowledgement is also due to Geoff Fraser, who assisted with the scoring of sleep records and suffered more or less silently through three years of sharing an office with me.
Only the willing and capable support of the technical staff of the Psychology Department enabled the equipment demands of data collection to be met. I wish to thank John Wanless, Brian Rieusett, Steve Bradford, Richard Rogers and Bob Reid for designing, building and maintaining the equipment used and Peter Tattam for writing and constantly updating the computer software.
I would like to thank the following people who assisted with the collection of blood for analysis in the second experiment: Sr. Fiona Urquhart; Dr. Ian Taylor; Sr. Jean Brown; and the staff of the University Student Health Clinic. Thanks are also due to the staff of the Department of Clinical Chemistry, Royal Hobart Hospital, who conducted the analysis of the samples.
The studies of this thesis were very demanding on the participating subjects. Without their understanding and willing participation the studies would have been much more difficult to complete. I am very grateful to all of them.
ACKNOWLEDGEMENTS
I am extremely thankful for the work of my supervisor, John Trinder. His inspiration, friendship and assistance with the data analysis and writing of the thesis are all greatly appreciated. Thanks must also go to lain Montgomery, who has provided much needed practical and moral support as a second supervisor. Special acknowledgement is also due to Geoff Fraser, who assisted with the scoring of sleep records and suffered more or less silently through three years of sharing an office with me.
Only the willing and capable support of the technical staff of the Psychology Department enabled the equipment demands of data collection to be met. I wish to thank John Wanless, Brian Rieusett, Steve Bradford, Richard Rogers and Bob Reid for designing, building and maintaining the equipment used and Peter Tattam for writing and constantly updating the computer software.
I would like to thank the following people who assisted with the collection of blood for analysis in the second experiment: Sr. Fiona Urquhart; Dr. Ian Taylor; Sr. Jean Brown; and the staff of the University Student Health Clinic. Thanks are also due to the staff of the Department of Clinical Chemistry, Royal Hobart Hospital, who conducted the analysis of the samples.
The studies of this thesis were very demanding on the participating subjects. Without their understanding and willing participation the studies would have been much more difficult to complete. I am very grateful to all of them.
TABLE OF CONTENTS
Page
ABSTRACT iii
ACKNOWLEDGEMENTS vi
GLOSSARY xi
LIST OF TABLES xii
LIST OF FIGURES xiv
Chapter One: Introduction. 1
Chapter Two: Respiration during NREM sleep. 5
2.1 The Level of Ventilation. 6
2.2 Chemical Control Mechanisms. 8
2.3 Metabolic Rate. 10
2.4 Physical Properties. 11
2.5 Animal studies. 12
2.6 Summary. 14
Chapter Three: The Nature of Respiratory Control and the Evidence for a
Wakefulness Drive to Respiration. 16
3.3.1 The Level of Ventilation in NREM Sleep. 20 3.3.2 Post-hyperventilation Apnea. 21 3.3.3 Clinical Evidence for a Wakefulness Drive. 22 3.3.4 Changes in Brain Stem Influences on 23
Respiration.
3.3.5 Higher Brain Centre Influence on Respiratory 25 Control.
3.4 The Relationship between EEG and Measured 27 Respiratory Changes.
3.5 Summary. 29
Chapter Four: Experiment One: Ventilation During Sleep Onset in Male 30 Subjects.
4.1 Introduction. 31
• 4.2 Method. 31
• 4.2.1 Subjects and Design. 31
4.2.2 Equipment. 32
4.2.3 Variables. 33
4.2.4 Data Analysis. 34
4.3 Results. 36
4.4 Discussion. • 52
Chapter Five: The Evidence for Sex Differences in Respiration. 53 5.1 Ventilation During NREM Sleep in Females. 54 5.2 Sex Differences in Chemical Control Mechanisms. 55
5.2.1 Awake Differences. 55
5.3 Evidence for Sex Differences in Sleep Related 57 Respiratory Dysfunction.
5.4 Evidence for Progesterone as a Respiratory Stimulant. 59 5.4.1 Luteal - Follicular Comparisons. 60 5.4.2 Respiration During Pregnancy. 61 5.4.3 Progesterone as Therapy for Respiratory 62
Dysfunction.
5.4.4 Effects in Normal Males and Experimental 62 Animals.
5.4.5 Mechanism of Action. 63
5.5 The Role of Testosterone in Sex Differences. 64
5.6 Summary.
65
Chapter Six: Experiment Two: Ventilation During Sleep Onset in Normal
Females. 66
6.1 Introduction. 67
6.2 Method. 67
6.2.1 Subjects and Design. 67
6.2.2 Equipment. 69
6.2.3 Variables. 69
6.2.4 Data Analysis. 70
6.3 Results. 70
6.3.1 Progesterone Assay. 70
6.3.2 General Findings. 71
6.3.3 Luteal - Follicular Comparison. 84
7.1 Sensory stimulation. 96
7.2 Upper-airway Resistance. 98
7.3 Apparatus effects. 98
7.4 Implications for Awake - Asleep comparisons. 101
Chapter Eight: Experiment Three: Equipment Artifact and Ventilation During 103 Sleep Onset.
8.1 Introduction. 104
8.2 Method. 104
8.2.1 Subjects and Design. 104
8.2.2 Equipment. 105
8.2.3 Variables. 106
8.3 Results 107
8.3.1 Multiple Regression Analysis. 107 8.3.2 Ventilation During Sleep Onset. 111
8.4 Discussion. 122
Chapter Nine: Discussion and Conclusions. 124
9.1 Male Subjects. 126
9.2 Female Subjects. 126
9.3 The Effect of a Mask on Ventilation. 127
9.4 Summary. 129
9.5 Implications for Future Research. 130
References. 129
GLOSSARY
CD Respiratory cycle duration. EEG Electroencephalograph. EMG Electromyograph
EOG Electro-oculograph.REM
FetCO2 Estimate of end-tidal carbon dioxide based on expired air
samples.
Fet02 Estimate of end-tidal oxygen based on expired air samples.
PACO2 The partial pressure of carbon dioxide at the alveoli.
REM Rapid EyeMovement sleek.
VCO2 Minute carbon dioxide production.
YE Minute ventilation of expired air.
VE(Extrap) Minute ventilation of expired air extrapolated from single breath Vt and CD values.
VE(Extrap)* Minute ventilation of expired air extrapolated from single breath Vt(Regr) and CD values.
VE(Regr) Minute ventilation of expired air estimated from regression
equations using abdominal and thoracic strain guage measurements.
VE/V02 The ventilation equivalent calculated by dividing VE by V02.
VO2 Minute oxygen consumption.
V/PCO2 Ventilation related to changes in the partial pressure of carbon
dioxide. Vt Tidal volume.
LIST OF TABLES
Page
TABLE 4.1 Respiration during sleep onset: Minute values for
male subjects. 37
TABLE 4.2 The relationship during sleep onset between significant
decreases in ventilation and EEG activity in male subjects. 41
TABLE 4.3 Average correlations between EEG and respiratory variables during particular phases of sleep onset in male
subjects. 43
TABLE 4.4 Breath by breath changes in respiratory variables before and after the transition from EEG alpha/beta to
theta activity in male subjects. 45
TABLE 4.5 Breath by breath changes in respiratory variables in
alpha - theta - alpha transitions for male subjects. 51
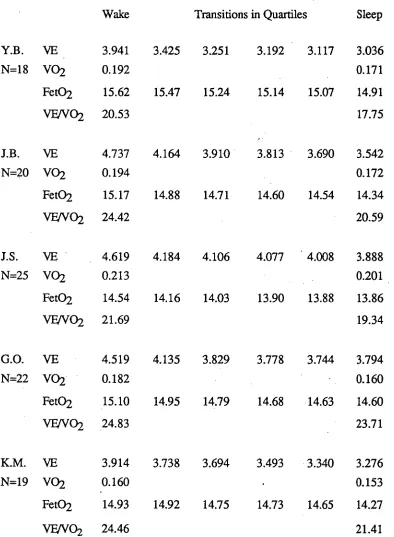
TABLE 6.1 Respiration during sleep onset: Minute values for
female subjects. 72
TABLE 6.2 The relationship during sleep onset between significant
decreases in ventilation and EEG activity in female subjects. 76
TABLE 6.3 Average correlations between EEG and respiratory variables during particular phases of sleep onset in
female subjects. 78
TABLE 6.4 Breath by breath changes in respiratory variables before and after the transition from EEG alpha/beta to
theta activity in female subjects. 80
TABLE 6.5 Breath by breath changes in respiratory variables in
TABLE 6.6 Respiration during sleep onset: Minute values for
follicular and luteal menstrual phases. 85
TABLE 6.7 Summary of the analysis of the timing of ventilatory
decreases comparing follicular with luteal phase. 89
TABLE 6.8 Summary of the analysis of the correlation coefficients between ventilation and EEG state comparing follicular
with luteal phase. 90
TABLE 6.9 Breath by breath changes in respiratory variables before and after the transition from EEG alpha/beta to
theta activity in follicular and luteal phases. 91
TABLE 8.1 Regression equations relating abdominal and thoracic
movement to tidal volumes. 110
TABLE 8.2 Respiration during sleep onset : Minute values for the
MASK, CATH and GAUGE conditions. 113
TABLE 8.3 Breath by breath changes in respiratory variables before and after the transition from EEG alpha/beta to
theta activity in the MASK, CATH and GAUGE conditions. 116
TABLE 8.4 Summary ANOVA tables for the analysis of equipment
LIST OF FIGURES
Page
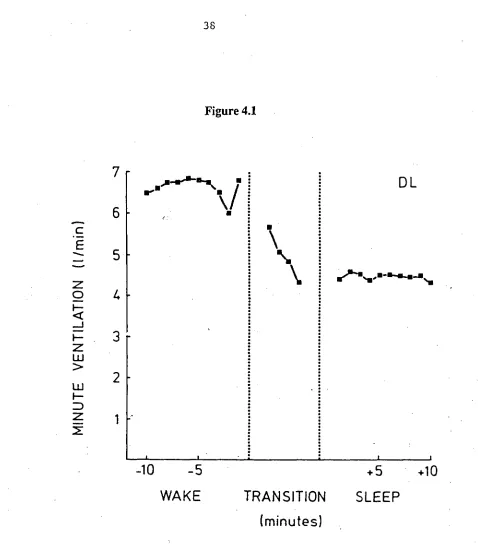
FIGURE 4.1 Minute ventilation for subject D.L. during the final 10 minutes of wake, the transitional period of mixed wake/stage
1 sleep, and the first 10 minutes of stage 2 sleep. 38
FIGURE 4.2 Minute ventilation extrapolated from individual breaths for subject M.W. The values for the final 5 breaths before
cessation of alpha in the EEG, and the following 35
breaths are shown. 49
FIGURE 4.3 Tidal volume for subject M.W. The values for the final 5 breaths before cessation of alpha in the EEG, and the
following 35 breaths are shown. 50
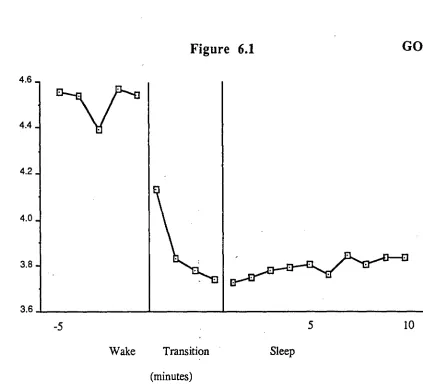
FIGURE 6.1 Minute ventilation for subject G.O. during the final 5 minutes of wake, the transition period of mixed wake/stage
1 sleep, and the first 10 minutes of stage 2 sleep., 74
FIGURE 6.2 Minute ventilation extrapolated from individual breaths for subject J.S. The values for the final 5 breaths before
cessation of alpha in the EEG, and the following 35
FIGURE 6.3 The ventilation equivalent for subject J.B. for the luteal and follicular menstrual phases. Data is presented from the last
5 minutes of wake, the transitional period of mixed wake
/ stage 1 sleep and the first 10 minutes of stage 2 sleep. 86
FIGURE 8.1 Minute values of end tidal CO2 for subject A.C. during the last five 5 minutes of wake, the transitional period of mixed
wake / stage 1 sleep and the first 10 minutes of stage 2 sleep.
Data is presented from the MASK and CATH conditions. 114
FIGURE 8.2 Minute ventilation extrapolated from individual breaths for subject A.C. The values of the final 5 breaths before
cessation of alpha in the EEG and the following
t35 breaths are shown. Data is presented from the
MASK, CATH, and GAUGE conditions. 120
FIGURE 8.3 End tidal Oxygen for subject D.L. The values of the final 5 breaths before cessation of alpha in the EEG and the
following 35 breaths are shown. Data is presented from
CHAPTER ONE
CHAPTER ONE
INTRODUCTION
Reports published over the last one hundred years suggest that breathing differs between wakefulness and sleep (Douglas, 1984). The early studies using behavioural identification of sleep, and more recent investigations using electrophysiological methods, have typically shown a lower level of ventilation in sleep, particularly non rapid eye movement (NREM) sleep. In addition, recent studies have shown variations in the chemical control and physical mechanics of respiration during sleep.
This thesis was concerned with the change which occurs in ventilation during sleep onset. Informal observations reported in the literature have suggested that this change occurs systematically at the point of sleep onset. The aim of this thesis was to test the validity of these observations. However, as has been reported by a number of authors, the sleep onset period is difficult to analyse (Hudgel & Devadatta, 1984; Hudgel, Martin, Johnson & Hill, 1984; Tabachnik, Muller, Bryan & Levison, 1981; Yamashiro, Fukushima, Okudaira, Suzuku & Nishi, 1987). To a large extent, this difficulty stems from the fact that the transition from wakefulness to sleep is characterised by a succession of rapid oscillations in arousal level before stable sleep is achieved. In order to successfully describe ventilation during this period, it was necessary to develop both particular analysis techniques for resolving data and computer software which allowed a breath-by-breath analysis of ventilation during the transitional period.
Chapter two reviews the literature which has reported changes in respiration known to occur with NREM sleep in humans and other animal species. It does not include a review of changes in respiration associated with REM sleep. This review of respiratory changes during sleep emphasises NREM sleep because in normal adults, sleep begins with NREM sleep. The NREM stages 2, 3, and 4 are followed by REM sleep approximately 90 minutes later. The alteration of NREM and REM then continues throughout sleep in approximately 90 minute cycles.
There are a number of points of evidence for a wakefulness drive to respiration. These include: the differences in ventilation and chemical ventilatory drives between wakefulness and sleep; the occurrence of apnea following hyperventilation during sleep; the existence of respiratory diseases with state specific symptomatologies; and the fact that sleep-related changes occur in neural activity in brain stem arousal and respiratory centres. This evidence is reviewed in Chapter three. Chapter four describes an experiment conducted on normal male subjects which investigated ventilation changes associated with sleep onset.
CHAPTER TWO
CHAPTER TWO
RESPIRATION DURING NREM SLEEP
2.1 The level of ventilation
There is a substantial literature which indicates that many aspects of respiratory function vary between wakefulness and NREM sleep. Minute ventilation has been consistently found to decrease with sleep (Birchfield, Sieker & Heyman, 1959; Bulow, 1963; Bulow & Ingvar, 1961; Douglas White, Pickett, Weil & Zwillich, 1982a; Douglas, White, Weil, Pickett, Martin, Hudgel & Zwillich, 1982b; Gleeson, Zwillich, Braier & White, 1986; Gothe, Altose, Goldman & Cherniack, 1981; Gothe, Cherniack & Williams, 1986; Hudgel et al., 1984; Lopes, Tabachnik, Muller & Levison, 1983; Lugaresi, Coccagna, Cirignotta, Farneti, Gallasi, Di Donato & Verucchi, 1978; Magnussen, 1944; Reed & Kellogg, 1958; 1960a; 1960b; Rist, Daubenspeck & McGovern, 1986; Robin, Whaley, Crump & Travis, 1958; Skatrud & Berssenbrugge, 1983; Skatrud & Dempsey, 1983; Tabachnik et al., 1981; White, 1986; White, Douglas, Pickett, Weil & Zwillich, 1982; White, Weil & Zwillich, 1985b; Yamashiro et al., 1987). In addition, Gothe, Goldman, Cherniack & Mantey (1982), reported a non-significant decrease.
Shore, Millman, Silage, Chung & Pack (1985), in a study comparing young and
elderly subjects, reported a significant decrease in ventilation among the young group,
with only a slight fall in the elderly. However, a similar study by Krieger, Turlot,
Mangin & Kurtz (1983) reported significant reductions in the ventilation of both young
and old subjects, with no notable age effect. Finally, Duron (1972) and Duron, Andrac
& Laval (1967), provided the only reports to contradict the general finding, as they
found no change in ventilation from wakefulness to sleep.
The sleep-related minute ventilation decrease is often associated with a decrease in
tidal volume (Birchfield et al., 1959; Bulow, 1963; Bulow & Ingvar, 1961; Douglas et
al., 1982a; Gothe et al., 1981; Gothe et al., 1986; Hudgel et al., 1984; Lopes et al.,
1983; Magnussen, 1944; Skatrud & Berssenbrugge, 1983; White, 1986; White et al.,
1982; White et al., 1985b). Gothe et al. (1982) and Tabachnik et al. (1981) reported
non-significant decreases. Shore et al. (1985) reported a sleep associated decrease in
tidal volume among young subjects. Elderly subjects displayed an increase in tidal
volume during stages one and two when compared with wakefulness, however slow
wave sleep values were below those of wakefulness.
Reports of respiratory rate changes with NREM sleep have been more variable than
those of tidal volume. In a number of studies, respiratory rate has been reported to
decrease during sleep (Gothe et al., 1986; Khatri & Freis, 1967; Lopes et al., 1983;
Shore et al., 1985; Snyder, Hobson, Morrisson & Goldfrank, 1964; Tabachnik et
a.,
1981; Yamashiro et al., 1987). However, increases have also been reported (Birchfield
et al., 1959; Douglas et al., 1982a; Duron et al., 1967; Hudgel et al., 1984; Kumar, van
Diest, Hofman, Visser, Poelstra & Bakker, 1980). Finally, Gothe et al. (1981; 1982)
reported a non-significant decrease with sleep, and White (1986) reported "little
2.2 Chemical Control Mechanisms
Associated with the lower level of ventilation during sleep, are increases in the partial pressure of carbon dioxide at the alveoli and in arterial blood (Birchfield et al., 1959; Bulow, 1963; Bulow & Ingvar, 1961; Coccagna & Lugaresi, 1978; Douglas et al., 1982a; Douglas, White, Weil, Pickett & Zwillich, 1982c; Gothe et al., 1981; Gothe et al., 1982; Gothe et al., 1986; Hedemark & Kronenberg, 1982; Magnussen, 1944; Naifeh & Kamiya, 1981; Naifeh, Kamiya & Monroe-Sweet, 1982; Reed & Kellogg, 1958; 1960a; 1960b; Rist et al., 1986; Robin et al., 1958; Shore et al., 1985; Townsend, Prinz & Obrist, 1973; White, 1986; White et al., 1982). There is also a decrease in blood pH (Birchfield, 1959; Coccagna & Lugaresi, 1978; Robin et al.,
1958). These changes indicate an increased tolerance for carbon dioxide during sleep.
Another manifestation of increased tolerance for carbon dioxide is a sleep related decrease in the ventilatory response to increases in carbon dioxide (Bellville, Howland, Steed & Houde, 1959; Berthon-Jones & Sullivan, 1984; Birchfield et al., 1959; Bulow, 1963; Bulow & Ingvar, 1961; Douglas et al., 1982c; Gothe et al., 1981; Gothe et
a.,
1986; Magnussen, 1944; Naifeh, Severinghaus & Kamiya, 1987; Reed & Kellogg, 1958; 1960b; Rist eta.,
1986; Robin et al., 1958). The one exception to these findings was provided by Hedemark & Kronenberg (1982), who found no difference between awake and NREM sleep hypercapnic responses.These results indicate that there is a variation in the metabolic control of ventilation between the awake and NREM sleep states. The change in the hypercapnic ventilatory response usually involves a shift of the V/PCO2 curve to the right, and a slight reduction in slope (Cherniack, 1981). While this finding is well established, there is also some evidence of sex differences (Berthon-Jones & Sullivan, 1984; and Newsom-Davis, Loh, Nodal, Charnock, 1978), the implications of which are discussed in Chapter five.
oxygen partial pressure, or oxyhaemoglobin saturation, in normal subjects (Birchfield et
al., 1959; Coccagna & Lugaresi, 1978; Douglas et al., 1982a; Gothe et al., 1986;
Kopelman, Apps, Cope & Empey, 1985; Reed & Kellogg, 1958; Tabachnik et al.,
1981).However, Robin et al. (1958), reported a non-significant decrease in oxygen
partial pressure and no change in saturation. Peset (1984), found no change in saturation
and Gothe et al. (1982) only a slight decrease.
The general opinion of reviewers is that hypoxic ventilatory responses are little
altered by NREM sleep (Chemiack, 1981; Phillipson, 1978). This belief is supported
by three recent studies which failed to find a state-related difference (Gothe et al., 1986;
Hedemark & Kronenberg, 1982; White et al., 1982). A dissenting view is that of
Douglas (1984), who cited two studies which reported a sleep-related decrease in the
response (Berthon-Jones & Sullivan, 1982; Douglas et al., 1982b). The uncertainty of
conclusions in the literature are exemplified by the study by Gothe et al. (1982), in
which 17 young adults were investigated. Of these, ten demonstrated no effect, five a
significant increase, and two a significant decrease in response during NREM sleep. As
with the hypercapnic response, there is some evidence of a possible sex difference
2.3 Metabolic Rate
It has been demonstrated that metabolic rate decreases from wakefulness to NREM sleep. This has been the case both for measurements of oxygen consumption (Brebbia & Altshuler, 1965; Duron et al., 1967; Haskell, PaIca, Walker, Berger & Heller, 1981; Kreider & Iampietro, 1959; Magnussen, 1944; Robin et al., 1958; Webb & Hiestand 1975; White et al., 1985b; Yamashiro et al., 1987), and carbon dioxide production (Bulow, 1963; Duron et al., 1967; Robin et al., 1958; Shapiro, Go11, Cohen & Oswald, 1984; White et al., 1985b; Yamashiro et al., 1987).
2.4 Physical Properties
There are a number of changes to the mechanics of respiration which occur with NREM sleep. In wakeful, supine subjects, there is a greater abdominal (diaphragmatic) contribution to respiration than thoracic (intercostal muscles) (Goldman, 1982; Sharp, Goldberg, Druz & Dation, 1975). Most researchers report that during NREM sleep this situation is reversed, there being relatively more thoracic breathing (Goldie & Green, 1961; Gothe et al., 1981; Gothe et al., 1982; Monola & Anch, 1978; Naifeh & Katniya, 1981; Tabachnik et al., 1981; Timmons, Salamy, Kamiya & Girton, 1972). At least one study failed to find a difference between awake and NREM sleep patterns (Tusiewicz, Moldofsky, Bryan & Bryan, 1977). Naifeh & Kamiya (1981) suggest that this finding is to be explained by the fact that Tusiewicz et al. (1977) did not measure lateral rib-cage expansion.
Tabachnik et al. (1981), in addition to measuring thoracic and abdominal movement, used intercostal and diaphragmatic electromyograms to measure respiratory muscle activity. Their results indicated that the increased thoracic contribution to respiration during sleep is the result of "active expansion of the rib cage by enhanced intercostal muscle activity" (p. 560). The increase in muscle activity, without increase in tidal volume, indicated an increase in respiratory work-load that was possibly due to an increase in upper airway resistance. Although a sleep related decrease in the functional residual capacity might also be involved (Hudgel & Devadatta, 1984).
activity. Lopes et al. (1983) interpreted these changes as indicating an increase in the efficiency of diaphragmatic contraction. Thus the abdominal to thoracic shift reported to occur with sleep could be viewed as an attempt to increase the efficiency of respiratory mechanics in response to an increase in respiratory load produced by the narrowing of the upper airway.
Unlike the above studies, Rist et al. (1986) attempted to adjust the awake and NREM-sleep EMG measures to correct for the different carbon dioxide partial pressures in each state. Following this adjustment, they reported significant decreases in intercostal and diaphragmatic EMG from wakefulness to NREM-sleep. They also noted, however, that for a given level of diaphragmatic and intercostal EMG activity, the ventilation produced during wakefulness was greater than that during sleep. They interpreted these results as evidence for both a decrease in the central respiratory drive and a reduced effectiveness of respiratory muscles during sleep. Taking all the results into consideration, they concluded that reduced mechanical efficiency accounts for only a portion of the total reduction in ventilation.
2.5 Animal Studies
In animals, tidal volume has been found to increase with NREM sleep; this is the opposite of what typically happens in humans (Orem et al., 1977a; 1977b; Phillipson et al., 1976; Remmers et al., 1976). The reduction in minute ventilation can thus occur only because of a decrease in respiratory rate (Orem et al., 1977a; 1977b; Pappenheimer, 1977). Non-significant decreases in respiratory rate were reported by Phillipson et al. (1976) and Sullivan et al. (1978).
There are reports, using animals, of sleep related increases in carbon dioxide pressure (Guazzi & Freis, 1969; Phillipson et al., 1976), and decreases in blood pH and oxygen pressure (Guazzi & Freis, 1969). The hypercapnic ventilatory response has been found to decrease with sleep (Phillipson, 1977; Phillipson et al., 1976; Santiago, Shina & Edelman, 1979). The hypoxic ventilatory response is reported as having shown no change (Phillipson, 1977; Phillipson et al., 1978) or to increase (Pappenheimer, 1977). Metabolic rate has been reported to decrease with sleep (Mayevslcy & Samuel, 1975).
Measurement of muscle activity in the major respiratory groups and the airways is easier and more direct in animals than in humans. A number of studies have reported decreased tone in upper airway musculature during NREM sleep (Megirian & Sherrey, 1980; Megirian, Cespuglio & Jouvet, 1978; Orem & Lydic, 1978; Orem et al., 1977b; Sherrey & Megirian, 1977; Sherrey & Megirian, 1980). Intercostal muscle tone has been shown to decrease (Parmeggiani & Sabattini, 1972) or to remain the same (Duron & Marlot, 1980). Diaphragmatic activity seems little altered by NREM sleep (Remmers et al., 1976; Duron & Marlot, 1980).
above, despite a lack of variation in upper airway patency. These results add vital information to our understanding of the decrease in ventilation with NREM sleep. They clearly indicate that such a change can, and does occur in the absence of the increased respiratory load associated with upper airway narrowing during sleep. Thus there is data from animals as well as humans (Rist et al., 1986) to indicate that respiratory changes with sleep require more than changes in the efficiency of the mechanics of breathing. That is, they may be due also to a decrease in central respiratory drive.
2.6 Summary
A reduced level of ventilation during NREM sleep is common in humans and other animal species. In man this tends to be mediated by a decrease in tidal volume with variable effects on respiratory rate. In cats and dogs the opposite is the case, with respiratory rate showing consistent decreases and tidal volume showing little change, or even an increase. The carbon dioxide control mechanism varies in man and animals, NREM sleep being associated with an increase in carbon dioxide pressure and a decrease in the hypercapnic ventilatory response. The effects of NREM sleep on the oxygen control system are less clear, as not all investigations report decreases in the hypoxic ventilatory response. Metabolic rate has been found to decrease with sleep whether measured by oxygen consumption or carbon dioxide production.
CHAPTER THREE
CHAFFER THREE
THE NATURE OF RESPIRATORY CONTROL AND THE EVIDENCE FOR A WAKEFULNESS DRIVE TO RESPIRATION
One cause of the sleep related variations in respiration is thought to be the cessation of a central drive to respiration associated with wakefulness. In this chapter, an outline of the mechanisms responsible for respiratory control and those involved in loss of wakefulness is presented. The direct and indirect evidence used in support of an hypothesised wakefulness drive to ventilation is then reviewed.
3.1 Respiratory Control Mechanisms
Berger, Mitchell & Severinghaus (1977a,b,c) provide a three part review of the regulation of respiration. This review emphasises both the diversity of the sources of afferent information related to respiratory control, and the necessity of central integration of this information for the generation of appropriate motor commands. The first source of afferent information is provided by the peripheral chemoreceptor mechanisms. These lie within the ascending aorta (aortic bodies) and at the bifurcation of the common carotid arteries (carotid bodies). Both are stimulated by decreased partial pressures of oxygen and increased partial pressures of carbon dioxide. However, they vary in their response to decreased pH, the carotid sensor being stimulated and the aortic sensors unaffected or depressed.
surface of the medulla that is sensitive to the pH of cerebro spinal fluid (Comroe, 1974; Berger et al., 1977a).
There are a number of mechanisms besides chemoreceptors for oxygen and carbon dioxide, that are capable of influencing respiration. Within the upper airways there are chemical and mechanical irritant sensors (Berger et al., 1977a). Those within the nasal airways have afferent pathways in the trigeminal and olfactory nerves. Those in the epipharynx transmit information via the pharyngeal branch of the glossopharyngeal nerve. Finally, those within the larynx transmit via the internal branch of the superior laryngeal nerve. The lower airways and lungs also contain a variety of receptors. Information from pulmonary stretch receptors located in the airway smooth muscle is transmitted via large myelinated vagal fibres and is thought to be important in determining the rate and depth of breathing. Two other types of lung receptors, irritant receptors and juxtapulmonary capillary receptors, also transmit information via vagal fibres.
The dorsal respiratory group consists predominantly of inspiratory related neurons with projections to the contralateral spinal cord, approximately two-thirds of them monosynaptically exciting contralateral phrenic motoneurons. The fact that the nucleus of the solitary tract is the primary projection site of visceral afferents within the glossopharyngeal and vagus nerves implicates the dorsal respiratory group in the integration of afferent inputs into a respiratory motor response. This co-ordination / integration role is also supported by investigations indicating its unidirectional influence on the ventral respiratory group, which contains both inspiratory and expiratory neurons. The inspiratory neurons are concentrated in the rostral portion of the nucleus retroambiguus with the expiratory neurons being located more caudally. Approximately ninety percent of the neurons within the nucleus retroambiguus project to the contralateral spinal cord between the first thoracic and third lumbar segments, and influence intercostal and abdominal motoneurons.
The above description of the structures involved in the regulation of respiration provides a general overview. Of importance to the present thesis is the fact that a variety of afferent information is integrated in the brain stem and results in an organised patterns of respiratory motoneuron activity. The possible influence of reticular formation activity on these central "integrators" is discussed in section 3.3.
3.2 Reticular Influences on Awake - Sleep Transitions
Remmers (1981) has argued that the reticular activating system maintains wakefulness by three mechanisms: a direct activation of cortical cells via reticulo-fugal projections; an activation of the major relay (lateral) nulcei of the thalamus, facilitating the passage of information through the thalamus to the cortex; and an inhibition of the medial thalamic nulcei, which exert an inhibitory influence on the lateral thalamic nuclei. He states that "the onset and progression of quiet sleep appears to involve reversal of the three neuronal processes by which the reticular activating system maintains wakefulness" (p. 116). Phillipson (1978) suggests that the onset of NREM sleep depends on the withdrawal of ascending reticular discharges and may depend also on the inhibition of the arousal system by basal forebrain mechanisms. This view is supported by Schmidt (1978), who claims that "even a chronically isolated brain lacking a reticular formation exhibits a sleeping-waking rhythm" (p. 288). Nonetheless the acquisition of sleep is typically associated with a decreases in ascending reticular activating system activity.
3.3 Evidence for a Wakefulness Drive to Respiration
"Wakefulness and facilitation of breathing are inextricable because of their common neural origins" (Orem, 1984, p. 95). Thus it can be hypothesised that changes in respiration associated with NREM sleep relate to the decrease of generalised wakefulness, or alertness, and thus imply a respiratory excitation by the reticular activating system (Hugelin and Cohen, 1963). The evidence in support of this wakefulness drive hypothesis is presented in the remainder of this chapter.
3.3.1 The Level of Ventilation in NREM Sleep
increase in carbon dioxide partial pressure.
Phillipson (1978) commented that a decrease in ventilation of one litre per minute
and an increase in arterial PCO2 of five mm. Hg. can be completely accounted for by
two factors, namely a small decrease in the metabolic production of carbon dioxide and a
variation of the "homeostatic set-point" to a reduced alveolar ventilation, and an
increased arterial PCO2. Evidence indicating an increased carbon dioxide "set point" is
provided by the decreased ventilatory responsiveness to hypercapnia associated with
NREM sleep. Phillipson hypothesises that the "change in 'set-point' is the direct result
of the loss of the stimulating influence of wakefulness on breathing" (p. 920). This
change in the carbon dioxide set-point is consistent with the wakefulness drive
hypothesis, and cannot be explained by other postulated causes of the sleep related
ventilation decrease, such as, increased airway resistance or decreased metabolic rate.
3.3.2 Post-hyperventilation Apnea
Additional evidence is provided for a wakefulness drive by studies which have
investigated the effects of the artificial manipulation of ventilation during wakefulness
and sleep. Douglas (1984) commented that reducing the end-tidal carbon dioxide level
during NREM sleep to that found in wakefulness produces apnea in normal subjects.
This conclusion summarises evidence from hyperventilation studies in humans and
animals. For instance, Fink (1961) reported a complete absence of apnea following
over-ventilation during wakefulness, despite a reduction of the end tidal carbon dioxide
partial pressure to below 15 mm. Hg. in some instances. He comments that the absence
of over-ventilatory apnea in conscious subjects, contrasts with the invariable onset of
apnea in patients over-ventilated during general anesthesia, and can be explained in terms
of a cerebral drive to ventilation associated with wakefulness.
However, these authors did not ascribe this result to the effects of wakefulness itself. They saw it as the result of active neural generation provided by the over-ventilation. This notion is supported by studies reporting apnea following passive hyperventilation in awake dogs (Mitchell, Bainton & Edelist, 1966) and awake humans (Bainton & Mitchell, 1966). Similarly Eldridge (1973), reported apnea after passively induced hyperventilation but not after active production in cats (where the active hyperventilation was produced by stimulation of the carotid sinus nerve).
There are however studies which support the notion that rhythmic ventilation during wakefulness is sustained by a wakefulness drive. Skatrud & Dempsey (1983) and Skatrud & Berssenbrugge (1983) both produced apnea in sleeping subjects, but failed to do so while the subjects were awake. In both experiments the hyperventilation was induced passively. Further, Fink (1961) did not find a significant difference between passive and active methods of hyperventilation in their ability to selectively produce apnea during sleep. In conclusion, it would appear that associated with wakefulness, there is a non-chemical stimulation of ventilation, and that this stimulation is sufficient to obviate the need for chemoreceptor mechanisms.
3.3.3 Clinical Evidence for a Wakefulness Drive
The presence of obstructive apnea during sleep, in patients who breathe normally while awake, can also be viewed as a reflection of the influence of wakefulness. St. John (1986), in a study using decerebrate, vagotomized, paralyzed and ventilated cats, found that motoneurons to upper airway muscles are more dependent upon medullary and pontine reticular mechanisms for their respiratory modulated activities than are motoneurons to the diaphragm. In some animals augmentations of reticular activity were necessary for respiratory modulated trigetninal activities to be manifested at all. Douglas (1984) has argued that this evidence, together with the changes in upper airway resistance during sleep, provide the necessary and sufficient elements to explain the presence of obstructive apnea at sleep onset.
Central apnea, while being much less common than the obstructive form, can also be viewed as partially due to the withdrawal of a wakefulness stimulus. White (1985) commented that normal sleepers respond less to both hypoxia and hypercapnia and have a reduced dependence on information from chemoreceptors in order to drive respiratory musculature. He concluded that with "further attenuation of ventilatory drive central apneas may occur" (p. 1210). Finally, Plum (1970) reviewed many clinical studies which indicated that medullary depression, or compression, can disproportionally damage the metabolic or automatic control of breathing. Typically, the result is that respiratory homeostasis can be maintained during wakefulness but not during sleep.
3.3.4 Changes in Brain Stem Influences on Respiration
medialis in the pneumotaxic centre and in the medulla that are related to sleep-waking state" (p. 96).
Evidence that fewer medullary neurons fire in association with respiration during sleep was provided by Orem, Montplaisir & Dement (1974). Working with cats, they identified twenty-two cells at the level of the facial nucleus, that displayed an alteration to their firing pattern between wakefulness and sleep. Seventeen reduced their discharge frequencies eventually ceased firing, and five reduced their intra-burst frequency while maintaining respiratory rhythmicity. While variation existed in the timing of the state related variations, the authors also reported an increased probability of altered activity with increasing depth of slow-wave sleep and with REM sleep. Orem & Dement (1975) reported that the slower, more regular respiration in NREM sleep, was associated with long and regular discharge bursts from the ventrolateral medullary neurons. The conclusion of the authors, was that there was an apparent reduction in the number of medullary neurons showing respiratory related activity during sleep. In addition, the reduction began in NREM sleep (or even drowsiness) and progressed into REM (Orem & Dement, 1975).
An alternative approach to investigating brain stem involvement in a wakefulness drive has involved the manipulation of the quality and quantity of inputs allowed to reach brain stem structures. Sullivan et al. (1978) investigated dogs while awake and asleep, and with and without blockade of vagal afferent information. They reported that the combined loss of wakefulness, vagal stimulation, and peripheral chemoreception, led to the depression of ventilation (then under the sole control of central chemoreceptor mechanisms). The authors concluded that the results supported the concept of a tonic respiratory drive related to wakefulness, which, "mostly originates in the reticular activating system, has powerful effects on breathing and is clearly related to the sleeping - waking processes" (p. 16).
3.3.5 Higher Brain Centre Influence on Respiratory Control
In a 1970 review, Plum also referred to a cerebral drive that provides an important component to the volume of breathing during wakefulness. He claimed that the cerebral respiratory activating system is "easily dampened by natural sleep, sedatives, illnesses which dull alertness or produce delirium and neurological illness which produce bilateral structural damage to the hemispheres" (Plum, 1970, p. 166). He also indicated that facilitation of respiration is only provided by a limited number of cerebral points, which are located mainly in the classic somatic motor and pre-motor areas. He went on to comment that in contrast to this relatively limited facilitatory input, large areas of the cerebral hemispheres inhibit respiration. Further, these inhibitory areas comprise most of the hemispheric contribution to the limbic system.
Phillipson (1978) has argued that behavioural influences on respiration should be separated into "state-dependent" and "behaviour-related", and that even in the absence of behavioural ventilatory activities, wakefulness per se has a stimulatory effect on breathing. Phillipson concluded that the state influence depends on the overall degree of mental alertness. This was supported experimentally by Bulow (1963), who reported increases in ventilation associated with moving from a quiet waldng to a tense alertness condition occasioned by the performance of complicated mental tasks. Asmussen (1977) emphasised this point, commenting that, "all sensory and intra -cephalic signals that impinge on the reticular formation may play a role in the regulation of respiration" (p. 89).
NREM sleep — and in particular slow wave sleep — it is under sole command of the metabolic system (Cherniack, 1981; Parmeggiani, 1979; Phillipson, 1978; Plum, 1974; Sullivan, 1980). It is generally accepted that the behavioural control system that enables respiratory musculature to be used for non-respiratory purposes such as vocalisation, and to place respiration under voluntary control, arises in cortical and forebrain structures (Plum, 1970).
3.4 The Relationship between EEG and Measured Respiratory Changes
This review of the literature presents evidence for respiration being under the excitatory influence of a wakefulness drive, a drive which becomes inactive with sleep. In addition, the literature suggests that the ventilatory changes accompanying loss of the wakefulness drive should demonstrate two characteristics. Firstly, they should be systematically related to variations in brain activity. Secondly, because they are mediated by neural mechanisms, they should be relatively rapid.
Naifeh and Kamiya (1981) reported the only attempt to quantify the temporal association of EEG and respiratory changes. In a study using twelve subjects they reported that on average sustained rises in carbon dioxide tension occurred eight seconds before the occurrence of stage one sleep. The range, however, was from 140 seconds before, to 36 seconds after stage-one onset. The method in which the authors defined respiratory decreases casts doubt on the usefulness of the above result. A value for a respiratory variable was recorded during quiet wakefulness (point a), as was its value at the onset of stage one sleep (point b). The change in the variable was defined as occurring when fifty per cent of the a - b difference was attained. Thus the determination of the respiratory change ignored fluctuations in arousal which occur during the transitional stage 1 sleep phase and the respiratory changes could not be specifically linked to arousal level. In addition, the respiratory change was defined in such a way that the change had to occur after the loss of clear wakefulness, but before stage 2 sleep. With these methodological factors considered, results of this study support anecdotal reports that substantial changes occur around sleep onset, but they do not identify the critical events during the transitional phase, nor do they eliminate the possibility of changes during stage 2 sleep.
alpha-theta transitions, so that whether or not ventilation decreased during the EEG transitions, as defined above, remained undetermined.
3.5 Summary
Respiration is under behavioural and metabolic control during wakefulness, the behavioural control consisting of both voluntary and state-related elements. During NREM sleep, behavioural control is absent and respiration is controlled solely by metabolic mechanisms. These display an alteration of the set point relating ventilation to the partial pressure of carbon dioxide, as well as, diminished ventilatory responsivess to the stimuli of hypoxia and hypercapnia.There is now evidence to suggest that the variation in the set point and chemosensor responsiveness are due to the removal of the state related behavioral component which can be termed a "wakefulness drive to respiration".
CHAPTER FOUR
CHAPTER FOUR
VENTILATION DURING SLEEP ONSET IN MALE SUBJECTS
4.1 Introduction
The evidence reviewed in the previous chapter demonstrates that ventilation falls
during sleep, possibly in close association with sleep onset. This change may be partly
due to a fall in metabolic rate and to an increase in upper airway resistance. However it
has also been suggested that the reduction in ventilation during sleep may be partly due
to the inactivation of a wakefulness drive to respiration. As this inactivation is thought to
be mediated by neural mechanisms and linked to arousal, the change in ventilation
would be expected to be associated with measures of arousal such as the EEG, and
occur rapidly.
The aim of the present thesis is to test this hypothesis. The specific aim of the first
experiment is to test the prediction that ventilation decreases in association with changes
in arousal state, and to determine if a specific change in arousal state, as indicated by the
EEG, is systematically associated with this ventilatory reduction in male subjects.
4.2 Method
4.2.1 Subjects and Design
Five young male subjects (aged 19 to 23) free from respiratory and sleep pathology,
each spent two adaptation nights in the laboratory followed by between six and eight
nights in which data was collected for analysis. The event of interest in the study was
sleep onset and consequently a number of sleep onsets were recorded in each session.
(radio) stimulation for approximately thirty minutes and then instructed to go to sleep, at
which time the lights and any devices to aid wakefulness were switched off.
After sleep had been achieved and maintained for at least thirty minutes, the subject
was re-awakened and the procedure repeated. For analysis purposes each subject was
treated as a separate experiment, with each sleep onset as a replication. The number of
sleep onsets obtained was 16, 20, 14, 10, and 15 for D.L., M.L., S.G., M.W., and
A.H. respectively. Thus the average number of sleep onsets obtained each night was a
little over two. The heights and weights of the subjects were as follows: D.L. 196 cm
and 82 kg; M.L.172 cm and 61 kg; S.G. 178 cm and 66 kg; M.W. 172 cm and 66 kg;
and A.H. 188 cm and 92 kg.
4.2.2 Equipment
Each subject wore a C.I.G. anaesthetic mask, attached to a Rudolph #2700 two-way
• breathing valve. The dead space of the valve was 118.8 ml. and, as the mask dead space
depended on facial configuration, the total dead space varied between 213 ml and 263
ml. The mask was fitted with an inflatable cuff and was held tightly in place with a head
strap. The subjects were trained in the detection of air leaks and were instructed to check
for them during the wake periods; the experimenter closely watched the ventilation
record during data collection and any transitions in which it was thought that a leak was
occurring were aborted 'sand the equipment checked (only three such situations
occurred).
An outlet in the breathing valve at the point at which the mask joined the valve led to
an Applied Electrochemistry S-3A Oxygen Analyser, via a heating unit and 110 cm. of 1
mm. internal diameter tubing. The rate of expiratory air flow was measured by a Fleisch
pneumotachograph connected to the outlet of the breathing valve and a Gould PM 15E
pressure transducer. The output signals of both the 02 analyser and the pressure
D.E.C. PDP-11/23 computer via an eight bit analogue to digital converter. The collected data was stored on either floppy discs or a thirty megabyte Winchester hard disc. Software running under RT11 Pascal was developed in the laboratory to enable the online display, via a high resolution graphics screen, of data entering the computer. In addition, information relating to the integrity of the data collected was available to the experimenter throughout the experimental session via paper chart, a variety of digital volt-meters, and computer alarms.
The oxygen analyser was calibrated to ambient fresh air at the beginning of each session and to known concentration tank air periodically. The subject bedroom was ventilated with fresh air throughout the period of the experimental session and the room heated to between 23°C and 28°C. As mentioned above it was necessary to use either video movies or radio during wake periods to ensure that the subjects remained awake for a sufficient period at the beginning of each sleep onset. Whilst such devices are potential sources of artifact, in that they provide sensory stimulation and increase reticular activity, their use was found to be the least disruptive method of ensuring clear wake activity. Alternatives such as alarms or intercom systems to signal the subjects loss of clear wakefulness were found to produce body movement.
The EEG was recorded via disk electrodes applied to position C3 or C4, and a single EOG via electrodes vertically displaced on the outer canthi of the eyes. Both measures were amplified and together with a duplicate of air flow and 02 % were recorded on paper chart.
4.2.3 Variables
level (Fet02); minute ventilation (YE); minute 02 consumption (V02); and minute estimates of YE extrapolated from individual breath values. It should be noted that 02 consumption values during non-steady states are inaccurate because of the buffering effects of 02 stores. As a consequence V02 has only been reported during stable wake and following the attainment of stable sleep (stage 2). CO2 values were not measured as a CO2 analyser was not available.
Sleep state was ascertained for consecutive one minute epochs from the EEG and EOG recordings by an experienced scorer using the standard criteria of Rechtschaffen and Kales (1968). In addition, during particular portions of each sleep onset, the EEG associated with each breath was classified into three categories according to the dominant frequency band: alpha or beta (wake); theta (stage 1); or theta in association with spindles or K complexes (stage 2). For the purposes of analyisis, "dominant" was defined as the frequency which was present for more than 50 per cent of each breath.
4.2.4 Data Analysis
night, of the sleep onsets.
The relationship between respiration and wake/sleep state during sleep onset is difficult to determine, because the transitional phase between wake and the relatively permanent sleep state of stage 2 is characterised by a period of variable duration during which rapid fluctuations in state occur. With this characteristic in mind, five approaches to data reduction, each describing a slightly different aspect of the relationship, were developed. There were a number of reasons for developing five different methods. First, each procedure could only be applied to a sub set of all sleep onsets; second, each procedure was applied to different components of sleep onset; and finally, several of the methods may have been open to influence by confounded variables. As a consequence, any single method was open to criticism. By using a variety of methods of data reduction it was possible to give a comprehensive description of the changes which occurred.
4.3 Results
Method One: Minute values from wakefulness to stage 2 sleep.
The initial analysis of the data summarised the changes in VE, V02, and Fet02 over the total sleep onset period. A sleep onset was identified for analysis if it had ten minutes of unambiguous wake followed by a period of mixed wake-stage 1 which in turn was followed by at least ten minutes of stage 2. Wake was identified by the presence of alpha, or beta activity, in the EEG, stage 1 by theta activity and stage 2 by theta activity accompanied by spindles and K complexes. Averages over sleep onsets, using minute values for wake (ten minutes), wake/stage 1 (variable interval) and stage 2 (ten minutes) then showed the general pattern of respiratory activity during sleep onset. The wake/stage 1 period was subjected to a Vincent curve procedure (Vincent, 1912). This allowed changes which occurred over different time intervals to be compared by dividing the variable length periods into a constant number of units. Thus the average values in each quarter of the wake/stage 1 period were determined for each sleep onset.
Table 4.1
Respiration during sleep onset : Minute values for male subjects
Subject Wake
(Last 10 mins)
Transition in Quartiles 1 2 3 4
Sleep (First 10 mins)
D.L. VE 6.77 5.63 5.00 4.91 4.29 4.45
N=11 V02 0.285 0.275
Fet02 15.97 15.65 15.13 15.03 14.77 14.79
M.L. VE 3.74 3.25 3.14 3.02 2.85 2.68
N=6 V02 0.245 0.227
Fet02 14.93 • 14.58 '14.60 14.52 14.46 13.72
S . G. VE 5.65 4.96 5.11 5.05 4.95 4.93
N=10 V02 0.210 0.205
Fet02 16.01 16.05 16.04 16.00 16.07 15.62
M.W. VE 5.13 4.56 4.49 3.98 3.71 3.35
N=7 VO2 0.201 0.162
Fet02 15.97 15.88 15.66 15.60 15.70 15.42
A.H. VE 6.52 6.02 5.40 4.89 5.14 4.93
N=11 VO2 0.345 0.303
Fet02 15.08 14.91 14.60 14.39 14.22 14.14
38
Figure 4.1
I- D
-10 -5 +5 +10
WAKE TRANSITION SLEEP
(minutes)
Figure 4.1 Minute ventilation for subject D.L. during the final 10 minutes of wake, the
transitional period of mixed Wake/Stage 1 sleep, and the first 10 minutes of Stage 2 sleep. The transition period which varied in length over sleep onsets has been divided into quartiles. The number of sleep onsets averaged was 11.
7
6
5
1.
3
2
VE
N
TILA
TION
,Is_les-e-ms. • DL
[image:56.554.62.540.44.591.2]Oxygen consumption was reduced 2% (S.G.) to 12% (A.H.) from wake to stage 2 sleep, with the reduction occurring in 84% of all sleep onsets (ranging from 60% for S.G. to 100% for M.L. and A.H.). As was discussed in the method section, consumption values were not calculated during the transition as indirect calorimetry is not a valid measure of energy expenditure in transitional phases, such as a rapid change in ventilation, as blood levels of 02 change less rapidly and thus 02 exchange at the alveoli does not reflect 02 utilization. The data indicated that metabolic rate fell over the sleep onset phase being lower in stage 2 sleep than during wake. However, the reduction in metabolic rate did not account for the total reduction in ventilation as Fet02 also fell in 100% of sleep onsets for each subject (see table 4.1).
In summary, sleep onset was associated with a relatively large reduction in ventilation, which appeared to begin early in the transitional phase. This reduction was partly due to a reduction in metabolic rate and partly a non-metabolic reduction in ventilatory drive.
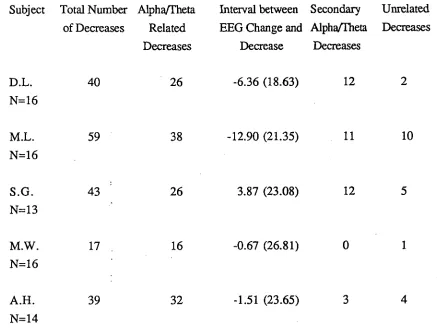
Method Two: The relationship between significant changes in ventilation and the EEG.
For this analysis a more restricted component of each sleep onset was used. This was the last two minutes of stable wake (though this period was shorter if body movements occurred within the two minutes), the transitional phase characterised by stage 1 sleep and recurrent brief arousals; and the first two minutes of stage 2 sleep. In one subject (M.W.), who had frequent awakening from stage 2 sleep before sustained sleep was achieved, the number of these transitions exceed the number of sleep onsets. Within this time the extrapolated VE was determined for each breath and the EEG during each respiratory cycle, was classified as beta/alpha, theta, or theta with spindles or K complexes (Stage 2 sleep). After applying the rules to identify significant ventilatory reductions, the beginnings of these changes were compared with the EEG classifications. The critical issue was whether the ventilatory reduction showed a systematic association with either a change from beta/alpha to theta, or from theta to Stage 2. The data showed that the majority of ventilatory reductions occurred in close proximity to beta/alpha - theta transitions.
Table 4.2
The relationship during sleep onset between significant decreases in ventilation and FRG activity in male subjects.
Subject Total Number Alpha/Theta of Decreases Related
Decreases
Interval between Secondary EEG Change and Alpha/Theta
Decrease Decreases
Unrelated Decreases
D.L. 40 26 -6.36 (18.63) 12 2
N=16
M.L. 59 38 -12.90 (21.35) 11 10
N=16
S.G. 43 26 3.87 (23.08) 12 5
N=13
M.W. 17 16 -0.67 (26.81) 0 1
N=16
A.H. 39 32 -1.51 (23.65) 3 4
N=14
While this analysis indicates that the cessation of alpha activity is the critical event associated with decreased ventilation, the method does not give an accurate estimate of the relationship between the two. This is because the ten point running average procedure introduces a bias towards an early estimate of the timing of the ventilatory change.
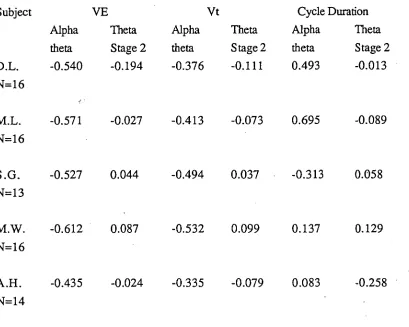
Method Three: Correlation analysis between ventilation and the EEG. The first two analyses indicated that the loss of alpha activity and the appearance of sustained theta activity in the EEG was the critical event associated with the reduction in ventilation. Further, the data suggested that the ventilatory changes were unrelated to the occurrence of Stage 2 sleep; the usually accepted criterion for sleep onset. This impression was confirmed by a correlational analysis between ventilation and the EEG stages. In this analysis the section of each sleep onset analysed was the same as in the previous method. In addition, the EEG classifications used were the same. The respiratory variables were extrapolated VE, Vt, and cycle duration. For each sleep onset two, point bi-serial correlation coefficients were computed, in which ventilation was the continuous variable and EEG state the discrete variable. In the first, the relationship between ventilation and beta/alpha versus theta EEG activity was assessed, while in the second, the relationship between theta versus Stage 2 sleep was determined. The data for theta activity for the alpha versus theta coefficient were taken from the entire transition as were the data for the theta versus Stage 2 coefficient.
Table 4.3
Average correlations between EEG and respiratory variables during particular phases of sleep onset in male subjects.
Subject
Alpha theta
YE Vt
Theta Alpha Stage 2 theta
Theta Stage 2
Cycle Duration Alpha Theta theta Stage 2 D.L. -0.540 -0.194 -0.376 -0.111 0.493 -0.013 N=16
M.L. -0.571 -0.027 -0.413 -0.073 0.695 -0.089 N=16
S.G. -0.527 0.044 -0.494 0.037 -0.313 0.058
N=13
M.W. -0.612 0.087 -0.532 0.099 0.137 0.129
N=16
A.H. -0.435 -0.024 -0.335 -0.079 0.083 -0.258 N=14
Analysis of Vt and cycle duration indicated a similar pattern for Vt as for extrapolated
VE, while cycle duration varied markedly across subjects in the extent to which it was
related to the beta/alpha versus theta state. Correlating Vt with beta/alpha to theta changes
gave coefficients ranging from -0.34 (A.H.) to -0.53 (M.W.). However, correlating Vt
to theta - stage 2 changes gave a range of coefficients from 0.10 (M.W.) to -0.11
(D.L.). Thus, as for minute ventilation, the change occurred in each subject with the loss
of wake activity. Cycle duration was correlated with the beta/alpha versus theta state in
two subjects: D.L. (0.49) and M.L. (0.69). This analysis shows that the change in
ventilation was associated with a reduction in Vt in all subjects while cycle duration
systematically increased in only two subjects.
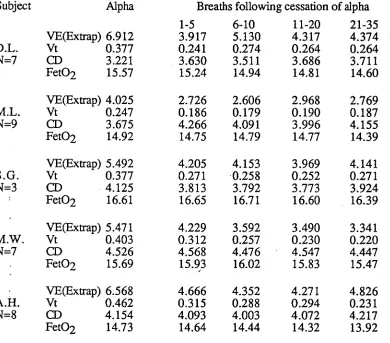
Method Four: Breath by breath values at alpha-theta transitions.
In order to more closely examine the relationship between ventilation and the
cessation of alpha activity, smooth and relatively rapid transitions into stage 2 sleep were
identified. The formal definition of these transitions was that there be at least one minute
of sustained wake activity which was followed by stage 1 theta activity, and eventually
stage 2 sleep without rearousals intervening. Transitions were also accepted if one brief
period of alpha (less than five seconds) occurred during the stage 1 phase. Having
identified these transitions, the data analysed was the last ten breaths before and the first
35 breaths following the onset of theta activity. The data was then averaged across
transitions within subjects in a manner analogous to Averaged Evoked Responses. The
variables were: extrapolated VE; Vt; cycle duration and Fet02. As noted above, 02
Table 4.4
Breath by breath changes in respiratory variables immediately before and after the transition from EEG alpha/beta to theta activity in male subjects.
Subject Alpha Breaths following cessation of alpha
1-5 6-10 11-20 21-35
VE(Extrap) 6.912 3.917 5.130 4.317 4.374
D.L. Vt 0.377 0.241 0.274 0.264 0.264
N=7 CD 3.221 3.630 3.511 3.686 3.711
Fet02 15.57 15.24 14.94 14.81 14.60
VE(Extrap) 4.025 2.726 2.606 2.968 2.769
M.L. Vt 0.247 0.186 0.179 0.190 0.187
N=9 CD 3.675 4.266 4.091 3.996 4.155
Fet02 14.92 14.75 14.79 14.77 14.39
VE(Extrap) 5.492 4.205 4.153 3.969 4.141
S.G. Vt 0.377 0.271 0.258 0.252 0.271
N=3 CD 4.125 3.813 3.792 3.773 3.924
Fet02 16.61 16.65 16.71 16.60 16.39
VE(Extrap) 5.471 4.229 3.592 3.490 3.341
M.W. Vt 0.403 0.312 0.257 0.230 0.220
N=7 CD 4.526 4.568 4.476 4.547 4.447
Fet02 15.69 15.93 16.02 15.83 15.47
- VE(Extrap) 6.568 4.666 4.352 4.271 4.826
A.H. Vt 0.462 0.315 0.288 0.294 0.231
N=8 CD 4.154 4.093 4.003 4.072 4.217
Fet02 14.73 14.64 14.44 14.32 13.92