research paper
Simulating farm income under the current soil
management regime in the mid-hills of Nepal
Gopal D Bhatta and Nilhari Neupane
Himalayan Journal of Sciences 6(8): 27–34, 2010
doi: 10.3126/hjs.v6i8.3243
Himalayan
JOURNAL OF SCIENCES
Archived
at
Simulating farm income under the current soil management regime
in the mid-hills of Nepal
Gopal D Bhatta
1*, and Nilhari Neupane
2...
1 Himalayan College of Agricultural Sciences and Technology, Purbanchal University, NEPAL2 Institute for Agricultural Policy and Market Research, University of Giessen, GERMANY
* For correspondence, email: bhattagopal[a]gmail.com
Farmers in the mid-hills of Nepal follow diverse farming systems. The peri-urban area of this region, where population density is higher, faces several problems in farming. While hills suffer from erosion because they are erodible, the peri-urban areas face the problem of decline in factor productivity, particularly in intensively cultivated farmlands. The present study is concerned with simulating farm income on a regional scale based on soil management practices. Spatial explicit simulation shows that the loss of farm income due to degradation is substantially higher in hills while it is lower in valley bottoms. Strategy formulation and testing in the spatial environment indicates that Geographic Information System is an appropriate methodological tool for simulating the consequences of particular interventions.
Key words: Mid hills, Nepal, spatial modeling, soil quality index, farm income
Himalayan Journal of Sciences 6(8): 27–34, 2010 doi: 10.3126/hjs.v6i8.3243
Copyright©2010 by Himalayan Association for the Advancement of Science
The mid-hills cover about 43% of Nepal’s land area (Shrestha 1992) and accommodate 46% of Nepal’s population. There is a great diversity of land use due to variations in topography, population density and market demand (Bhatta 2010a). The fulfillment of subsistence requirements has for centuries been the primary objective of the majority of the farmers in the mid-hills (Carson 1992; Brown 1997). However, in recent decades market-oriented production has emerged as a key driving force for land-use intensification in the densely populated urban fringes of Nepal (Brown and Shrestha 2000). While subsistence farming is characterized by the integration of livestock and forestry with agriculture and traditional modes of production, intensification is characterized by double or triple crop rotations, expanded cultivation of vegetable cash crops, and the imprudent use of agro-chemicals (Bhatta 2010a).
Road access, along with proximity to input markets, is the main catalyst for expansion of commercial farming (Brown 2003; Brown and Shrestha 2000) and consequent use of agro-chemicals (Bhatta and Doppler 2011). In the early 1980s agro-chemicals first appeared in newly accessible areas and their use quickly accelerated (Pokhrel and Pant 2008). The environmental and health costs of inorganic farming have by now been widely felt in Nepal, raising awareness of the issue of sustainability (Bhatta et al. 2009); meanwhile, agriculture based on organic practices and balanced application of inputs on family-owned farms in the peri-urban and rural areas has shown a great deal of resilience (Sharma 2006). This is because sustainable farming addresses many environmental and social concerns and offers innovative and economically viable opportunities for growers, laborers, consumers, and other stakeholders, as well as policymakers.
The problem of soil degradation exists in almost
all parts of the mid-hills of Nepal, but the severity varies depending on different factors. Cultivation of the sloping marginal hills leads to severe soil erosion, while the scars of the green revolution are visible in the urban and peri-urban flat lands. Bio-physical factors such as variations in weather, landforms, soil types and resource availability (Verbung et al. 2004) as well as socio-economic factors such as social structure, family composition and needs, have combined with economic opportunities, technological availability and political systems to affect land use evolution (Briassoulis 2000).
Spatial methodologies are commonly used for the analysis of socio-economic phenomena and their distribution along the spatial gradient (Bhatta et al. 2009; Codjoe 2007; KC 2005; Evans and Moran 2002; Schreier and Brown 2001; Bowers and Hirschfield 1999; Joshi et al. 1999). The present study integrates micro-surveys in a Geographic Information System (GIS) in order to model the current situation and predict future economic viability of family farms, assuming the persistence of prevailing soil management practices.
Materials and methods
rice-wheat cropping pattern, while cultivation in the rainfed uplands is typically based on maize. Both of these cropping patterns are exhaustive in nature. Since most farmers in the mid-hills lack irrigated land, they must rely on maize as their major food source. Currently, farmers are producing several species of vegetables, both for in situ consumption and for market. However, commercial vegetable farming based on widespread use of agro-chemicals has had negative repercussions on agro-ecology.
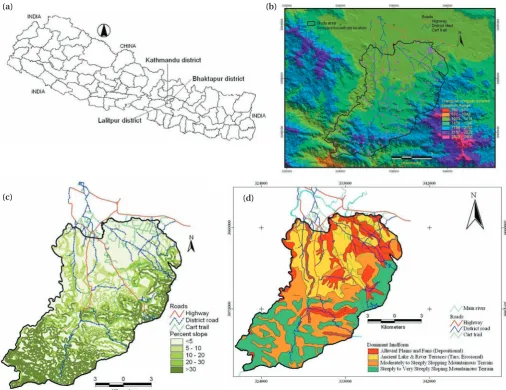
The peri-urban part of the study area is located mostly in the Bhaktapur District and partly in the Lalitpur District, while the rural area is located in the hilly part of Lalitpur District. Figure 1b shows that the study area is characterized by an altitudinal gradient ranging from 900 to 2500 meters above sea level (masl). Elevation ranges from 1500 to 1800 masl cover much of the area, with only negligible land surface at less than 1000 masl.
Slope of the study area, derived from digital elevation model (DEM), is expressed in percent. Slope at a given grid cell is estimated from elevation of the surrounding eight grid
cells. The following grid consists of nine grid cells labeled “A” through “I”. If “a” represents elevation of the gird cell “A”, “b” elevation of the grid cell “B”, and so on, then the slope for cell “E” (central cell) in the following grid is determined as follows (equation [i]):
% Slope = √(∆zx2+∆z
y2) ... (i)
where, ∆zx2 = [(a+2d+g)–(c+2f+i)]/(8 × cell size)
∆zy2 = [(a+2b+c)–(g+2h+i)]/(8 × cell size)
A
B
C
D
E
F
[image:3.575.37.544.310.700.2]G
H
I
Figure 1. The study area: (a) map of Nepal showing the Lalitpur and Bhaktapur Districts, (b) digital elevation model of the
study area, (c) slope (%) in the study area, and d) dominant landforms
(a) (b)
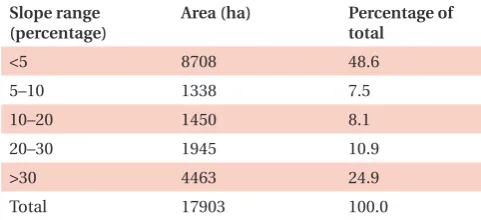
A sizeable part of the study area is flat or nearly flat (0 to 5%); most of the land has a steep slope (>30%) (Figure 1c, Table 1). The rural hills, in general, have steeper slopes than do the urban and peri-urban areas. Slope along with fragile landscape leads to severe soil erosion in hill farming systems throughout the country (Brown and Shrestha 2000).
Four dominant landforms are found in the study area (Figure 1d). Alluvial plains and fans, generally with a slope of less than 5%, are composed of deposits from floodwater or runoff and tend to be rich in nutrients. Most of the Kathmandu Valley bottom is comprised of these formations. Another group of landforms, the ancient lake and river terraces (locally referred to as tars), are formed by water erosion; they have a gentle slope. The forth type of landform is composed of moderate and steep slopes which are prevalent primarily in hilly part of the study area.
Sampling and the data The study was based on a cross-sectional study of 130 farms. Ninety households were selected through spatial sampling; the remaining 40 were selected at random. Spatial sampling was adopted in rural and peri-urban areas because little information was available about these scattered households.
Household data were collected using a standard questionnaire prepared subsequent to a pilot study and administered through personal interview. The spatial data were collected from already available maps. These data include elevational contours, dominant landforms, soil types, roads and other infrastructure.
Integrating socio-economic data into the GIS This paper represents an attempt to develop a model by which farm income over years can be simulated based on a degradation scenario. The methodological framework entails integrating micro-survey data into a spatial environment. Farm income was calculated taking into account many facets of the farm economy, including production costs and market prices of crops. Farm income was integrated into the GIS database using Global Positioning System (GPS). Prior to spatial integration, the significance of the farm income variable was subjected to a test of spatial autocorrelation using Geary’s Ratio and Moran’s I. It was then subjected to spatial interpolation using Inverse Distance Weighting (IDW) to generate the output grid surfaces in which the value of each cell was 25 meters by 25 meters. The interpolation was performed based on the values of 12 neighboring sample points and their distance to the point of estimation. A linear trend in the sample data was assumed in the IDW.
We produced the digital elevation model (DEM) incorporating terrain parameters such as slope and elevation. Cost-distance analysis and dominant landform with land management practices along the spatial gradient were incorporated in the regional spatial model. Cost distances from farms to market center were calculated using the GIS-based cost weighted distance model (ESRI 1997). Biophysical variables such as road infrastructure and slope were considered in the cost-distance modeling. This technique is based on the idea that a relative "cost" can be associated with moving across each cell in a map (ESRI 1992).
The cost of moving across a cell is calculated as the cell size (in meters) times a weighting factor based on the quality of the road and associated factors of the cell such as slope. The least-cost model evaluates the cost of moving between two designated source areas (from household location to market center) by calculating, for each cell, the cumulative weighted distance between the cells and the two sources.
Soil quality weighting In preparing a comprehensive soil quality weighting for the study area, we considered dominant landforms available and four soil management practices commonly followed by the farmers.
Landforms are composed of typical varieties of soil with varying production potentials. Dark soils containing alluvial deposits, for instance, have good capacity to retain water and to supply nutrients (Singh et al. 2007), the essential requirements of the majority of crops (Rajbhandari and Bhatta 2008). Lands rich in this first type of soil were given a high score. The second group is composed of soils around ancient lakes and river terraces, which have a higher rate of erosion than the first class. These lands are composed of hills with narrow valleys and elongated ridges; predominantly occupied by soil that is well to excessively drained, loamy skeletal in texture, slightly acidic (pH 5.2 to 6.9), with a shallow rooting depth (Singh et al. 2007). Lands dominated by these types of soils grow food crops successfully, but yields are not comparable to those of the higher-weighted class described above.
A third landform type is composed of mountainous terrains with moderate slope, generally suitable for subsistence farming; the cost of land management is greater here than on flat lands. This landform was given lower weight than the classes discussed above. The fourth landform group is composed of mountain terraces with steep to very steep slopes, thin soil with stony subsoil; they are subject to severe erosion by both wind and water (Müller-Böker 1991). The cost of land management is excessively high due to the rugged terrain. This group of lands has been given the lowest score. The difference between scores for alluvial flat lands and for mountainous terrain was calculated using the gross margin of rice. The ratio of the gross margin of rice in both classes is approximately to 1.5. The difference in the productive potential of two landforms composed of alluvial soils is very slight. They were, therefore, given higher values with narrow difference. Similarly, in weighting mountainous terrains with
Table 1. Area distribution under different slopes in the study area
Slope range
(percentage) Area (ha) Percentage of total
<5 8708 48.6
5–10 1338 7.5
10–20 1450 8.1
20–30 1945 10.9
>30 4463 24.9
moderately steep and very steep slopes, we considered the gross margin of maize; the ratio between the gross margins of maize in steep and very steep slope lands turned out to be 1.2. Therefore, we assigned a value of 1.70 to steep land and 1.40 to very steep land (Table 2).
Soil management practices Fertility management practices followed currently are balanced fertilizer application, use of agro-chemicals only, use of manure only and unbalanced application of manure and fertilizers.
Balanced fertilizer application
This refers to soil management practices employed by organic growers around the peri-urban areas. Farmers using these practices apply organic manure and other locally available resources. They also follow other fertility management practices such as intercropping, terracing and application of farm waste to crops. Pest control is generally implemented by means of local materials and botanicals.
Use of agro-chemicals only
Commercial vegetable growers in the peri-urban areas follow this practice. Most farmers using agro-chemicals are near input markets. Generally, exhaustive crops and their rotations are followed. Farmers experience decline in partial factor productivity of fertilizers and pesticides in their farmlands.
Unbalanced application of manure and agro-chemicals
This is a kind of intermediate practice and is followed by some farmers in the peri-urban area. Farmers apply both organic manure and inorganic fertilizers. Although farmers
do understand the value of organic manure in agriculture, chemical fertilizers are applied in concentrations so high that the buffering capability of the manure is overwhelmed.
Use of farm manure only
Farmers in rural areas follow this practice, in which crop nutrients are derived solely from locally-produced manure. Some farmers apply inorganic inputs, but the amount applied is so negligible that we would not characterize the practices as “inorganic farming.” Rather, this mode of agriculture is more often referred to as organic by default or organic by neglect. The quantity of nutrient supplied to the crops is far below the crops’ requirements, and the organic manure applied in the field is not enough to prevent soil erosion. Therefore, this form of soil management is not considered sustainable.
Balanced input application is important for good yields, and is considered one of the key components of sustainable agriculture. Consequently it is assigned a high value (2.00), followed by intensive land management based on inorganic inputs (1.90). Application of higher amount of inorganic fertilizer can make good yields likely, but a small amount of farm manure applied is unable to improve edaphic environ-ment. Therefore, unbalanced application of organic manure and inorganic fertilizers this soil management practice is weighted at 1.80. The last category of management is traditional subsistence farming. Manure application is not enough to provide the nutrients required for a good yield. Lands managed in this way are accorded a low weighting (1.50).
[image:5.575.40.539.462.723.2]After assigning a weight to each farm based on dominant landform and land management, we produced a map representing these characteristics using GIS overlay
Table 2. Land quality weighting based on landforms and farmers’ practices of soil fertility management under current and
the future scenarios (degradation scenario)
Landform Land management
Current scenario Soil degradation scenario
Landform Management Combined Degradation Combined
Alluvial plains and fans (depositional)
Unbalanced 1.40 1.80 2.52 1.62(10) 2.27
Manure 1.40 1.50 2.10 1.35(10) 1.89
Balanced 2.00 2.00 4.00 2.00 4.00
Chemical 2.00 1.90 3.80 1.77(7) 3.54
Lake and river terraces (tars, erosional)
Unbalanced 2.00 1.80 3.60 1.71(5) 3.42
Manure 2.00 1.50 3.00 1.50 3.00
Balanced 1.90 2.00 3.80 2.00 3.80
Chemical 1.90 1.90 3.61 1.71(10) 3.25
Mountain terrains with moderate slope
Unbalanced 1.90 1.80 3.42 1.67(7) 3.17
Manure 1.90 1.50 2.85 1.46(3) 2.77
Balanced 1.70 2.00 3.40 2.00 3.40
Chemical 1.70 1.90 3.23 1.58(15) 2.69
Mountain terrains with steep to very steep slope
Unbalanced 1.70 1.80 3.06 1.62(10) 2.75
Manure 1.70 1.50 2.55 1.35(10) 2.30
Balanced 1.40 2.00 2.80 2.00 2.80
Chemical 1.40 1.90 2.66 1.58(15) 2.21
technique. The generalized formula to calculate the combined index is:
(SQpresent)i = (Wl× Wmp)i………... (ii)
(SQfuture)i = {Wl× (Wmp– Wmp × %R)}i……….. (iii) where each of the following values is associated with the ith cell: SQ
i, soil quality; Wl, weight attributed to
the landform; Wmp, weight associated with the current soil management; %R, reduction in weight due to soil management practices.
Following equation (ii), altogether 16 classes were formed in which the highest weight (4.00) was attributed to alluvial plain lands with balanced fertility management, while the lowest weight was assigned to steep-sloped mountainous terrains in the only fertilizer applied is locally-produced manure (2.10) (Table 2).
Results and discussion
Soil degradation scenario and land quality weightings Prac-tices such as continuous deployment of an exhaustive cropping pattern without prudent use of chemical fertilizers, abstinence from conservation measures and multiple cropping, and exploitation of marginal lands can exacerbate the problem of fertility degradation (Brown and Shrestha 2000). The single greatest cause of declining crop production is unbalanced fertilization (Rattan and Singh 1997). Unbalanced fertilizer application has led to a chronological emergence of macronutrients such as phosphorus and potash (P and K) and micronutrients such as zinc, sulfur and manganese (Zn, S and Mn) deficiencies. Even balanced application of macronutrients devoid of organic materials has been implicated in the deterioration of the physical, chemical and biological health of soil (Rattan and Singh 1997). Most farmers have realized that prolonged overapplication of fertilizers is not sustainable in the medium to long run (Joshi et al. 1996).
A decline in the partial factor productivity of nitrogen is generally due to a decrease in the nitrogen-supplying capacity of intensively cultivated lowlands (Cassman et al. 1994). A series of long-term experiments initiated in India and Nepal indicated the superiority of organic materials such as Sesbania aculeata (Mandal et al. 1992; Singh et al. 2000; Kundu and Samui 2000), FYM (Prasad and Sinha 2000) and residue (Singh et al. 2000; Prasad and Sinha 2000; Gami and Sah 1999; Bhatta and Subedi 2006) in enhancing soil quality and maximizing crop yields.
The rate of degradation in fertility also varies according to landform. For instance, the rate of soil decline is lower on plains than in hilly areas because of the compounding effects of steep slope and land structure. The decreasing use of organic matter and the land use shift from traditional subsistence farming towards intensive vegetable farming in the hill terraces will exacerbate land quality degradation in the future (Tiwari et al. 2009). Nevertheless, factor productivity on plains is declining because of the excessive use of agro-chemicals and continued monocropping of exhaustive crops (Bhatta 2010a). Soil acidification caused by urea is a common concern in most intensively cultivated areas (Brown and Shrestha 2000). Therefore, farmland with
balanced fertilizer management (application of substantial quantities of organic manure along with a small proportion of inorganic fertilizer, as well as legume intercropping, for example) would have almost same quality weighting in the future. By contrast, production practices that are heavily dependent on agro-chemicals will result in fertility decline (Bhatta 2010b). While in the alluvial lands the reduction due to intensive agro-chemical use is expected to be 5%, on river terraces with erosional land where agro-chemicals are abused, the fertility decline is assumed to be around 10%.
Results provided by running a soil erosion assessment model (Morgan et al. 1984) in the GIS environment show that annual soil loss rates are highest (up to 56 tonnes⋅ha−1⋅year−1)
on terraced slopes in hilly areas. Erosion from cultivated and grazing lands is a serious problem, and marginal upland agricultural sites are prone to a higher erosion rate (Brown and Shrestha 2000). If farm production is based solely on agro-chemicals, we would assign a weighting 15% lower than would otherwise be attributed to that land. Similarly, with unbalanced land management practices, weighting reductions of 5%, 7% and 10% from the basic land quality are attributed to farmland on alluvial plains, river terraces and moderate to sloping terrain, respectively. In the alluvial plains, farming based solely on the application of an ample amount of farm manure is an ideal strategy to restore fertility and produce an acceptable yield. No reduction in weight is considered under this management practice; it is weighted at the same value. The amount of manure applied by the farmers, however, cannot meet the nutrient requirements of crop plants and cannot prevent soil erosion to same extent it would on river terraces and higher sloped lands. Therefore, such practices entail weight reductions of 3% and 10% from the baseline for river terraces and sloped lands, respectively.
For the purposes of our calculations, the prices of inputs as well as outputs were held constant: we assume that the impact of future inflation will be roughly equal on both sides of the ledger. It is also assumed that there will be no technological change in crop production for the time span considered and that farmers will use the same amount of inputs as in 2007, our base year. Consequently, land management is the single largest factor influencing the performance of production systems in our projections.
[image:6.575.298.539.84.163.2]Following equation (iii), alluvial plains with balanced fertility management are accorded the highest quality score followed by river terraces with balanced application and alluvial plains where agro-chemicals are used. Under degradation scenario, there is no effect on soil quality under
Table 3. Model summary of the multiple regression
(dependent variable: farm income in †NRs⋅ha−1)
Parameters B β SE(B) t value
Constant −110504 2273 −57**
Cost-distance (minute) −2615 −0.25 19 −135**
Land quality 163200 0.56 0.05 301**
R2 = 61%, F-statistics (2, 282214) = 212500 (p<0.01)
balanced fertilizer application while there has been substantial decrement in soil quality on the sloping landforms (Table 2).
Base model
The GIS-based multiple regression model, in which farm income is the dependent variable and land quality and cost-distance to primary market are the independent variables, shows significant trends. All variables in the model have the expected direction of relationship (Table 3). The predictive power of the model is 61%. Higher predictive power of the model signifies its better fit in simulating farm income. A unit increase in cost-distance reduces farm income by NRs 2,615; a unit increase in land quality, ceteris paribus, increases farm income by NRs 163,200.
Interpolated observed farm income (NRs⋅ha−1)
along the spatial gradient is shown in Figure 2a
and estimated farm income using an emperical regression model are shown in Figure 2b. Both observed and estimated income have similar trends in accessible areas, while there is a mixed tendency at higher altitudinal gradients. This is because the regresion function underestimates income in the inaccessible areas. Similarly, both of the figures show declining farm income as one goes towards the rural setting from peri-urban areas.
Simulated model under land degradation scenario
Farm income under the soil degradation scenario was estimated using multiple regression, and the resulting functional form is presented inequation (iv). We used estimated farm income under the current regime (as shown in Figure 3a), and farm income under the degradation scenario was deducted from current income while the difference was taken as the impact of degradation. The explanatory power of the independent variables is slightly higher (R2=65%) under future scenario
(degradation situation) than that under the current situation (R2=61%). All of these coefficients are
highly significant in predicting the changes in farm income per hectare (ha). One unit increase in the cost distance, in terms of travel time in minutes, would reduce farm income by NRs 2,244 while a unit increase in land quality weighting would increase farm income by NRs 174,400, as given by the following equation:
Y = −135692 (−73**) − 2244 X1 (−129**) + 174400 X2 (376**) ………... (iv) (values in parentheses indicate t-statistic; ** indicates statistically highly significant with p<0.01)
R2= 0.65, F stat (2, 282212) = 260500 (p<0.01)
where Y is farm income, X1 cost distance and
X2 land quality.
Figure 3a shows estimated farm income (NRs⋅ha−1)
[image:7.575.247.540.56.594.2]regressed by assumed land quality weighting and cost-distance to primary market. Figure 3b depicts loss in farm income due to the future scenario (degradation situation) as compared to the present situation. The current situation shows three distinct areas with respect to farm income, viz.: high, medium and low income zones, the high-income zone being located in the peri-urban areas while medium- and low-income zones are located in rural areas.
Figure 2. Farm income (NRs⋅ha−1) based on current scenario: (a, top)
The loss of farm income due to degradation is substantially higher in the low income zone (mainly in the hills), where it goes higher than 15%, while it is very small (0–2%) in income areas. Within the high-income accessible region, there is almost negligible loss of high-income, particularly where farmers follow organic practices (apply ample amount of organic manure), whereas income loss goes as high as 10% in the commercial inorganic farming area. This is due to the fact that farming
in this zone is based solely on inorganic inputs whose continued use would reduce soil quality in the future. The higher loss of income in the rural area is basically attributable to low quality of the land associated with high erosion exacerbated by steep slopes.
The rural area is characterized by subsistence farming with poor standard of living. Income in most of remote areas ranges from less than 42,250–1,864,747 NRs⋅ha−1⋅year−1 and a loss
of 10–15% income would have a substantial impact on the standard of living. This shows that rural life depends heavily on local resources, especially soil, and their degradation would have enormous effects on the income generation potential of farmers.
Conclusion
Four dominant practices of soil fertility management are assumed in this study. The baseline spatial explicit model shows a clear variation in farm income along the spatial gradient. Balanced application is considered a sustainable way of enriching soil and hence restoring its fertility over time. Relatively inaccessible rural areas have lower farm income than peri-urban areas. Farm-families living in the higher altitude relatively inaccessible areas have a lower standard of living and they are highly dependent on farming for their subsistence needs. The low lying valley hinterlands with good road access and other infrastructure are more tractable in terms of agricultural enterprise, but agro-ecological degradation should be taken seriously. GIS-based socio-economic analysis and modeling is a key approach to the study of complex phenomena and formulation of policies for future development.
References
Bhatta GD and W Doppler. 2011. Smallholder peri-urban organic farming in Nepal: a comparative analysis of farming systems. Journal of Agriculture, Food Systems and Community Development 1(3), Advance Online Publication, doi:10.5304/ jafscd.2011.013.002
Bhatta GD. 2010a. Bio-farming and marketing in Nepal: through producer, consumer, trader and spatial perspectives. In: Doppler W and KC KB (eds), Farming and Rural Systems Economics and Biodiversity in the Tropics. Germany: Margraf Publishers. p 167–190
Bhatta GD. 2010b. Socio-economic and spatial assessment of smallholder peri-urban farming in the middle mountains of Nepal. In: Doppler, W and Bauer, S (eds), Farming and Rural Systems Economics Vol 117. Germany: Margraf Publishers. 231 p
Bhatta GD and M Subedi. 2006. Edaphic environment improvement of lowland rice (Oryza sativa L.) through local resources. Green Field Journal 4: 34–46
[image:8.575.32.330.52.581.2]Bhatta GD, W Doppler and KB KC. 2009. Spatial
Figure 3. Farm income (NRs⋅ha−1) associated with the future strategy
of land degradation simulated using a spatial explicit model: (a, top) simulated farm income (NRs⋅ha−1) under soil degradation scenario, and
differentiation in farming practices and their impact on rural livelihood: A case from hills of Nepal. In: Tielkes E (ed), International Research on Food Security, Natural Resource Management and Rural Development. Hamburg, Germany. 508 p Bowers K and R Hirschfield. 1999. Exploring links between crime and disadvantage in northwest England: an analysis using geographic information systems. International Journal of Geographic Information Science 13: 159–184
Briassoulis H. 2000. Analysis of land use change, theoretical and modeling approaches. The Web-book of Regional Science. http://www.rri.wvu.edu/WebBook/Briassoulis/contents.htm (Retrieved on 2010.01.25)
Brown S. 2003. Spatial analysis of socio-economic issues: gender and GIS in Nepal. Mountain Research and Development 23(4): 338–344
Brown S. 1997. Soil fertility, nutrient dynamics and socioeconomic interactions in the Middle Mountains of Nepal. Ph. D. dissertation submitted to Interdisciplinary Studies in Resource Management Science, University of British Columbia, Canada. 254 p
Brown S and B Shrestha. 2000. Market driven land use dynamics in the Middle Mountains of Nepal. Journal of Environmental Management 59: 217–225
Carson B. 1992. The land, the farmer and the future: a soil fertility management strategy for Nepal. ICIMOD Occasional Paper no. 21, Kathmandu, Nepal
Cassman KG, SKD Datta, DC Olk, J Alcantara, M Samson, J Descalsota and M Dizon. 1994. Yield decline and nitrogen balance in long-term experiments on continuous, irrigated rice systems in the tropics. Advances in Soil Science, Special Issue
Codjoe SNA. 2007. Integrating remote sensing, GIS, census and socioeconomic data in studying the population-land use/cover nexus in Ghana: A literature update. Africa Development 32(2): 197–212
ESRI [Environmental Systems Research Institute]. 1992. Cell-based modeling with grid. Inc. Redlands CA: ESRI
ESRI [Environmental Systems Research Institute]. 1997. Understanding GIS the Arc/Info method. Inc. Redlands California: ESRI. 602 p
Evans TP and EF Morans. 2002. Spatial integration of social and biophysical factors related to landscape change. Population and Development Review, Supplement to Vol 28. p 165–186
Gami SK and MP Sah. 1999. Long-term soil fertility experiment under rice-wheat cropping system. Soil Science Divison, Nepal Agriculture Research Council, Khumaltar, Nepal. p 12–34 Joshi KD, BR Sthapit and AK Vaidya. 1996. Indigenous methods
of maintaining soil fertility and constraints to increasing productivity in mountain farming systems. In: Joshi KD, Vaidya AK, Tripathi BP and Pound B (eds), Formulating a Strategy for Soil Fertility Research in the Hills of Nepal. Lumle Agricultural Research Centre, Nepal and Natural Resources Institute, UK. p 20–29
Joshi PK, S Pande and M Asokan. 1999. Socioeconomic dataset and use of GIS. In: Pande S, Johansen C, Lauren J, Bantilan FT Jr, (eds), GIS Analysis of Cropping Systems. New York: ICRISAT and Cornell University. p 55–63
KC KB. 2005. Combining socio-economic and spatial methodologies in rural resources and livelihood development: A case from Mountains of Nepal. Margraf Verlag, Germany. 237 p
Kundu AL and RC Samui. 2000. Long-term soil fertility experiment in rice-wheat cropping system in West Bengal. In: Abrol IP, Bronson
KF, Duxbury JM and Gupta KD (eds), Long-term Soil Fertility Experiments in Rice-Wheat Cropping Systems. New Delhi, India: Rice-Wheat Consortium for the Indo-Gangetic Plains. p 63–67 Mandal BK, UK Subudhi and YV Singh. 1992. Response of rice (Oryza
Sativa) to green leaf manure and prilled urea. Indian Journal of Agricultural Sciences 62: 432–435
Morgan RPC, DDV Morgan and HJ Finney. 1984. A predictive model for the assessment of soil erosion risk. Journal of Agricultural Engineering Research. 30: 245–253
Müller-Böker U. 1991. Knowledge and evaluation of the environment in traditional societies of Nepal. Mountain Research and Development 11: 101–114
Pokhrel DM and KP Pant. 2008. Policy concerns in organic farming promotion in Nepal. In: Chaudhary P, Aryal K and Tharu D (eds), Proceedings of the International Workshop on opprtunities and challenges of organic production and marketing in South Asia. Kathmandu, Nepal: Nepal Permaculture Group. p 143–151 Prasad B and SK Sinha. 2000. Long-term effects of fertilizers and
organic manures on crop yields, nutrient balance, and soil properties in rice-wheat cropping system of Bihar. In: Abrol IP, Bronson KF, Duxbury JM and Gupta KD (eds), Long-term Soil Fertility Experiments in Rice-Wheat Cropping Systems. New Delhi, India: Rice-Wheat Consortium for the Indo-Gangetic Plains. p 105–119
Rajbhandari BP and GD Bhatta. 2008. Food crops: Agro-ecology and modern agro-techniques. Kathmandu, Nepal: HICAST Publications. 266 p
Rattan RK and AK Singh. 1997. Role of balanced fertilization in rice-wheat cropping system. Fertilizer News 42: 79–97
Schreier H and S Brown. 2001. Scaling issues in watershed assessments. Water Policy 3: 475–489
Sharma G. 2006. Organic agriculture in Nepal: An analysis in to status, policy, technology and psychology. In: Sharma G and Thapa PB (eds), Proceedings of National Workshop on Organic Agriculture and Farming System in Nepal. Kathmandu, Nepal: Nepal Permaculture Group. p 3–14
Shrestha RK. 1992. Sustainable livestock production in the mountain agro-ecosystem of Nepal. In: Abington JB (ed), FAO Animal Production and Health Paper 105, FAO, Rome. Available: http:/ /www.fao.org/docrep/004/t0706e/T0706E02.htm via internet. Accessed 2010 May 10
Singh PK, G Singh and BK Tiwari. 2007. Critical evaluation of geo-environmental scenario of Damodar river basin. In: Singh G, Laurence D and Lahiri-Dutt K (eds), First International Conference on Managing the Social and Environmental Consequences of Coal Mining in India. New Delhi, India. p 435–445
Singh Y, SP Singh and AK Bhardwaj. 2000. Long-term effects of nitrogen, phosphorus, and potassium fertilizers on rice-wheat productivity and properties of mollisols in Himalayan Foothills. In: Abrol IP, Bronson KF, Duxbury JM and Gupta KD (eds), Long-term Soil Fertility Experiments in Rice-Wheat Cropping Systems. New Delhi, India: Rice-Wheat Consortium for the Indo-Gangetic Plains. p 14–21
Tiwari K, B Sitaula, R Bajracharya and T Børresen. 2009. Effects of soil and crop management practices on yields, income and nutrients losses from upland farming systems in the Middle Mountains Region of Nepal. Nutrient Cycling Agroecosystem 12: 26–41 Verbung PH, J van Eck Ritsema, T De Nijs, P Schot and M Dijst. 2004.