Papers and Proceedings of the Royal Society of Tasmania, Volume 136, 2002 159
WATER QUALITY IN KARSTLANDS AT MOLE CREEK, TASMANIA
by Rolan Eberhard and Ian Houshold
(with seven tables, one text-figure and two appendices)
EBERHARD, R. & HousHOLD, I., 2002 (31 :xii): Water quality in karstlands: a reconnaissance survey at Mole Creek, Tasmania. Papers and Proceedings of the Royal Society of Tasmania 136: 159-172. https://doi.org/10.26749/rstpp.136.159
ISSN 0080-4703. Department of Primary Industries, Water and Environment, Nature Conservation Branch, GPO Box 44, Hobart, Tasmania 7001, Australia.
Samples from 28 sites at Mole Creek were analysed for a range of water quality indicators. Low or negligible bacterial counts were o brained for sites with mainly forested catchments; cleared catchments gave more variable and generally higher resulrs. Higher turbidity and nitrate levels were recorded in cleared catchments, suggesting increased erosion and nutrient loading of streams. A comparison of water quality parameters at srreamsinks and related springs shows that the karst aquifer is not an efficient water purifier. Rapid capture of surface runoff via solucional openings, coupled with the pipe-like efficiency with which karst conduits transfer the water, constrains the potential for the karst aquifer to ameliorate water pollution problems. This connection between surface and underground environments is a key consideration for sustainable land management in karstlands. We conclude that karst aquifers have more in common with surface streams than non-karstic ground-water systems, in terms of their water purification properties. Water from two bores was found to be relatively free of microbiological pollution, despite being located in disturbed catchments. This suggests that ground-water sourced from bores is less affected by activities at the surface, alrhough further work is required to confirm this. Key Words: karst, water quality, coliforms, ground-water, geoconservation, land management, Mole Creek.
INTRODUCTION
Protection of water quality in karstlands is a significant health and environmental issue (Ford & Williams 1989, Gillieson 1996, Drew & Hotz! 1999). Ground-water circulation in karst typically involves integrated networks of solutionally enlarged conduits, including cave systems, with high hydraulic conductivity. Pollution from point inputs and diffuse sources entering karstic conduits can rapidly contaminate aquifers, threatening ecosystems and creating hazards for human health. These problems can be compounded by a range of practices, such as allowing stock access to streams with resultant fouling of waterways, land application of chemicals for agricultural, silvicultural and other purposes, inappropriately sited and maintained septic and grey-water systems and use of sinkholes and caves for disposal of waste including animal carcases.
Tasmania's karstlands are developed primarily in folded and faulted Ordovician limestones and Precambrian dolomites that occur across a spectrum of physiographic contexts ranging from coastal to alpine. The land use setting of the karsts encompasses forestry, agriculture, mining and urban settlement as well as essentially undisturbed wilderness in Crown reserves. There are few data on the effects of the various land uses on water quality within Tasmanian karst systems, although attention has been drawn to some unsustainable practices (Kiernan 1984, Houshold 1995, Eberhard 2001).
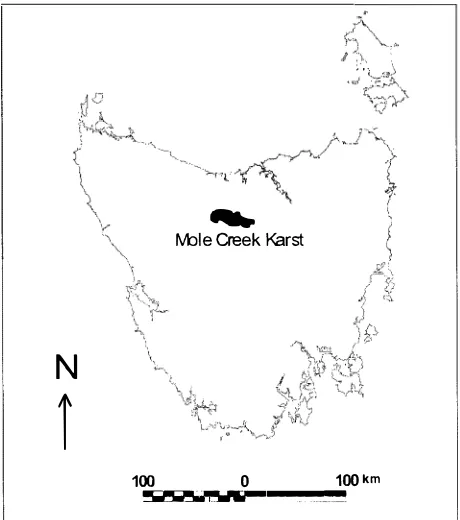
The Mole Creek karst is located on the lower slopes of the Great Western Tiers between Liena to the west and Golden Valley to the east, in the catchments of the Mersey and Meander rivers (fig. 1). Annual rainfall is 1000-1100 mm at Mole Creek township (240 m asl) but probably reaches 1700-1800 on the Great Western Tiers (1200-1300 m asl). The karst is characterised by well-developed and complex subterranean drainage involving numerous caves, streamsinks and springs (Brown & De Vries 1958, Burns & Rundle 1958, Jennings & Sweeting 1959,Jennings
&James 1967, Kiernan 1984, Kiernan eta!. 1994). Surface run-off is limited due to rapid infiltration of precipitation and stream capture by subterranean conduits. The majority of streams rising on surrounding non-karstic rocks sink underground shortly after crossing the geological contact at the limestone margins. Tracer studies indicate that ground-water transfer within the aquifer can be rapid. Flow velocities of 30-100 m/hr are probably typical for ground-water moving through solutionally enlarged conduits, although more rapid flows are known to occur at high discharges and/ or where steep hydraulic gradients
N
r
...
f'vble Creek l<arst
100 100km
•""'liiii/�l""'iiiil'lo,;;,,----·J'·�---J-... _J ... ---0
[image:1.571.300.530.506.766.2]exist. Under flood conditions, a flow velocity of 2181 m/ hr was recorded for an underground stream that flows from Rubbish Heap Cave to Lynds Cave (Kiernanetale 1994).
The speed of ground-water transfer within the aquifer, and the fact that this often occurs through caves and cavities which function as efficient pipes, suggest a greatly reduced potential for natural remediation of ground-water pollution problems in comparison to non-karstic aquifers.
The Mole Creek area is subject to a range of land uses including agriculture, forestry, urban settlement and conservation reserves. Dairy operations are a major component of local agricultural production. The principal township is Mole Creek (population 256). Although the township is supplied by surface run-off water piped from the Great Western Tiers, ground-water is an important supply source for many households and farms. Some houses are entirely dependent on the karst aquifer, which is sourced at springs or bores. Water is also diverted from natural sinking points by artificial channels to supply sites lower in the catchment. An export-based mineral water bottling enterprise is based at a karst spring near Caveside.
Previous studies of water quality at Mole Creek imply that some waters are relatively polluted with respect to bacteriological parameters (Kiernan1984, Dept. Agriculture unpub!. data1989, Meander Valley Council unpub!. data 1998-2001). Kiernan (1987) observed that "a potentially significant pollution problem may exist [at Mole Creek] and that there is a need for more detailed scrutiny and more careful management". Kiernan (1992) states that Tasmania's most heavily polluted spring is at Mole Creek. Water quality is generally discussed in terms of its suitability for consumption and use by humans, for food production or aquatic ecosystems (National Water Quality Management Strategy 2000). While these are clearly significant issues, water quality also impinges on weathering processes and soil-water interactions. As such, water quality can be a key issue in managing for sustainable land management and the protection and maintenance of natural geodiversity (DPIWE 2001). This issue is particularly pertinent in karstlands due to the importance of solutional process in shaping the geomorphology, including secondary carbonate deposition in the form of tufa and speleothems. At Croesus Cave, an outstanding sequence of rimstone dams, which have been deposited along a reach of cave streamway, are now being eroded by chemically aggressive waters (Eberhard 1993). The trigger for this seemingly recent change in stream geochemistry requires further investigation but Croesus Cave clearly illustrates the importance of water quality as a management issue for geodiversity protection in karstlands. Karst caves are also susceptible to degradation through human-induced changes to natural rates of erosion and deposition of clastic sediments. Many caves in cleared catchments at Mole Creek show evidence of post-settlement sedimentation by fluvially transported clays and soils.
The present survey of water quality was undertaken for the Natural Heritage Trust Mole Creek Karst Strategy, a project to promote sustainable land use practices at Mole Creek, taking account of a range of issues related to the karstic setting (Eberhard& Houshold2001). While some water quality data were available from previous studies, further sampling was considered worthwhile to clarify the extent of possible ground-water pollution problems, and to provide a more systematic basis for assessing anthropogenic impacts on the karst system. The water quality program
was seen as potentially useful in prioritising resources for stream protection and restoration works within the catchments of high conservation value caves.
STUDIES
Microbiology
Data are available for 51 previous samples collected in the Mole Creek karst catchment (tables1-3).
Physical and Chemical Parameters
A summary of data for selected physico-chemical water quality parameters at Mole Creek is presented in table 4. The comprehensiveness of the assays varies considerably between samples, some of which were analysed for only one or a few parameters (e.g. pH, conductivity). This sample set is biased in favour of lower catchment sites, particularly springs. Data for some parameters are based on a very limited sampling.
Methods
Thirty water samples were collected at28 sites around Mole Creek, Liena, Caveside and Chudleigh in June and July 2001. The sites include nine streamsinks (i.e. point inputs to the karst aquifer, typically surface streams that sink underground at cave entrances), eight karstic springs, nine surface streams and two bores. The surface streams are fed by a variety ofsources including karstic springs and surface run-off. The sample sites can be grouped as follows:
• Streamsinks in mainly forested catchments (five sites): Execution Creek, Sassafras Creek (upper sink), Grunter Creek, Lobster Rivulet (upper sink), Rubbish Heap Cave. • Streamsinks in partly cleared catchments (four sites): Sassafras Inflow, Howes Cave, Circular Ponds, Mersey Hill uvala.
• Springs in mainly forested catchments (two sites): Marakoopa Creek, Lynds Cave.
• Springs in partly cleared catchments (six sites): Lime Pit, Bachelors Spring, Kubla Khan Efflux, Scotts Rising, Wet Cave, Mersey Hill Cave.
• Surface streams (nine sites): Ration Tree Creek, Sassafras Creek (Ugbrook), Mole Creek (Den Road), Lobster Rivulet (Swimming Pool), Lobster Rivulet (Caveside), Lobster Rivulet (Chudleigh), Lobster Rivulet (Lobster Falls), Mersey River (Olivers Road), Mersey River (Kellys Bridge).
• Bores (two sites): Liena, Caveside.
Although classified above as mainly forested or partly cleared, the sites span a continuum from relatively undisturbed native forest to intensively farmed agricultural land. All the sites have been subject to some level of anthropogenic disturbance. With the exception of Mersey River (Olivers Road), the surface streams and bores sample sites are mainly cleared catchments. The streamsinks sampled can be considered surrogates for surface streams in undisturbed catchments.
Water in karstlands Tasmania 161
TABLE 1
Bacterial data for Mole Creek water samples*
Kubla Khan Cave Soda Creek Lime Pit
Little Trimmer Cave
Marakoopa Cave (Long Creek) Marakoopa Cave (Short Creek) Sassafras Creek ('springj') Sassafras Creek ('spring i') Sassafras Creek ('spring e')
Sassafras Creek ('main creek above spring e') Cowshed pool- G. Howe
Red Water Pot Mersey Hill Cave Den Cave Scotts Rising Wet Cave
Honeycomb I Cave
Total coliforms (per 100 mL)
110 2800 2700
o
300 70 30000 1100 200 2900 33000 8000 200 500 500 240 1300
Faecal coliforms (per 100 mL)
4 20 20
o
3 2 2800 650 30 280 14000 4000 80 80 40 4 40
Faecal streptococci (per 100 mL)
3
1
16·
o
3
3 2800 1300 70 80 2500 14000 100 60 13
7
110
*The samples were collected in June and August 1984, and reported by Kiernan (1984).
TABLE 2
Bacterial data for Mole Creek water samples*
Standard Plate Presumptive Total Presumptive E.coli Faecal Streptococci Count (per mL) Coliforms (per 100 mL) (per 100 mL) 36°C 20C (per 100 mL)
Wet Cave 1700 1600 <4 <2 <2
Lynds Cave 4 81 96 <2 4
Lime Pit 2000 17000 520 130 22
Union Cave 15 66 <4 <2 <2
Sassafras Cave 180 7100 240 140 40
Mole Creek (at township) 2100 1600 900 580 100
Scotts Rising 620 980 20 25 20
Spring E 540 560 60 <5 <5
*Collected by the Department of Agriculture on 9 March 1989 (M. Hart, pers. comm.).
in water quality as streams pass through the karst aquifer, as at Rubbish Heap Cave, which flows to the Lynds Cave spring; Execution Pot, which flows to the Lime Pit spring; Grunter Creek and Howes Cave, which flow to Kubla Khan Efflux; Circular Ponds, which drains to Bachelors Spring; Sassafras Creek (upper sink) and Sassafras Inflow, which feed a series of karst springs upstream of the Sassafras Creek (Ugbrook) site (this site also lies downstream of the Circular Ponds-Bachelors Spring system); Mersey Hill uvala, which flows to Mersey Hill Cave; and Lobster Rivulet (upper sink), which is considered the principal source of Lobster Rivulet (Swimming Poo!). Appendix 1 gives further information on the sites, including notes on their hydro-geological context and catchment integrity.
Discharge varied considerably between sampling dates, but on all occasions was subdued in comparison to typical
winter conditions. Stream stages were substantially lower on 6 June 200 1 than on subsequent collection dates. The intermittent Soda Creek Cave spring, which we had hoped to sample, remained dry throughout the collection period. Two sites (Bachelors Spring, Sassafras Creek at Ugbrook) were sampled twice, the second occasion being after heavy rain, to provide an indication of water quality variations with stage.
TABLE 3
Summary of bacterial counts for Mole Creek karst sites and 15 non-karst sites within the Meander Valley Municipality, 1998-2001 *
Mole Creek Limestone Creek Mole Creek Lobster Rivulet N on-karst sites above junction above junction below junction at Chudleigh monitored with Limestone with Mole with Limestone byMVC
Creek Creek Creek
Total coliforms(per 100 mL)
Number of samples 9 9 9 9 149
Maximum 6300 7600 7400 4200 40540
Minimum 140 ~980 460 210 12
Mean ~4710 ~3650 ~2750 ~1040 ~470
E.coli(per 100 mL)
N umber of samples 8 8 8 8 123
Maximum 5300 4000 ~3000 3800 3500
Minimum 92 270 76 140 <4
Mean ~1880 ~1920 ~1340 ~800 ~240
Faecal streptococci (per 100 mL)
Number of samples 8 8 8 8 123
Maximum 1300 ~1900 ~980 2000 26000
Minimum 4 44 24 24 <4
Mean ~330 ~410 ~400 ~350 ~350
* Meander Valley Council (unpub!. data). Note that Council records refer to Mole Creek above junction with Limestone Creek as 'Mole Creek at township', Limestone Creek above junction with Mole Creek as 'Stoney Creek above junction', Mole Creek below junction with Limestone Creek as 'Stoney Creek below junction' and Lobster Rivulet at Chudleigh as 'Lobster Creek' (D. Donovan, pers. comm.).
TABLE 4
Summary of water quality data for streamsinks, springs and autogenic percolation waters ('cave drips') from previous studies at Mole Creek*
Streamsinks Springs Autogenic percolation ('cave drips')
Temperature (OC) 9.8-11.0 9.0-10.4 9.4-9.7
Turbidity (NTU) 0-3 0-170
pH 5.5-7.44 6.99-8.61 8.1-8.3
Conductivity
(mS/cm at 25°C) 84-290 160-493 310-495
Total hardness (mg/L as CaC0
3) 11.6-33 49.2-252 ~140-~340
Bicarbonate alkalinity (mg/L as HC0
3) 17-42 90-325 87-320
Chloride (mg/L) 4.6 2.1-20 2.5-3.0
Sulphate (mg/L) 1.6-1.8 1.4-6.2 1.5-5.7
Calcium (mg/L) 3.0-8.3 26-84 23.5-96
Magnesium (mg/L) 1.3-2.9 2.1-12.0 4.0-31.5
Potassium (mg/L) 0.20-0.25 0.7-38 0.53-0.70
Sodium (mg/L) 3.0-3.25 2.6-14 3.6-4.2
Nitrate (mg/L) 0.2-1.0
Iron (mg/L) 0.005-0.2
Manganese (mg/L) 0.001-0.15
Cadmium (mg/L) <0.0001-0.0005
Copper (mg/L) <0.0001-<0.0005
Lead (mg/L) <0.001
Zinc (mg/L) <0.001-0.004
Sulphur (mg/L) 1-9
Boron (mg/L) 0.00-0.01
Molybdenum (mg/L) 0.00
Services Tasmania undertook chemical analyses (except ammonia) in accordance with NATA requirements. The following parameters were assessed:
• Alkalinity by APHA Method 2320/4500-C02; • Anions by Ion Chromatography APHA Method 411 OC; • Ammonia by Ion Selective Electrode APHA Method
4500-NH3;
• Metals by APHA Method 3030/3120; • Cations by APHA Method 3030/3120.
Temperature, pH and total dissolved solids (TDS) were measured in situ using WTW field pH and conductivity
meters. The instruments were calibrated in standards supplied by the manufacturer before each pH and conductivity measurement.
Turbidity was measured ex situ using a Hach 2100P
model optical principle turbidimeter. Samples were collected in polythene bottles and refrigerated for periods of days to weeks prior to analysis. As turbidity can change unless measured within 24 hours of collection (Chapman 1996), turbidity data obtained in this study should be considered indicative only.
RESULTS
Bacterial results for all samples are presented in tables 5 and 6. Physical and chemical results are summarised in table 7. The complete data are provided in appendix 2.
DISCUSSION
Microbiology
The microbiological data show considerable vanatlon between sites, with very low results recorded at the two bores, Rubbish Heap Cave and Mersey Hill uvala. Somewhat higher coliform levels were found at Sassafras Inflow, which yielded the highest microbiological counts in this study (560 TC, 350 FC, 280E. coli, 650 FS per 100 mL). The majority
of samples were found to contain only a few or tens of coliforms, in contrast with some high results obtained in previous studies. For example, a result of30 000 TC per 100 mL is reported for a spring on Sassafras Creek by Kiernan (1984), who records coliform counts of the hundreds to thousands at several sites. In 1989, coliforms were found in some samples, but were below detection limits in others (Dept. Agriculture unpubl. data 1989). The 1998-2001 samples collected by Meander Valley Council cover a smaller number of sites but have the value of continuity over time. Orders ofmagnitude for bacterial counts in these data range from hundreds to thousands per 100 mL, with average values being 1000-5000 TC, 1000-2000E. coli, and
300-400 FS per 100 mL.
The timing of samples with respect to rainfall events probably accounts for much of the variation between sample sets. In dry weather conditions TC, FC,E. coli and FS are
generally detected only at low levels «1 to 20-30 per 100 mL) in streams and inshore surface waters of lakes in undisturbed areas in Tasmania (Davies & Driessen 1997). Microbiological contamination of surface waters can be expected to increase following rainfall and persist for several days at hundreds or low thousands per 100 mL, but will tend to reduce within a few days (C. Garland pers. comm.).
Water quality in karstlands at Mole Creek, Tasmania 163
A similar effect is to be anticipated for ground-water samples collected from caves and springs in karstlands. The 1984 Mole Creek samples were all collected during heavy rain, which may explain some of the high results. Discharge conditions when the 1989 samples were obtained are unknown but may not have been high as sampling was undertaken in summer. In the present study, repeat samples for Bachelors Spring and Sassafras Creek (Ugbrook), show somewhat higher FC,E.coli and FS counts after heavy rain
on 13 June 2001, but the increase is far from dramatic and TC levels are reduced in the later samples.
The 2001 samples indicate substantial differences in microbiological levels between forested and cleared catchments (table 6). Streamsinks and springs in forested catchments were found to contain low or negligible bacterial contamination. In contrast, streamsinks in cleared catch-ments gave results ranging from negligible at Mersey Hill uvala, to more substantial counts (tens to hundreds) at the three other sites. Results for springs in cleared catchments are also mostly very low(s10 TC, FC,E. coli or FS per 100
mL), although a higher count was obtained at Bachelors Spring. Results for surface streams in cleared catchments range from nil to hundreds of coliforms, as at sites along the middle to lower reaches of Lobster Rivulet. In some cases there is evidence of a downstream increase in coliforms in surface streams (e.g. Sassafras Creek, Mole Creek), but the pattern is not universal (e.g. Lobster Rivulet).
Comparison of the 2001 results with data obtained by the Meander Valley Council at 15 non-karstic sites elsewhere in the municipality indicates that Mole Creek is not exceptional with respect to bacterial pollution, falling within the range of results recorded in other catchments (table 3). However, these data indicate that average TC levels at Mole Creek were 2-10 times higher than the non-karstic sites, while meanE. coli levels are 3-8 times higher. Mean
FS levels at Mole Creek are commensurate with those recorded at the non-karstic sites. The Lobster Rivulet (Chudleigh) result obtained in the present study falls towards the lower end of the range of results recorded at the same site by Council in 1998-2001. The mean and maximum values in samples collected by Council are one and two orders of magnitude higher than the results obtained in the present study. This result and the generally higher coliform levels recorded in 1984 and 1989 suggests that the present study sampled outside periods of peak coliform levels, highlighting the constraints of characterising water quality from small sample sets (Quinlan 1988). The council data for the Mole Creek area show considerable variation in coliform levels over time.
TABLE 5
Bacterial counts for Mole Creek water samples, June-July 2001
Site Date Total coliforms Faecal E. coli Faecal
(per 100 mL) coliforms (per 100 mL) streptococci (per 100 mL) (per 100 mL)
Ration Tree Creek 06/06/01 8 <1 <1 33
Liena bore 06/06/01 <1 <1 <1 <1
Rubbish Heap Cave 12/07/01 <1 <1 <1 <1
Lynds Cave 12/07/01 3 3 10
Lime Pit 06/06/01 4 2 2 <1
Execution Pot 06/06/01 4 3 3 3
Grunter Creek 13/06/01 7 7 7 10
Howes Cave 13/06/01 37 50 50 22
Kubla Khan Efflux 13/06/01 10 6 6 5
Marakoopa Cave 13/06/01 1 1 1 <1
Circular Ponds 13/06/01 310 230 230 110
Sassafras Creek (upper sink) 13/06/01 1 <1 <1 6
Sassafras Inflow 06/06/01 560 350 280 650
Sassafras Creek (Dgbrook) 06/06/01 260 27 22 68
Sassafras Creek (Dgbrook) 13/06/01 250 90 60 120
Bachelors Spring 06/06/01 460 16 16 17
Bachelors Spring 13/06/01 240 100 100 45
Mersey Hill uvala 12/07/01 <1 <1 <1 1
Mersey Hill Cave 12/07/01 39 39 39 2
Wet Cave 02/07/01 3 3 3 1
Scotts Rising 02/07/01 10 2 2 1
Mole Creek (Den Road) 02/07/01 210 90 90 58
Lobster Rivulet (upper sink) 02/07/01 6 3 3 <1
Lobster Rivulet (Swimming Pool) 02/07/01 160 100 100 49
Lobster Rivulet (Caveside) 01/07/01 200 44 44 20
Lobster Rivulet (Chudleigh) 01/07/01 70 40 40 9
Lobster Rivulet (Lobster Falls) 01/07/01 130 130 130 21
Caveside bore 01/07/01 1 <1 <1 <1
Mersey River (Olivers Road) 01/07/01 13 8 8 9
[image:6.572.57.528.101.489.2]Mersey River (Kellys Bridge) 01/07/01 370 310 310 470
TABLE 6
Summary of microbiological results (100% range) for different classes of site, Mole Creek, June-]uly 2001
Class of site Total coliforms Faecal coliforms E. coli Faecal streptococci (per 100 mL 0) (per 100 mL) (per 100 mL) (per 100 mL)
Streamsinks (forested) <1-7 <1-7 <1-7 <1-10
Streamsinks (cleared) <1-560 <1-350 <1-280 1-650
Springs (forested) 1-7 1-3 1-3 <1-10
Springs (forested) 3-460 2-100 2-100 <1-45
Surface streams 8-370 <1-310 <1-310 33-470
Water in karstlands at Mole Tasmania 165
TABLE 7
results for physical and chemical water parameters, Mole June-July 2001
Streamsinks Streamsinks Springs Springs Surface Bores (forested) (cleared) (forested) (cleared) streams
Temp. (OC) 5.1-9.2 6.6-9.2 7.9-8.2 7.6-10.6 4.9-10.5 10.0-12.8 pH 5.18-6.98 5.90-7.96 6.65-7.89 6.44-8.18 6.56-7.60 7.24-7.35
TDS (mg/L) 29-60 39-139 113-191 73-380 23-339 345-383
Turbidity (NTU) 0.2-1.3 1.1-5.6 0.4-1.3 0.2-23.4 0.6-14.1 0.3-0.4 Alkalinity C03(mg/L) <1 <1 <1 <1 <1 <1 Alkalinity HC03(mg/L) <1-21 4-56 42-83 25-186 4-164 159-176 Bromide (mg/L) <0.01 <0.01 <0.01 <0.01 <0.01 <0.01 Chloride (mg/L) 2.2-7.1 4.2-7.2 4.4-5.2 3.5-6.7 2.8-5.7 4.5-6.7 Fluoride (mg/L) <0.02-0.05 <0.02-0.04 <0.02-0.09 <0.02-0.04 <0.02-0.03 <0.02-0.05 Nitrate (mg-NIL) <0.03-0.12 <0.03-2.6 0.33-0.42 0.07-1.0 0.04-0.69 0.2-2.3 Nitrite (mg-N/L) <0.10 <0.10 <0.10 <0.10 <0.10 <0.10 Phosphate (mg-PIL) <0.10 <0.10 <0.10 <0.10 <0.10 <0.10 Sulphate (mg/L) 0.34-5.9 1.6-5.2 2.5 1.3-3.5 0.65-5.4 1.5-1.9 Ammonia (mg-N/L) <0.05-0.08 0.06-0.09 0.05 <0.05-0.09 <0.05-0.17 <0.05-0.18 Aluminium (mg/L) 0.032-0.682 <0.020-0.469 0.030-0.045 <0.020-0.566 <0.020-0.612 <0.020-0.051 Arsenic (mg/L) <0.005 <0.005 <0.005 <0.005 <0.005 <0.005 Cadmium (mg/L) <0.001 <0.001 <0.001 <0.001 <0.001 <0.001 Cobalt (mg/L) <0.001 <0.001 <0.001 <0.001 <0.001 <0.001 Chromium (mg/L) <0.001-0.001 <0.001-0.002 <0.001-0.001 <0.001-0.003 <0.001-0.002 <0.001 Copper (mg/L) <0.001-0.002 <0.001-0.001 <0.001 <0.001-0.002 <0.001-0.00 <0.001 Iron (mg/L) <0.02-0.537 0.022-0.308 0.024-0.037 <0.02-0.467 <0.02-0.745 <0.02 Manganese (mg/L) <'0.005 <0.005-0.018 <0.005 <0.005-0.007 <0.005-0.038 <0.005-0.02 Nickel (mg/L) <0.001 <0.001 <0.001 <0.001 <0.001-0.001 <0.001-0.002 Lead (mg/L) <0.005 <0.005 <0.005 <0.005 <0.005 <0.005 Zinc (mg/L) <0.001-0.007 <0.001-0.001 <0.001-0.002 <0.001-0.016 <0.001-0.011 <0.001-0.01 Calcium (mg/L) 0.94-5.42 2.24-37.7 14.6-31.8 6.49-69.8 1.25-61.9 40.7-63.7 Potassium (mg/L) <0.02-0.32 0.34-0.77 0.37-0.38 0.20-0.84 0.09-0.59 0.44-0.59 Magnesium (mg/L) 0.63-1.17 0.64-6.19 1.34-2.65 0.93-5.58 0.69-3.30 4.59 Sodium (mg/L) 1.05-5.30 2.99-5.95 3.36-3.71 1.89-5.66 1.23-4.74 2.81-3.53
show increases in coliform counts following transmission underground. This may best be explained by percolation water inputs from overlying paddocks, direct to cave streams via dolines. The Circular Ponds-Bachelors Spring, Sassafras Inflow/Sassafras Creek (upper sink)-Sassafras Creek (Ugbrook) and Grunter Creek/Howes Cave-Kubla Khan Efflux systems all show some attenuation; however, in comparison with non-karst systems this is minor. The Execution Pot-Lime Pit and Rubbish Heap-Lynds Cave systems both show very low levels of coliforms at both streamsinks and springs, as these systems have only minor disturbance. The Marakoopa Cave stream has negligible levels, presumably as a result of the relatively pristine state of the catchment within the Mole Creek Karst National Park.
In contrast to coliform levels at the karst springs, a lack of microbiological pollution was recorded at the two bores sampled. This is despite their locations within relatively disturbed and mostly cleared catchments. Adamski (2000)
studied water quality in a carbonate aquifer in the mid-western USA and found significant differences between springs and wells in terms of many physico-chemical parameters. He accounts for this by suggesting that whereas the water from the springs generally flows rapidly through large conduits with minimum water-rock interactions, water
from the wells flows through small fractures, which restrict flow and increase water-rock interactions. Adamski concludes that the springs are more susceptible to surface contamination than the wells. This could be true at Mole Creek, where the majority of springs are associated with well-integrated systems of solutionally enlarged conduits. However, the borehole at .one of the Mole Creek sample sites (Liena) intersected sands and40 mm rounded basalt cobbles in a cavity at a depth of100m below the surface. After heavy rain, the bore is reported to discharge turbid water. This strongly suggests a conduit-flow component at this site. Thus, it does not does appear to be universally true that bores at Mole Creek source water with prolonged ground-water residence times. Nevertheless, it seems that the bores could be less susceptible to ground-water pollution than springs, a possibility that warrants further investigation.
Physico-chemical Parameters
waters low in dissolved ions. This study found that run-off from Standard Hill, as sampled at Grunter Creek and Howes Cave, is considerably more acid than that from the Western Tiers, which is a major source area for the remainder of the karst. The tannin-stained appearance of run-off from Standard Hill suggests that acidity is boosted by drainage through peat soils. This effect is sufficiently pronounced to cause water emerging from karst springs at Kubla Khan Efflux and Bachelors Spring, which receive much of their flow from Standard Hill, to be slightly acidic. This is notwithstanding the buffering effect of contact with the limestone as the water passes through the aquifer. All other springs sampled in this and previous studies are about neutral or slightly alkaline, as would be expected due to carbonate dissolution processes within the aquifer. Levels of dissolved ions are low for all species analysed with the exception of calcium. The highest levels of calcium were recorded at springs, bores and surface streams fed primarily by springs. This conforms to accepted models of ground-water geochemistry within karst aquifers, whereby dissolution ofthe karstic bedrock releases calcium into solution (Ford&
Williams 1989).
Two parameters show a relationship with catchment disturbance. Streamsinks and springs in forested catchments show low levels of turbidity (0.2-1.3 NTU) , whereas turbidity at streamsinks, springs and surface streams in cleared catchments is more variable and often higher (0.2-23.4 NTU). The difference between the medians is statistically significant (U=34; P<0.05, Mann-Whitney U-test). Multiple samples along individual streams (Lobster Rivulet, Sassafras Creek and Mole Creek) all show increasing turbidity in the downstream direction, which would be consistent with a correlation between turbidity and the extent and intensity of disturbance. Of the ,..,80 results obtained by Eberhard (unpub!. data 1991), the highest levels of turbidity were recorded in disturbed catchments: Lime Pit (1-170 NTU) , Scotts Cave (12-126 NTU) , Soda Creek (0-10 NTU) and Sassafras Creek (8 NTU). The main cause of turbidity is the presence of fine suspended solids such as mineral particles derived from either erosion of soils in the catchment or erosion of stream banks (Gippel 1994).
The data also provide some evidence of a link between catchment disturbance and stream nutrient levels. Nitrate levels in forested catchments were found to fall in the range
<0.03-0.42mg-N/L,whereas a range of <0.03-2.3 mg-NI L was recorded in cleared catchments. The difference between the medians is statistically significant (U=26; P<0.05, Mann-Whitney U-test). Nitrate levels of 4.1-4.6
mglLwere recorded at Den Cave, Mersey Hill Cave and Den Spring by Kiernan (1984), but the significance of these data is difficult to assess. Nitrite and phosphate levels were below detection limits at all sites sampled in the present study. Sulphate levels show no obvious pattern, with the highest result (5.9 mg/L) being a sample from Execution Creek in a forested catchment. Ammonia levels are low in all samples (s0.18 mg-N/L).Elevated nutrient levels could be expected in disturbed catchments due to various effects including application of fertilisers, increased stream temperatures due to reduced stream shading from vegetation, excretion by stock and effluent from septic systems.
The above discussion suggests that, with the probable exception of turbidity, the effects of catchment lithology dominate over catchment disturbance as a control on
physico-chemical water quality parameters. However, a more detailed analysis of catchment effects is hampered by the small data set, precluding a more rigorous statistical comparison of different classes of site.
Comparison of physico-chemical data for streamsinks and related springs shows the following patterns:
• For the majority of systems, transmission through subsurface conduits has resulted in an increase in temperature, pH, TDS, turbidity, alkalinity, fluoride, nitrate, potassium, calcium and magnesium. Most of these increases are to be expected in karst systems in winter months. An interesting exception to this is the Mersey Hill uvala-Mersey Hill Cave system that shows an apparent decrease in calcium and magnesium at the same time as an increase in TDS and alkalinity. We suspect this is an error in either data collection or analysis. • Increasing levels of nitrate are an as yet unexplained phenomenon in many karst systems, occurring in both natural and disturbed systems. Increases are, therefore, not necessarily linked with fertiliser inputs; however, where levels exceed more than one order of magnitude, this should be suspected (1. Houshold, unpub!. data). Although levels are low, nitrate concentrations in some springs at Mole Creek show more than order ofmagnitude increase over their related streamsinks. This suggests that application of artificial fertilisers and sources of ammonia, typical of many agricultural and urban systems, is having a detectable influence on the nutrient status ofthe ground-water. Data from overseas indicate that nitrate used in agricultural systems is readily transferred to karst aquifers (Nebbache etal. 2001).
• Levels of chloride, sulphate, aluminium, iron, zinc and sodium exhibit approximately equal distribution of increase and decrease in concentration, most likely reflecting specific catchment lithologies and soil types. • In only a very few systems was a decrease in the
concentration of a species recorded. The majority of decreases were for iron, aluminium and ammonia, all likely to be lost through oxidation. The iron and aluminium may be precipitated out of solution, and the ammonia rapidly oxidised to nitrate.
Most of the other metals analysed showed very low concentrations, which did not appear to change as a result of transport through cave systems.
CONCLUSIONS
constrain the adsorption ofpollutants onto clays and organics or their breakdown through microbiological processes. This connectivity between surface and underground environments is a key consideration for sustainable land management in karstlands. We conclude that karst aquifers have more in common with surface streams, as opposed to non-karstic ground-water systems, in terms of their water purification properties. Bores may be an exception to the general pattern the two sampled in this study did not show obvious signs ofpollution, despite being located in disturbed catchments. The possibility that these sites are less affected by catchment activities warrants further investigation.
ACKNOWLEDGMENTS
We thank staffat Water Ecoscience Laboratory and Analytical Services Tasmania for analysing the samples. Dr Christian Garland (Water Ecoscience Laboratory) provided helpful advice on a draft of this paper, as did Stefan Eberhard (Caveworks, WA). Michael Hart (Department of Primary Industries, Water and Environment) gave permission to use unpublished data collected at Mole Creek in 1989. Danny Donovan at Meander Valley Council supplied results from Council's water quality program. We also thank Mole Creek landowners who gave access to sites on private property. This work was facilitated by the Natural Heritage Trust, which provided funding support for the Mole Creek Karst Strategy.
REFERENCES
Adamski, lC., 2000: Geochemistry of the Springfield Plateau
aquifer of the Ozark Plateaus Province in Arkansas,
Kansas, Missouri and Okalahoma, USA. Hydrological
Processes14(5): 849-866.
BROWN, F.R. & DE VRIES, M.H., 1958: The subterranean
hydrology of the Mole Creek area. Bulletin of the
Tasmanian Caverneering Club, 1(3): 9-15.
BURNS, K. &RUNDLE, A., 1958:The geology of the Mole Creek
caverns. Bulletin of the Tasmanian Caverneering Club,
1(3): 3-8.
CHAPMAN, D.,1996: Water Quality Assessments. 2ndedition, E.&
F.N. Spon, London.
DAVIES, P.E.&DRIESSEN, M.M.,1997: Surface Water Quality at
Three Key Locations in the Tasmanian Wilderness World Heritage Area: Report on a Pilot Monitoring Program.
Wildlife Report 97/2, Parks and Wildlife Service,
Tasmania, Hobart.
DEPARTMENT OF PRIMARY INDUSTRIES, WATER AND ENVIRONMENT,
2001: Mole Creek Karst National Park and Conservation Area Draft Management Plan 2001.Parks and Wildlife Service, Tasmania, Hobart.
DREW, D.&HOTZL, H., 1999: Karst Hydrogeology and Human
Activities: Impacts, Consequences and Implications.
International Contributions to Hydrogeology 20, AA
Balkema, Rotterdam.
EBERHARD, R.,1993: Large-scale Erosion ofGours in Croesus Cave,
Tasmania.Grad. Dip. Env. Studs. Hons. thesis, University of Tasmania.
EBERHARD, R. & KIERNAN, K., 1990: Little Trimmer project:
instrumented monitoring of the underground
environment. InS. Brooks (Ed.): Cave Leeuwin 1991,
Proceedings of the 18th Biennial Conference of the
Australian Speleological Federation:66-69.
Water quality in karstlands at Mole Creek, Tasmania 167
EBERHARD, R. & HOUSHOLD, 1., 2001: River management in
karst terrains: issues to be considered with an example
from Mole Creek, Tasmania.InRutherfurd,1.,Sheldon,
F., Brierly, G. & Kenyon, C., (Eds): Third Australian
Stream Management Conference Proceedings,27-29August
2001,Brisbane: 197-203.
EBERHARD, S.,2001:Cave fauna monitoring and management at
Ida Bay, Tasmania. Records of the Western Australian
Museum, Supplement64: 97-104.
FORD, D.C. &WILLIAMS, P.W., 1989: Karst Geomorphology and
Hydrology. Unwin Hyman, London.
GILLIESON, D., 1996: Caves: Processes, Development and
Management. Basil Blackwell, Oxford.
GIPPEL, C.,1994:Monitoring turbidity in stream water.Australian
Journal ofSoil and Water Conservation7(4): 37-44.
GOEDE, A., 1981: Variation in hardness of cave drips at two
Tasmanian sites. Helictite, 19: 57-67.
HOUSHOLD,1., 1995:Karst impacts and environmental
rehabili-tation of a limestone quarry at Lune River, southern
Tasmania.InHenderson, K., Houshold,1. &Middleton,
G. (Eds): Cave and Karst Management in Australasia11:
Proceedings of the Eleventh Australasian Conference on Cave and Karst Management.Australasian Cave and Karst Management Association and Parks and Wildlife Service,
Tasmania: 138-175.
JENNINGS, J.N. & JAMES, B.N., 1967: Underground water
movements in the Lobster Rivulet Mole Creek divide,
Tasmania.Australian Journal ofScience30(3): 108-109.
JENNINGS, J.N.&SWEETING, M.M.,1959:Water chemistry data.
InKiernan, K., 1984: Land Use in Karst Areas: Forestry
Operations and the Mole Creek Caves. Report to the
Forestry Commission and National Parks & Wildlife
Service, Tasmania:301.
KIERNAN, K.,1984: Land Use in Karst Areas: Forestry Operations
and the Mole Creek Caves. Report to the Forestry
Commission and National Parks & Wildlife Service,
Tasmania.
KIERNAN, K., 1987: Ground-water pollution beneath a farming
district.Institute ofAustralian Geographers 22ndConference,
Geography and Public Policy Program Abstracts,Canberra,
24-28August 1987: 67-68.
KIERNAN, K.,1992:Karst hydrogeology in Tasmania.International
Contributions to Hydrogeology13: 377-392.
KIERNAN, K., EBERHARD, R. &SHANNON, C.H.C.,1994:Further
hydrogeological investigations of the Mill Creek-Kansas
Creek area, northern Tasmania. Tasforests 6: 7-22.
NATIONAL WATER QUALITY MANAGEMENT STRATEGY, 2000:
Australian and New Zealand Drinking Water Guidelines fOr Fresh and Marine Water Quality.Australian and New Zealand Environment and the Agriculture and Resource Management Council of Australia and New Zealand.
NEBBACHE, S., FEENY, V., POUDEVIGNE, 1. & ALARD, D.,2001:
Turbidity and nitrate transfer in karstic aquifers in rural
areas: the Brionne Basin case study. Journal of
Environmental Management62: 389-398.
QUINLAN, J.F., 1988: Protocol for reliable monitoring of
groundwater quality in karst terranes.Karst Hydrogeology
and Karst Environment Protection. Proceedings of the
21st Congress of the International Association of
Hydrogeologists. Geological Publishing House, Beijing:
888-893.
SPATE, A.P. & HOLLAND, E.A., 1990: Croesus Cave, Mole Creek,
Tasmania: A Review of Resources, Visitor Impacts and Management Issues. Report to Forestry Commission, Tasmania.
HydrologlCal context
Ration Tree Creek drains the eastern slopes of Gads Hill above Liena.
~
~
~~
~~ ~
~
~
~
~
~ ~ ~
In As above.
A mixture of native forest and cleared land, previously used for grazing but now to extensive eucalypt
point of Kansas Creek, cave stream flows to Bore is adjacent to Ration Tree Creek. The source area for the aquifer it taps is speculative at this time.
Details of sample sites
Rubbish Heap Cave is the which rises on Western Bluff. Lynds Cave on the Mersey River. Permian and Triassic marine and
terrestrial sediments Catchment lithology
Tertiary basalt
Ordovician limestone Tertiary basalt
Ordovician limestone
The bore penetrates70minto limestone, which is overlain by 30 m of alluvium.
Silurian sandstones and quartzites Altitude
320 m asl
320 m asl
420m asl bore
Type
surface stream
streamsink Liena
Ration Tree Creek
Rubbish Heap Cave Site
Dolerite
Lynds Cave spring 300m asl As above plus Ordovician limestone
Rubbish Heap Cave is the major source for the cave stream at this
As above.
Lime Pit
Execution Pot
spring
streamsink
330 m asl
600m asl
As above
Silurian sandstones and quartzites Permian and Triassic marine and terrestrial sediments
Lime Pit is fed by the Execution Creek streamsink, probably supplemented by run-off from oasture areas traversed by the Mersey Forest Rd
Solomons
Execution Pot drains the northwestern slopes of Western Bluff. The cave stream flows to the Lime Pit spring.
A mixture of native forest and cleared land. The native forest has been several tens of
hectares were in 2001. The cleared areas are currently used mainly for beef cattle production.
has been selectivelv IOQ"Q"ed in
Dolerite
Grunter Creek streamsink 370m asl Ordovician sandstone Grunter Creek drains the southeastern slopes of Solomons Dome. It flows to Kubla Khan Cave via the Grunter Catruns streamsinks.
Native forest. Some past
Howes Cave streamsink 370m asl Ordovician limestone
Ordovician sandstone
Howes Cave drains the southeastern Dome. The cave stream flows to Kubla
of Solomons Cave.
Immediate of Howes Cave is cleared land subject to mixed native forest with some past logging.
Kubla Khan Efflux
spring 340m asl As above Outflow of Kubla Khan Cave, which receives flow from Grunter Creek, Howes Cave and other sources to the west of Grunter Hill.
Native forest in Crown reserves and State forest. some past logging. Also cleared land used for agnculture.
to
Marakoopa Cave
spring 420m asl Ordovician limestone
Silurian sandstones and quartzites
Permian and Triassic marine and terrestrial sediments
Marakoopa Cave is a complex system that drains the northern slopes of Western Bluff. Two major tributaries within the cave are known as Long Creek and Short Creek. The combined flow of these was sampled downstream of the cave outflows.
Primarily native forest in Crown reserves. Marakoopa Cave is develooed as a show cave.
APPENDIX 1cont.
Site Type Altitude Catchment lithology Hydrological context Catchment integrity
Ordovician limestone
Silurian sandstones and quartzites
Native forest in Crown reserves and State forest. Cleared land at lower altitude, currently used for grazing, cropping and dairy production.
Circular Ponds
Sassafras Creek (upper sink)
streamsink
streamsink
300 m asl
420 m asl
As above plus Ordovician sandstone Circular Ponds is a seasonally active sinking point for surface streams within the Mayberry basin. These are boosted by discharge from Marakoopa Cave, Kubla Khan Efflux, Gillam Creek and other sources. Circular Ponds drains to Bachelors Spring, a tributary to Sassafras Creek.
This is low stage sinking point of western branch of Sassafras Creek, in Baldocks Cave valley. Flows to Baldocks Cave and springs lower on Sassafras Creek.
Native forest in Crown reserves to past
Permian and Triassic marine and terrestrial sediments
Dolerite
Sassafras Creek surface stream 230 m asl As above (Ugbrook)
Bachelors spring 270 m asl As above plus Ordovician
Spring sandstone
~
~' i
~ ~ ~
~
~.
~.
~ ~ ~
~ ~
~
~
~
~
~ to
for latter used Native forest in Crown reserves and
Cleared land at lower
Primarily cleared land used for mainly dairy production. Native forest in Crown reserves and
past logging. Cleared land at lower agricultural purposes.
Native forest and cleared land, dairy production.
Native forest in Crown reserves and State forest. Cleared land at lower altitude, currently used for
and dairy production. The catchment local2:overnment waste disposal site
over.
Native forest in Crown reserves and freehold. Lower in the catchment is cleared land, used mainly for dairy production. Sinking point of eastern branch of Sassafras Creek, which
receives flow from karst springs at Cyclops Cave and Glowworm Cave. Drains to Sassafras Cave. Sampled at low stage sinking point in gravels several hundred metres upstream of the cave known as Sassafras Inflow.
Sassafras Creek is fed by numerous springs between Sassafras Cave and Ugbrook. Bachelors Spring, which drains the Mayberry basin, contributes more than half the volume of the creek at Ugbrook.
This spring is the major outlet for underground originating in the Mayberry basin to the west. The Circular Ponds streamsink is one of several point input sources at Mayberry.
Main source of flow is streamsinks in the uvala. Sampled at low stage spring in stream downstream of cave entrance.
More southerly of two streamsinks within the uvala. Flows to Mersey Hill Cave.
Wet Cave receives run-off from the Great Western Tiers. The main tributaries are streamsinks at Westmorland Cave and Kellys Pot. Below Wet Cave the water enters Honeycomb Cave, later emerging at Scotts Rising, the principal source of Mole Creek.
Permian and Triassic marine and terrestrial sediments
Dolerite
Ordovician limestone As above
Ordovician limestone overlain by Tertiary basalt.
As above. 290 m asl
270 m asl
310 m asl 210 m asl streamsink
streamsink
spring spring Mersey Hill
uvala Sassafras Inflow
Mersey Hill Cave
Wet Cave
~ ~
~ ~ ~.
p....d
0\
Site Type Altitude
Scotts Rising spring 270 m asl
Mole Creek surface stream 220 m asl (Den Road)
Essentially undisturbed native vegetation in Crown reserves. Lobster Rivulet
(upper sink)
streamsink 390 m asl
Catchment lithology
As above
As above plus Ordovician sandstone
Silurian sandstones and quartzites
Tertiary basalt
Permian and Triassic marine and terrestrial sediments
Dolerite
Hydrological context
See Wet Cave above.
See Wet Cave above. The smaller tributary of Limestone Creek joins Mole Creek at Mole Creek township. The Den Road bridge where the sample was obtained is downstream of the confluence.
Lobster Rivulet rises on the Great Western Tiers near NeIls Bluff. Depending on discharge conditions, all or part of the Lobster sinks underground into its bed at this point.
As above.
As above
Catchment integrity
urban settlement at Mole Creek township.
~
~
~
~
~~ ~
~
~
~
~
~ ~ ~
Lobster Rivulet surface stream 290 m asl As above plus Ordovician
(Swimming limestone
Pool)
Lobster Rivulet surface stream 270 m asl As above (Caveside)
Lobster Rivulet surface stream 260 m asl As above plus Silurian sandstones (Chudleigh) and quartzites and Tertiary basalt
Lobster Rivulet (Lobster Falls)
Caveside
Mersey River (Olivers Road)
Mersey River (Kellys Bridge)
surface stream
bore
surface stream
surface stream
230 m asl
300 m asl
300 m asl
100 m asl
As above
Ordovician limestone Permian and Triassic marine and terrestrial sediments
Dolerite
Dominantly clastic sedimentary rocks (Parmeener Supergroup) and mudstone, siltstone and minor carbonate successions (Rocky Cape Group) and dolerite.
As above plus Ordovician limestone.
A mixture of surface run-off and karstic springs feed the Lobster Rivulet above the swimming pool. The sources of the various springs are speculative at this time, but may include water from Lobster Rivulet (upper sink).
Asabove. The Lobster's discharge at Caveside is probably supplemented by additional springs, which rise in extensive alluvial deposits that mantle the limestone in this area.
As above. Numerous springs supplement the Lobster's discharge between Caveside and Chudleigh. Water diverted from Westmorland Cave and the Mole Creek system via the 'Nine Foot' channel joins the Lobster above Chudleigh.
As above. Lobster Falls is downstream of Chudleigh not far beyond where the Lobster crosses from the limestone onto surrounding non-karstic rocks.
The bore taps the karst aquifer several hundred metres to the west of Lobster Rivulet near the Caveside swimming pool.
The Mersey River drains an extensive area to the south-west of Mole Creek. Its headwaters are located in the Cradle Mountain-Lake St Clair and Walls of Jerusalem National Parks. The sample site is at the point where Mersey first enters the karst catchment.
As above. The site is located just below the confluence of the Mersey River and Lobster Rivulet. No other tributary within the karst catchment joins the Mersey below this point.
vegetatIOn in Crown reserves catchment), and freehold land comprising native forest and cleared land used for
dairy production.
As above.
As above.
As above, including plantation forestry and urban settlement at Chudleigh.
U p r r P T ' l T 1 r \ nin Crown reserves
comprising native forest and cleared land used for
dairy production.
APPENDIX 2
Results for physical and chemical water quality indicators
Date Temp. pH TDS Turbidity Alkalinity Alkalinity Bromide Chloride Fluoride Nitrate Nitrite Phosohate Sulohate Ammonia (OC) (mg/L) (NTU) C03 HC03 (mg/L) (mg/L) (mg/L)
(mg/L (mg/L CaC03) CaC03)
Ration Tree Creek 6-]un-Ol 7.4 6.56 93 1.0 <1 32 <0.01 5.5 <0.02 0.51 <0.10 <0.10 0.77 0.17 Liena bore 6-]un-Ol 10.0 7.35 383 0.4 <1 176 <0.01 4.5 <0.02 0.2 <0.10 <0.10 1.5 0.18 Lime Pit 6-]un-Ol 9.5 8.18 380 0.2 <1 186 <0.01 5.5 0.04 0.63 <0.10 <0.10 3.6 0.09 Execution Creek 6-]un-Ol 7.9 5.77 56 0.3 <1 2 <0.01 7.1 <0.02 <0.03 <0.10 <0.10 5.9 0.08 Bachelors Spring 6-]un-Ol 10.6 7.17 356 0.3 <1 171 <0.01 4.8 0.04 0.55 <0.10 <0.10 3.5 0.06 Sassafras Creek (Ugbrook) 6-]un-Ol 10.5 7.40 339 14.1 <1 164 <0.01 4.8 0.03 0.53 <0.10 <0.10 5.4 0.06 Sassafras Inflow 6-]un-Ol 9.2 7.96 131 1.1 <1 50 <0.01 4.2 <0.02 0.09 <0.10 <0.10 5.2 0.06 Sassafras Creek (upper sink) 13-]un-Ol 8.0 6.14 60 0.9 <1 21 <0.01 3.1 <0.02 0.11 <0.10 <0.10 1.2 0.06 Kubla Khan Efflux 13-]un-Ol 8.8 6.44 112 6.2 <1 43 <0.01 4.3 <0.02 0.07 <0.10 <0.10 1.3 0.07 Marakoopa Creek 13-]un-Ol 7.9 6.65 113 1.3 <1 42 <0.01 4.4 <0.02 0.42 <0.10 <0.10 2.5 0.05 Grunter Creek 13-]un-Ol 8.1 5.18 35 1.3 <1 <1 <0.01 3.3 <0.02 <0.03 <0.10 <0.10 0.54 0.07 Howes Cave 13-]un-Ol 8.7 5.90 39 1.4 <1 4 <0.01 4.4 <0.02 <0.03 <0.10 <0.10 1.6 0.08 Circular Ponds 13-]un-Ol 9.1 6.43 139 5.6 <1 56 <0.01 4.4 <0.02 0.25 <0.10 <0.10 3 0.05 Bachelors Spring 13-]un-Ol 10.2 6.71 263 23.4 <1 122 <0.01 4.7 0.04 0.53 <0.10 <0.10 2.8 <0.05
~
Sassafras Creek (Ugbrook) 13-]un-Ol 10.1 7.01 260 1.1 <1 122 <0.01 4.6 0.03 0.52 <0.10 <0.10 2.2 <0.05 ~ Mole Creek (Den Road) 2-]ul-Ol 9.0 7.49 202 3.4 <1 89 <0.01 4.5 <0.02 0.69 <0.10 <0.10 2.1 <0.05 ~~ Scotts Rising 2-]ul-Ol 8.8 7.34 154 1.0 <1 61 <0.01 3.8 <0.02 0.53 <0.10 <0.10 1.7 <0.05 ~~ Wet Cave 2-]ul-O 1 7.6 7.42 73 1.1 <1 25 <0.01 3.5 <0.02 0.23 <0.10 <0.10 0.34 0.05 ~~ Lobster Rivulet (upper sink) 2-]ul-O 1 6.3 6.65 29 0.3 <1 9 <0.01 2.2 <0.02 <0.03 <0.10 <0.10 1.1 <0.05 ~.~ Lobster Rivulet (Swimming Pool) 2-]ul-Ol 8.4 7.23 60 1.5 <1 22 <0.01 2.8 <0.02 0.13 <0.10 <0.10 1.1 <0.05 ~ Lobster Rivulet (Caveside) 2-]ul-Ol 8.1 7.56 62 2.2 <1 22 <0.01 2.8 <0.02 0.17 <0.10 <0.10 2.8 <0.05 ~
~
Lobster Rivulet (Chudleigh) 2-]ul-Ol 9.0 7.57 102 4.9 <1 35 <0.01 4.8 <0.02 0.51 <0.10 <0.10 3.1 0.06 ~ Lobster Rivuler (Lobster Falls) 2-]ul-01 8.6 7.60 117 4.7 <1 40 <0.01 5.7 <0.02 0.51 <0.10 <0.10 1.9 <0.05 ~
~ Caveside bore 2-]ul-O 1 12.8 7.24 345 0.3 <1 159 <0.01 6.7 0.05 2.3 <0.10 <0.10 3 <0.05 ~
Rubbish Heap Cave 12-]ul-Ol 5.1 6.98 43 0.2 <1 8 <0.01 4.8 0.05 0.12 <0.10 <0.10 2.5 0.05
~
Lynds Cave 12-]ul-0 1 8.2 7.89 191 0.4 <1 83 <0.01 5.2 0.09 0.33 <0.10 <0.10 3.4 0.07 ~Q
Mersey Hill uvala 12-]ul-O 1 6.6 7.09 132 1.4 <1 32 <0.01 7.2 0.04 2.6 <0.10 <0.10 2.2 <0.05 ~~ Mersey Hill Cave 12-]ul-O 1 10.6 7.20 268 3.1 <1 119 <0.01 6.7 0.02 1 <0.10 <0.10 0.65 0.09 ~
Mersey River (0livers Road) 12-]ul-O 1 4.9 6.76 23 0.6 <1 4 <0.01 2.5 <0.02 0.04 <0.10 <0.10 2.1 0.07 ~ v, ~ ~ ~
~.
Date Aluminium Arsenic Cadmium Cobalt Chromium Copper Iron Manganese Nickel Lead Zinc Calcium Potassium Sodium ~
(lJ,g/L) (lJ,g/L) (lJ,g/L) (lJ,g/L) (lJ,g/L) (lJ,g/L) (lJ,g/L)
~
~ ~ Ration Tree Creek 6-]un-Ol 139 <5 <1 <1 <1 <1 125 <5 <1 <5 <1 4.93 0.49 3.30 4.74 ~
~
Liena bore 6-]un-Ol <20 <5 <1 <1 <1 <1 <20 <5 <1 <5 <1 63.7 0.44 4.59 3.53 ~ Lime Pit 6-]un-Ol <20 <5 <1 <1 <1 <1 <20 <5 <1 <5 <1 69.8 0.84 3.32 3.68 ~~
Execution Creek 6-]un-Ol 339 <5 <1 <1 <1 <1 131 <5 <1 <5 <1 1.76 0.32 1.04 5.30 ~ Bachelors Spring 6-]un-Ol 37 <5 <1 <1 <1 <1 28 <5 <1 <5 <1 66.6 0.61 3.53 3.51
~
Sassafras Creek (Ugbrook) 6-]un-Ol <20 <5 <1 <1 <1 <1 <20 <5 <1 <5 <1 61.9 0.59 3.23 3.46 ~~~ Sassafras Inflow 6-]un-Ol <20 <5 <1 <1 <1 <1 22 <5 <1 <5 <1 16.2 0.77 1.65 4.61 <:::::>
~ Sassafras Creek (upper sink) 13-]un-Ol 32 <5 <1 <1 <1 <1 22 <5 <1 <5 <1 5.42 0.21 0.88 2.29