Rochester Institute of Technology
RIT Scholar Works
Theses
4-26-2019
Multiscale Fluid-Structure Interaction Models
Development and Applications to the 3D Elements
of a Human Cardiovascular System
Yogesh Karnam [email protected]
Follow this and additional works at:https://scholarworks.rit.edu/theses
This Thesis is brought to you for free and open access by RIT Scholar Works. It has been accepted for inclusion in Theses by an authorized administrator of RIT Scholar Works. For more information, please [email protected].
Recommended Citation
Multiscale Fluid-Structure Interaction Models
Development and Applications to the 3D Elements of a
Human Cardiovascular System
Submitted by
Yogesh Karnam
A Thesis Presented in Partial Fulfillment of the Requirements for
the Degree of Master of Science in Mechanical Engineering
Approved by:
Dr. Alexander Liberson ---
Department of Mechanical Engineering (Thesis Advisor)
Dr. Hany Ghoneim
---Department of Mechanical Engineering (Committee Member)
Dr. Ali Ogut
---Department of Mechanical Engineering (Committee Member)
Dr. Michael Schrlau
---Department of Mechanical Engineering (Department Representative)
Rochester Institute of Technology
Kate Gleason College of Engineering
Department of Mechanical Engineering
Rochester, NY
Abstract
Cardiovascular diseases (CVD) are the number one cause of death of humans in the United
States and worldwide. Accurate, non-invasive, and cheaper diagnosis methods have always been
on demand as cardiovascular monitoring increase in prevalence. The primary causes of the various
forms of these CVDs are atherosclerosis and aneurysms in the blood vessels. Current noninvasive
methods (i.e., statistical/medical) permit fairly accurate detection of the disease once clinical
symptoms are suggestive of the existence of hemodynamic disorders. Therefore, the recent surge
of hemodynamics models facilitated the prediction of cardiovascular conditions.
The hemodynamic modeling of a human circulatory system involves varying levels of
complexity which must be accounted for and resolved. Pulse-wave propagation effects and high
aspect-ratio segments of the vasculature are represented using a quasi-one-dimensional (1D),
non-steady, averaged over the cross-section models. However, these reduced 1D models do not account
for the blood flow patterns (recirculation zones), vessel wall shear stresses and quantification of
repetitive mechanical stresses which helps to predict a vessel life. Even a whole three-dimensional
(3D) modeling of the vasculature is computationally intensive and do not fit the timeline of
practical use. Thus the intertwining of a quasi 1D global vasculature model with a
specific/risk-prone 3D local vessel ones is imperative.
This research forms part of a multiphysics project that aims to improve the detailed
understanding of the hemodynamics by investigating a computational model of fluid-structure
interaction (FSI) of in vivo blood flow. First idealized computational a 3D FSI artery model is
configured and executed in ANSYS Workbench, forming an implicit coupling of the blood flow
and vessel walls. Then the thesis focuses on an approach developed to employ commercial tools
rather than in-house mathematical models in achieving multiscale simulations. A robust algorithm
is constructed to combine stabilization techniques to simultaneously overcome the added-mass
effect in 3D FSI simulation and mathematical difficulties such as the assignment of boundary
conditions at the interface between the 3D-1D coupling. Applications can be of numerical
examples evaluating the change of hemodynamic parameters and diagnosis of an abdominal
Acknowledgments
First of all, I would like to offer thankful gratitude to my advisor, Dr. Alexander Liberson,
who allowed me to work on his team and introduced me to the fascinating field of cardiovascular
modeling. For supporting me by offering a research/teaching assistantship, for having much
patience with my work and making sure I had all the resources needed. I would never have
followed the path I am on without his trust, thanks again for letting me go on a co-op.
A special thanks go to my co-advisor Yashar S Vehedein, who is most responsible for
sharing his learnings, literature and helping me understand the cardiovascular dynamics as well as
the challenging research that lies behind it. Yashar has been a friend and mentor. He had
confidence in me when I doubted myself, and brought out the good ideas in me.
Besides my advisors, I would like to thank my committee members: Dr. Hany Ghoneim,
Dr. Ali Ogut, and Dr. Michael Scharlau. I truly appreciate their comments, suggestions, time,
encouragement, and for evaluating this thesis. I extend my deepest thanks to department staff
especially William Finch, Diane Selleck, and Jill Ehmann for being very accommodative with all
my questions and requests.
Last, but not least, I thank my family: my parents, for unconditional support and
encouragement to pursue my interests; and my dear friend, for listening to my complaints and
Table of Contents
Abstract ... 2
Acknowledgments ... 3
LIST OF FIGURES ... 6
LIST OF TABLES ... 8
1 PROBLEM INTRODUCTION... 9
1.1 Cardiovascular System ... 11
1.2 Blood Flow, Vessels & their Dynamic Properties ... 12
1.3 Arterial diseases ... 17
1.4 Hemodynamics ... 19
1.5 Engineering Approach: Computational Modeling ... 21
2 RESEARCH QUESTION ... 2
3 LITERATURE REVIEW ... 26
4 OBJECTIVES ... 26
5 METHODOLOGY ... 32
5.1 Fluid Domain: Newtonian Blood ... 33
5.2 Structure Domain: The Artery Wall ... 36
5.3 Fluid-Structure Interaction Theory ... 38
5.4 Arbitrary Lagrangian-Eulerian (ALE) Method ... 39
5.5 FSI Modeling ... 40
5.6 In-house 1D Code ... 44
5.7 Geometrical Multiscale Approach: 3D-1D Coupling ... 45
5.8 Artificial Boundaries ... 46
5.9 In-house 3D-1D Coupling Formulation ... 47
5.10 Coupling Implementation using ANSYS & MATLAB ... 48
6 IMPLEMENTATION & RESULTS ... 51
6.1 3D FSI Model ... 51
6.1.1 Blood Domain: Geometry ... 51
6.1.2 Blood Domain: Material behavior and boundary conditions ... 53
6.1.3 Blood Domain: Mesh Generation ... 55
6.1.4 Blood Domain: Solver settings and solution behavior ... 56
6.1.5 Structural Domain: Geometry & Mesh ... 57
6.1.7 Structural Domain: Boundary and initial conditions ... 58
6.1.8 Structural Domain: Solution method ... 58
6.1.9 FSI set-up & analysis ... 58
6.1.10 Results ... 61
6.2 3D-1D Coupling ... 68
6.3 1D-3D-1D Coupling ... 75
7 CONCLUSION & FUTURE WORK ... 78
8 SOCIETAL CONTEXT ... 80
LIST OF FIGURES
Figure 1.1 Cardiovascular System ... 10
Figure 1.2 Blood & Vessel Components ... 11
Figure 1.3 Blood flow profile ... 12
Figure 1.4 Laminar vs. Turbulent flow circulation ... 13
Figure 1.5 Artery Composition ... 14
Figure 1.6 Plaque formation in an artery ... 15
Figure 1.7 Dilation of an artery... 16
Figure 1.8 Forces exerted by blood flow on an arterial wall ... 18
Figure 1.9 Plaque build-up leading to Atherosclerosis on the left; Dilation leading to Aneurysm on right ... 19
Figure 1.10 Compuation model of an arterial bifurcation ... 20
Figure 5.2.1 Non-linear elastic response due to cyclic pressure loads ... 34
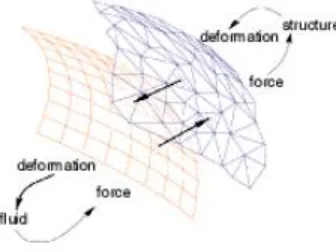
Figure 5.3.1 Transfer of forces & displacments between an arbitrary mapped fluid & structural mesh face ... 36
Figure 5.4.1 FSI governing equations ... 37
Figure 5.5.1 Biomedical computational models demand a fully coupled FSI ... 38
Figure 5.5.2 Advantages of two-way FSI ... 39
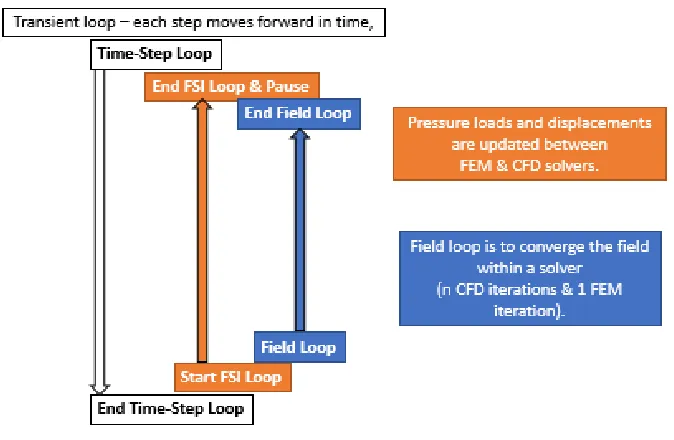
Figure 5.5.3 FSI iterative loops ... 39
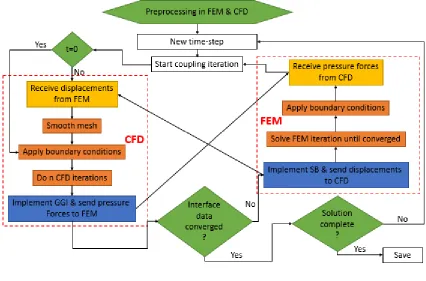
Figure 5.5.4 FSI process ... 40
Figure 5.6.1 Sectional view of coupling a 3D model exit (downstream) with a reduced 1D model ………...……42
Figure 5.8.1 Artificial Boundaries ... 44
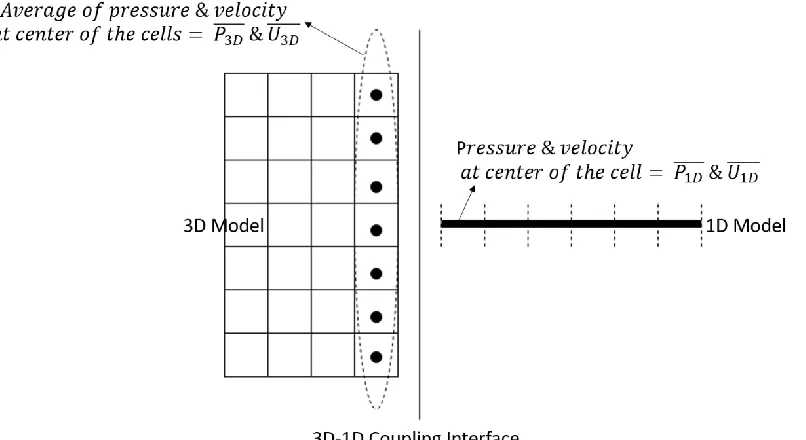
Figure 5.9.1 Coupling a 3D & a 1D model requires an interface formulation ... 45
Figure 5.10.1 Variables needed to facilitate coupling ... 46
Figure 5.10.2 Coupling implementation scheme ... 47
Figure 5.10.3 A multiscale coupling process employing ANSYS & MATLAB ….………..48
Figure 6.1.1 Carotid artery bifurcation Perktold et al [49,51] ... 50
Figure 6.1.2 Blood domain boundaries ... 51
Figure 6.1.4 Structural boundaries ... 55
Figure 6.1.5 Acceleration & deceleration phases in a cardiac cycle ... 60
Figure 6.1.6 Axial velocity on axial slices ... 60
Figure 6.1.7 Axial velocity contours in normal plane view for CFD on the left and FSI on the right silghtly tilted towards left ... 61
Figure 6.1.8 Perktold et al [49,51] ... 61
Figure 6.1.9 Velocity magnitude contours and recirculation zones in carotid sinus 0.08s-0.4s(top-bottom) verified with experiments conducted by Ku. et al [30] ... 62
Figure 6.1.10 Peak systole wall shear stress (WSS); CFD on the top in Pa & FSI in the bottom in N/mm^2 ... 63
Figure 6.1.11 WSS on Carotid sinus curvature at maximum diameter ... 64
Figure 6.1.12 WSS on bifurcation curvature ... 64
Figure 6.1.13 Velocity is internal carotid artery compared to Josanova et al. [105] ... 65
Figure 6.2.1 Aneurysm geometry (Units in mm) extracted from Mix et al. [112] ... 66
Figure 6.2.2 3D & 1D boundaries (3D Structural on the left & 3D Fluid on the right) ... 66
Figure 6.2.3 Inlet veloity at 3D inlet ... 67
Figure 6.2.4 3D-1D coupling representation ... 67
Figure 6.2.5 Velocity plot at 3D-1D interface (3D outlet connected to 1D inlet) ... 70
Figure 6.2.6 Pressure plot at 3D-1D interface (3D outlet connected to 1D inlet) ... 70
Figure 6.2.7 Wall shear stress (WSS) ... 71
Figure 6.2.8 Velocity magnitude contours and recirculation zones in aneurysm ... 72
Figure 6.2.9 Validation on 3D-1D with total 3D model ... 73
Figure 6.3.1 Two 1D segments connected to a 3D cylinder model ... 73
Figure 6.3.2 Velocity & Pressure plots at 1D-3D interface on top and 3D-1D interface in bottom ... 74
LIST OF TABLES
Table 1 Geometry Specifications ... 50
Table 2 ANSYS Fluent UDF Macros ... 53
Table 3 ANSYS Fluent Solver Settings ... 54
Table 4 Computation time for a FSI case ... 58
NOMENCLATURE
CVD – Cardiovascular Disease
1D – One-Dimensional
3D – Three-Dimesional
CFD – Computational Fluid Dynamics
FSI – Fluid-Structure Interaction
𝑢 – Velocity of the blood
𝑅 – Radius of the artery
𝑃 – Pressure in the artery
𝜇 – Kinematic viscosity of the blood
𝐿 – Length of the artery
𝑄 – Flow rate of the blood
𝜎 – Normal stress on the artery
𝜏 – Tangential stress of the artery
𝑅𝑒 – Reynolds number of the blood
𝛼 – Womersly number of the blood
𝑇 – Time period of the pulse
𝜌𝑓 – Density of the blood
𝐸 – Young’s modulus of the artery
𝜀 – Poisson’s ratio of the artery
𝜂 – Displacment of the artery
𝜌𝑤 – Density of the artery
𝐴 – Cross-sectional area of the blood/artery
WSS – Wall Shear Stress
RBC – Red Blood Cells
LDV – Laser Dopple Velocimetry
PIV – Particle Image Velocimetry
WSSG – Wall Shear Stress Gradient
DOF – Degrees Of Freedom
FEM – Finite Element Method
FVM – Finite Volume Method
RMS – Root Mean Square
PWV – Pulse Wave Velocity
CCA – Common Carotid Artery
ICA – Internal Carotid Artery
ECA – External Carotid Artery
BC – Boundary Condition
1 PROBLEM INTRODUCTION
Cardiovascular diseases (CVDs) are the number 1 cause of death globally: more people die
annually from CVDs than from any other cause. An estimated 17.9 million people died from CVDs
in 2016, representing 31% of all global deaths[1]. These diseases are listed as the underlying cause
of death, accounted for 840,678 deaths in the US in 2016, approximately 1 of every three deaths.
Between 2013 and 2016, 121.5 million American adults had some form of CVDs. Between 2014
and 2015, direct and indirect costs of total cardiovascular diseases and stroke were $351.2 billion
($213.8 billion in direct costs and $137.4 billion in lost productivity/mortality)[2]. It is rather
tragic, if not cynical, the fact that the prime cause of death in our advanced civilization are
phenomena like blockage, thinning, hardening and dilations of the blood vessels causing
cardiovascular accidents. Having a comprehensive understanding of the cardiovascular physiology
will enable the early diagnosis and treatment of these diseases, based on a patient-specific process,
replacing the traditional method of diagnosing an already diseased condition and developing a
treatment plan based on population means.
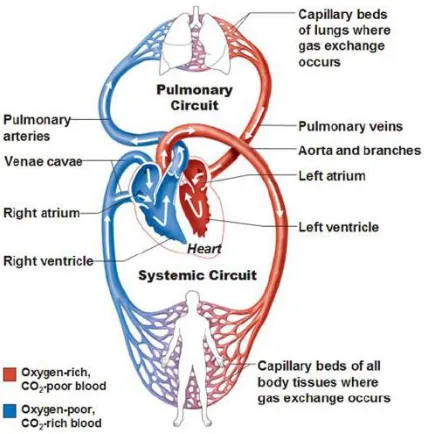
1.1 Cardiovascular System
The cardiovascular system shown in Fig 1.1 is a major system in the human body, consisting of
the heart and blood vessels, whose purpose is to move blood through the body. The heart muscle
acts as a pump in the system, expanding and contracting to receive and send blood, respectively.
The blood vessels, including arteries, arterioles, capillaries, venules, and veins, are the piping
components that allow for distribution of the blood through the body [3]. Two major circulation
paths make up the cardiovascular system – pulmonary circulation, which carries blood between
the heart and lungs, and systemic circulation, which carries blood from the heart through the body
and back again. The purpose of the pulmonary circulation system is to take deoxygenated blood
from the heart to the lungs, where carbon dioxide is released, and oxygen is added, and return the
blood to the heart. The systemic circulatory system begins in the left atrium, which receives
oxygenated blood from the pulmonary veins. The blood then moves from the left atrium to the left
ventricle where it is pumped into the aorta, the largest artery in the body. From the aorta, the blood
Figure 1.1 Cardiovascular System
The heart is continually expanding or contracting. This motion creates pulsatile blood flow, which
moves the blood as pressure waves through the body. One complete cardiac cycle occurs during
every heartbeat. Two important terms describe the motion of the heart chambers during the cycle
– systole and diastole. Systole is the contraction of a chamber, while diastole is the relaxation of a
chamber [3].
1.2 Blood Flow, Vessels & their Dynamic Properties
Blood is a suspension of red blood cells, white blood cells, and platelets in plasma illustrated in
Fig 1.2. The viscoelastic fluid behavior of blood is associated with the elastic properties of the red
cell membrane and the viscosity of internal and external fluids. Red blood cells constitute more
than 99 percent of the particulate matter in blood and 40 to 45 percent of the blood by volume
(hematocrit). The material properties of the red blood cell membrane and the fluidity of its internal
contents make it easy for the cell to deform into a variety of shapes. However, the deformation of
red blood cells in vitro or in vivo in circulation occurs at an essentially constant area, which can
be attributed to the relatively high dilatational modulus of the cell membrane. After red blood cells,
total volume of blood cells in normal human blood and exert little influence on the bulk rheological
properties of blood. White blood cells are much less deformable than red blood cells.
Figure 1.2 Blood & Vessel Components
White blood cells have a viscoelastic interior that makes them several orders of magnitude stiffer
than red blood cells under rapid deformations. The stress required to cause the deformation of
white blood cells is much greater than for red blood cells. This indicates that white blood cells are
more viscous compared to red blood cells. Platelets occupy even less of blood volume than white
blood cells. They play an important role in blood clotting, but they are rheologically unimportant
to consider for the normal blood simulation. Adhesion of both red blood cells and white blood
cells to blood-vessel walls increases the apparent viscosity. Since one must consider different
viscosities for both red and white blood cells, blood is considered a non-Newtonian fluid.
The nature and behavior of blood are not only dependent on the fluid properties, but also other
mechanical factors, including the forces, exerted on the fluid, the fluid motion, and the boundary
conditions of the arterial geometry. Moreover, blood viscosity also dictates its behavior. According
to these features, the blood flow may be characterized as steady or pulsatile, Newtonian or
non-Newtonian, and laminar or turbulent. Fully developed flows are described by velocity and pressure
fields, with all kinematic quantities independent from the axial coordinate, but this ideal behavior
is never achieved in the vascular system. Two important particular cases are the steady flow,
governed by the Poiseuille solution, and the time-periodic flow, governed by the Womersley
sites of the arterial tree, due to the repeated, rhythmic mechanical pumping of the heart [4]. It
means that the blood flow is an unsteady flow and because of that, the time dependence should not
be neglected.
Figure 1.3 Blood flow profile
The Womersley solution for pulsatile flow Fig 1.3 in straight or tapered cylinders is a reasonable
approximation to model blood flow in the arterial network [5]. In this case, the flow rate at the
inlet regularly varies with time, and at sufficient distance from the inlet, the velocity only has an
axial component, the function of radius. Generally, the Womersley velocity profile is not parabolic
and, even though the total volume flow always remains positive, there is a boundary layer of
reversed flow close to the wall. This inversion is vital in the characterization of pulsatile flow and
is featured in the blood flow when the viscous traction forces are opposed to the dominant flow
direction [6]. Even so, the blood flow is often considered in a steady state, depending only on the
spatial position, since an unsteady flow is usually much more complicated than a steady one. In
this case, the blood flow is approximated by the Poiseuille solution for steady flow and the velocity
profile is parabolic, with a flow direction parallel to the vessel wall. It is a simplification and does
not correspond to the general physiological situation, however, in an extended circular cylinder
after a reasonable distance the fluid tends to be parabolic, and in small arteries, sufficiently distant
from the heart, the flow is predominantly steady. The parabolic velocity profile of steady flow
shown in Fig 1.3 is given by
𝑢(𝑟) = 𝑢0[1 − (𝑟
𝑅) 2
] 0 ≤ 𝑟 ≤ 𝑅 (1)
establishes the relation between steady flow and pressure gradient, in which 𝐿 is the vessel length,
𝑄 is the flow rate, and 𝜇 is the fluid viscosity.
∆𝑃 = 8𝜇𝑄𝐿
𝜋𝑅4 (2)
𝑄 = 𝜋𝑅2 𝑢0
2 (3)
Generally, blood velocity field has a laminar regime flowing parallel to the vessel centerline but
under conditions of high flow during the systole period of the cardiac cycle, particularly in the
ascending aorta and in stenotic or aneurysmal arteries, the flow can be disrupted and acquire
turbulent features, that may include recirculation sites, also known as vortices. Curves and
branches across the vascular network also generate secondary flows. Laminar flow has a parabolic
velocity profile, and turbulence occurs when fluctuating velocity components are found in both
the axial and nonaxial directions [7]. Pulsatile flows become turbulent for Reynolds numbers larger
than 2000, especially during decelerating systole or near the end of systole flow perfuses/splits
into smaller vessels as shown in Fig 1.4 [8]. Over one cardiac cycle, the maximum value of this
parameter can range from 6000 to 10,000, in transport from the heart to the periphery [9].
Figure 1.4 Laminar vs. Turbulent flow circulation
Two significant differences exist between blood vessel walls in the vasculature and more
traditional engineering pipe materials. Unlike pipes, which are generally rigid, blood vessel walls
are both elastic and porous. The consequence of this is that, as blood travels through the blood
vessels, the walls expand and contract. Also, nutrients can be transferred to the surrounding tissues
through the pores in the blood vessel walls. These pores are selectively permeable, allowing
nutrient transfer while preventing red blood cells from leaving the vessels [10]. As most common
However, their mechanical behavior is not purely elastic but slightly viscoelastic. Arteries are
muscular vessels that carry blood away from the heart. They are contrasted with veins, which carry
blood toward the heart. Arteries can be subdivided into several groups with ascending diameter:
arterioles (10 − 100 𝜇𝑚), muscular arteries (diameter > 0.1 𝑚𝑚), and elastic arteries (diameter >
5 𝑚𝑚), such as the aorta, the carotid arteries, coronary arteries, etc.
Figure 1.5 Artery Composition
The main constituents shown in Fig 1.5 of arteries are collagen, elastin, and smooth muscle. The
intima mainly consists of elastin; the media consists of collagen smooth muscle and some elastin,
and the adventitia mainly consists of collagen. To understand the mechanical behavior of arteries,
it is necessary to know the mechanical properties [11] of these constituents. Collagen is the main
protein of connective tissue in animals and the most abundant protein in mammals. It is tough and
inextensible, having great tensile strength. It is responsible for skin strength and elasticity, and its
degradation leads to wrinkles that accompany aging. It strengthens blood vessels and plays a role
in tissue development. Due to its waviness, tissue stiffness is low at small strains and the stiffness
increases once the fibers are fully stretched. A typical Young’s modulus of collagen is
approximately 500 MPa. Elastin is a protein in connective tissue, which is elastic and allows many
tissues in the body to resume their shape after stretching or contracting. It also helps the skin to
return to its original position when it is poked or pinched. It has an almost linear stress-strain
relationship, with Young’s modulus of approximately 500 KPa. The smooth muscle which
constitutes 40% of the media is used to move matter within the body via contraction and has
Young’s modulus of 100 kPa in the deactivated state whereas in the activated state it increases to
Since the focus of current research is not related to the mechanical properties of the arteries, only
a brief discussion is presented. As mentioned above, the arterial wall has a layered structure
making the wall anisotropic. The elastin in the media bears most of the pressure load at small
strains, and the collagen fiber network in the adventitia limits the radial deformability at higher
blood pressures and causes the steep rise in wall stiffness at higher strains, making the material
nonlinear [12].
1.3 Arterial diseases
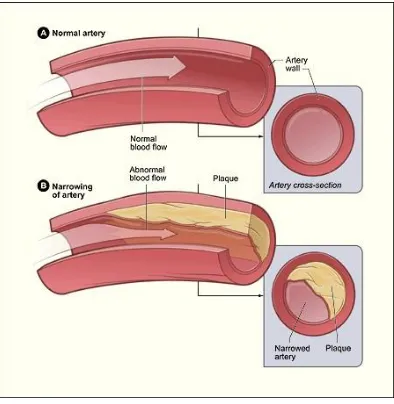
Atherosclerosis, a common cause of a CVD, is a chronic artery disease that affects millions of
people worldwide which is a condition that primarily affects the aorta, and large- and
medium-sized arteries, particularly the coronary and cerebral arteries, where disturbed flow patterns occur.
It refers to a process where the arterial walls thicken and harden due to a gradual build-up of
intracellular or extracellular fatty deposits, such as lipids and cholesterol and proliferation of
smooth muscle cells shown in Fig 1.6. In general, atherosclerosis occurs when one passes the age
of thirty, and its existence increases with age. Apart from these purely temporal reasons, lifestyle
also seems to play an important role. Occlusion (thrombosis/embolic blockages) of the artery
lumen can cause a substantial decrease in blood supply to the myocardium, giving rise to chest
pains or transient ischemic attack (temporary blockage of the blood supply to the brain). If the
hardened inner layer of the artery ruptures, thrombus may form inside the artery lumen, leading to
[image:18.612.208.405.485.687.2]stroke (sudden death of brain cells).
Atherosclerosis develops inside the walls of vessels so that the genesis is challenging to observe
and test directly in vivo. The evolution of atherosclerosis is prolonged; disease progression may
span decades, which makes experiments to reproduce and study its pathogenesis very difficult.
Because of these characteristics, most information about the disease has come from clinical
observations and autopsies that indicated the high-frequency localizations of lesions in the vascular
system, the categorization of lesions, and the relative importance of various risk factors.
Aneurysm ruptures are among the other reasons causing hemorrhagic strokes, which, in the
majority of the cases, and unlike most medical conditions, is a sudden event, with no warning
signs. Nowadays, aneurysms still represent a frightening and devastating silent threat, not only due
to their association with high prevalence and mortality rates but also because they are the greatest
cause of long-term disabilities. Thus, aneurysms have a significant impact on cost and the overall
state of health care, and the understanding of the fundamental aspects of their pathophysiology and
treatment is a subject of great importance, both nationally and globally, highly contributing to the
[image:19.612.231.379.375.655.2]progress of the modulation of the complex phenomena associated with these pathologies.
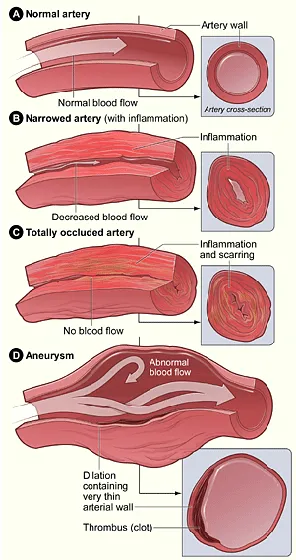
Generally, an aneurysm is a localized pathological dilation of the wall of a blood vessel shown in
Fig 1.7, due to the congenital or acquired structural weakening of the wall media, and potentially
results in severe complications, or even sudden death, through pressing on adjacent structures,
thrombus formation or rupturing causing massive hemorrhage [13]. The natural history of this
pathology is far from being fully understood, mainly because of the paucity of temporal
investigations, which is related to the fact that aneurysms are rarely detected before rupture. A
possible cause for these incidents is the involvement of hemodynamics, the basis for the current
research activity.
1.4 Hemodynamics
Hemodynamics or blood dynamics is the study of the properties and flow of blood. Hemodynamic
factors that have been suggested to be important in plaque formations and arterial dilations are
derived from the blood pressures, velocity fields and involve several different forms, such as flow
separation and vortex formation [14,15].
The red blood cells transport oxygen and waste products by flowing through the blood vessels.
Blood flows through the vessels by blood pressure. Just as water flows through pipes from areas
of higher pressure to lesser, blood flows through the body from areas of higher pressure to areas
of lower pressure. Blood pressure is measured both as the heart contracts, which is called systole,
and as it relaxes, which is called diastole. A systolic blood pressure of 120 millimeters of mercury
is considered right in the middle of the range of normal blood pressures, as is a diastolic pressure
of 80 mm of mercury. Normal blood pressure is essential for proper blood flow to the body's organs
and tissues. Each heartbeat forces blood to the rest of the body. The force of the blood on the walls
of the arteries is called blood pressure. Blood pressure moves from high pressure near the heart to
low pressure away from the heart. Blood pressure depends on many factors, including the amount
of blood pumped by the heart. The diameter of the arteries through which blood is pumped is also
an essential factor. Generally, blood pressure is higher when more blood is pumped by the heart,
and the diameter of an artery is narrow. Stressful situations can result in a temporary increase in
blood pressure. If an individual were to have a consistent blood pressure reading of 140 over 90,
he would be evaluated for having high blood pressure. If left untreated, high blood pressure can
However, the specific mechanism whereby blood flow patterns influence the development of
arterial disease remains a challenging topic in bioengineering. A considerable amount of evidence
shows that the hemodynamics and the genesis of arterial diseases are believed to be reasonably
related through the action of mechanical parameters on and near the vessel wall, such as Wall
Shear Stress (WSS) and its derivatives. Details of the pressure and shear stress distributions on the
walls of a bend or bifurcation are of interest in the study of atherogenesis because it appears that
the localization of plaque is related to local flow patterns. Besides that, aneurysms are usually
located at high WSS sites, like bifurcations, and can be created in animals through systemic
[image:21.612.168.446.270.388.2]hypertension and high-flow blood.
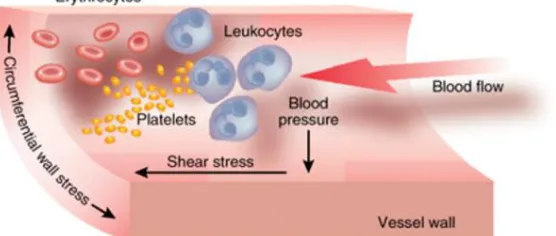
Figure 1.8 Forces exerted by blood flow on an arterial wall
As shown in Fig 1.8, In vivo, the pulsatile blood flow through the branched tubular array of the
arterial vasculature generates three types of hemodynamic forces: (1)WSS, a tangential frictional
drag force due to blood viscosity; (2) transmural pressure, a perpendicular cyclic force due to blood
pressure; (3) mechanical stretch, a cyclic tensile stress of pulsatile flow.
Among these hemodynamic forces, the influences of WSS on the pathogenesis of atherosclerosis
have been extensively investigated and well understood. WSS plays a significant role in the
pathogenesis of the atherosclerotic plaque, particularly when laminar blood flow is disturbed with
low or oscillatory WSS. The combination of altered arterial hemodynamics around
atherosclerosis-prone sites (e.g., curvatures, bifurcations), where secondary flows occur Fig 1.9, and systemic risk
Figure 1.9 Plaque build-up leading to Atherosclerosis on the left; Dilation leading to Aneurysm on right
Despite the continuous progress in the medical research field and the wide range of studies on the
pathogenesis of aneurysms, the exact developmental stages are far from being thoroughly
comprehended. Because of the scarcity of studies with a significant amount of patients and
longterm follow-up [16], mostly due to the fact that the majority of aneurysms are only detected
in an advanced stage. How and why these pathologies first develop is intimately related to
interaction between the biological processes of the arterial wall and high-flow hemodynamic
forces [17]. Like platelets and RBC, endothelial cells discriminate among different types of flow
patterns and are physiologically stimulated by stress, i.e. blood pressure acting normal to the cell
surface and WSS acting tangentially. Endothelial cells respond to stress through an active adaptive
process that leads to modifications in their morphology and function [18, 19]. Moreover, WSS
promotes the elongation and alignment of endothelial cells nuclei in the direction of the local flow
pattern [19] causing destructive remodeling that leads to a disturbance of the equilibrium between
the blood pressure forces and the internal wall stress forces, resulting in the progressive dilation
of the wall.
1.5 Engineering Approach: Computational Modeling
Currently, the investigations use a variety of methodologies, from in vitro to in vivo models, but a
great percentage is based on mathematical modeling and numerical simulations of blood flow,
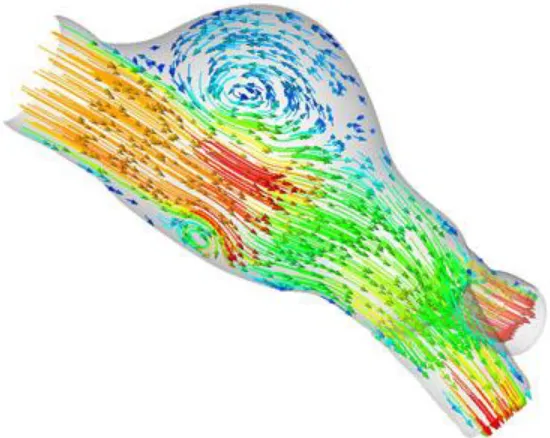
since it is now well established that blood flow dynamics shown is Fig 1.10 play a major role in
the development of cardiovascular pathologies, like atheroclerosis & aneurysms. At a macroscopic
level, the arterial wall is a complex multi-layer structure that deforms under pressure forces.
In the past, hemodynamic computations have often been performed using rigid geometries, which
resolution if the boundary condition information is correct; therefore, the geometrical data and
boundary velocity data that come from in vivo measurements are necessary for realistic modeling
of blood flow in the artery. Medical imaging techniques can supply these data. From CFD
solutions, it is straightforward to present velocity distributions for blood flows and to extract WSS
and other important hemodynamic factors. However, CFD models do not account for arterial wall
distensibilty.
The physical process of the oxygen supply to the human brain and various organs provided by
blood flow in vessels in a cardiovascular system resembles a flow of an incompressible fluid in a
compliant tube. Even though constitutive equations have been proposed for the structural behavior
of the vessel wall, its elastic characteristics in vivo are still very difficult to determine. This is a
case where the influence of the dispacements of a structure has a significant effect on the flow and
[image:23.612.171.446.336.555.2]pressure of the fluid.
Figure 1.10 Compuation model of an arterial bifurcation
Fluid-structure interaction (FSI) scenarios are those that involve the coupling of fluid mechanics
and structural mechanics problems. FSI plays an important role in several different types of
applications such as biomedical, material processing, automotive, aeronautical, and civil
engineering. The solutions of structural and fluid mechanics problems can be considered a
relatively mature technology. Commercial codes have been available from the mid-70s for
problems brings up new algorithmic issues, such as impulsive starts, velocity coupling, added
mass, coupling of Lagrangian and Eulerian approaches, large mesh movements, contact, change
in topology, etc.
In recent years, the study of FSI effects in biomechanics has intensified, especially in the field of
arterial blood flow. Other examples of application of FSI analysis in cardiovascular research is the
modeling of blood flow through the left ventricle [20] and the aortic valve [21]. A
three-dimensional model of the natural heart with moving valves [22] was simulated using the immersed
boundary method, which was specifically developed for the study of FSI problems in the
cardiovascular system.
As mentioned previously, arteries differ in size considerably. Large arteries, in general, are very
elastic. Due to their large deformations they can store and release elastic energy, making the blood
flow more regular than if they were rigid. Smaller arteries are more rigid when compared to larger
arteries. In the past, all numerical models used idealized geometries of large- and medium-sized
arteries that simulate the hemodynamic quantities - pressure, velocity, wall displacement, and wall
shear stresses; in a generalized way but these methods fell short since, ultimalety, each aneurysm
is a unique case, with a singular geometry, location, relationship with the surrounding
environment, and hemodynamic behavior, which is heavily dependent not only on its own
geometry but also the parent vessel.
The realistic simulation of the local and global events, that have such a significant influence on
the blood flow behavior and cardiovascular pathologies, represents a computational challenge
because of the diversity and intricacy of the human arterial system, not only in terms of its
geometry but also the functional interactions that take place between several entities. The use of
coupled mathematical models and numerical simulations, is still a very challenging task and a field
of active research [17]. The aim of this research was to develop these coupled engineering
modeling tools to describe complex blood flow patterns, thereby helping to determine the link
between blood flow patterns and arterial disease. A powerful way to achieve this long term goal is
to correlate patient-specific hemodynamic patterns with patient-specific spatial distributions of
artery disease. This, in turn, requires tools for quantifying artery hemodynamics, which forms the
2 RESEARCH QUESTION
People with CVDs or who are at high cardiovascular risk (due to the presence of one or more risk
factors such as hypertension, diabetes, or already established disease) caused by modifiable or
non-modifiable risk factors need early detection and monitoring management, as appropriate.
In recent years, the number of publications in the area of modeling and simulation of the cardio
vascular circulatory system is growing exponenetially. Regarding three-dimensionl modeling,
typical approach is mainly based on the classical CFD analysis of an incompressible hemodynamic
flow within a rigid wall flow path. One of the objectives of the present investigation is to create a
3D model, accounting for the fluid-structrure interaction between a Newtonian viscous fluid and
a compliant arterial wall in typical 3D model of a circulatory system such as bifurcated branches
and an artery with an aneurysm. Wall shear stress distributions and locations and extension of
circulatory zones obtained based on a FSI model and a classical CFD are compared and
conclusions made.
Geometric multiscale model is an approach for modeling the circulatory system including
reciprocal coupling of a 1D FSI model with a total 3D FSI approach. It allows to save significantly
time of circulatory system modeling compared to the fully 3D simulation.The propagating nature
of a hemodynamic flow requires an appropriate technique to avoid artificial wave reflections and
spurious oscillations at the interphases connecting 3D to the 1D model. This approach leads to the
nontrivial problems at mechanical, mathematical and numerical levels.
The boundary conditions applied in this work are based on a 3D -1D FSI variational principle,
complemented by the compatibilty relations on outgoing characteristics. Interactions between the
commercial ANSYS/FLUENT 3D simulation model and the CardioFAN - an in-house qausi 1D
nonsteady FSI circulatory system modeling computer code, is provided by implemeting the
User-defined functions (UDFs), allowing the reciprocal exchange of information between the
commercial “black box” system and the in-house code. Obtained results are validated against total
3D ANSYS based FSI modeling of an aortic aneurysm affecting the human arterial system.
This study is motivated by the prospect of implementing multi-scale models for the human
cardiovascular system instead of a total 3D simulation. It is clear that a realistic, detailed numerical
simulation of the flow in a segment of an artery (like, for instance, the carotid bifurcation or an
remaining part of the cardiovascular system. One possibility to this direction is ordered by the
leveraging previous studies on unique set of coupling boundary conditions at an interface between
3D FSI model of the idealized large arterial vessel and a quasi-1D FSI artery segment.
Hemodynamics are obtained and analyzed to gain insight into the complexity of the unsteady flow
in that region and also to evaluate the computational requirements for an accurate representation
3 LITERATURE REVIEW
The latest computing technologies have demonstrated an increasing influence upon medical health
care, and biomedical engineers have become intimately involved in developing computer-aided
medical tools such as image processing, biomaterials and biosensors. To review current relevant
research progress, particularly significant amount of work and related publications due to the
continued widespread incidence of CVDs, especially arteriosclerosis and identify interesting areas
in this field, a preliminary literature review is presented here.
According to statistics reported by the American Heart Association for adults of age above 20, the
prevalence of stroke in 2005 was as high as 6.5 million; and each year, approximately 795,000
cardiac patients experience a new or recurrent stroke[25]. Of all strokes, 87% are ischemic, 10%
are intra-cerebral hemorrhage, and 3% is a subarachnoid hemorrhage.
The causative factors that contribute to the formation of atherosclerotic lesions have been studied
extensively[26,27]. Hemodynamic factors are important determinants of the local distribution of
atherosclerosis and the development of vascular plaques. The presence of atherosclerotic plaques
has been shown to be closely related to the vessel geometry[28,29]. And typically occur in arterial
regions that display complex geometry resulting in ‘disturbed’ blood flow behavior[30,31].
The history of blood flow measurement started from the mid of 19th century when Dokunin et
al.[32] the ends of a known volume airtight U-tube was connected to a blood vessel to measure the
rate of arterial blood flow according to the Poiselle formula. After decades of evaluation, a variety
of techniques are routinely employed for the measurement of beat-to-beat cardiac output
nowadays. Currently, the most widely applied methods for in vivo blood flow measurement or the
local arterial flow field include Doppler[33,34], magnetic resonance imaging flowmetry[35], and
ultrasonic transit-time flow sensors[36]. Whereas, WSS is calculated from velocities close to the
wall, or is measured directly with an electromechanical technique.
In vivo methods as mentioned above have the potential to provide the most realistic flow field data
with limited spatial and temporal resolution[37,38], which limits the representation of the real
physiological boundary conditions such as vessel geometry, blood and tissue properties. However,
the complex etiology of atherosclerosis is not fully understood due to unknown relationships
Although WSS has been implicated in inducing endothelial wall cell responses[39], identifying
WSS from flow patterns and mechanical forces in vivo is difficult[40].
An alternative to vivo measurements is Laser Doppler Velocimetry (LDV), or Particle Image
Velocimetry (PIV) experiments using laboratory models representing the interested arterial
geometries. These models are either reconstructed from patient-specific arteries or summarized
based on population averaged data built by optically transparent materials. Therefore, the
experiments can be of various degrees of complexity, including steady[41] and pulsatile flow
conditions[30,42], and patient specific geometries[43,44].
The initial research conducted on the physics of atherosclerosis incorporated mostly experimental
techniques into visualizing the flow through a tube, partially occluded or otherwise, referred to as
hemodynamics. Variations made as to the occlusion shape and severity, location and the fluid
flowing through the vessel to determine the flow characteristics such as the pressure, shear stress
and flow velocity. Several local 3D in vitro and computational flow models have been applied,
revealing the complex flow structure in the sinus district of carotid artery bifurcation.
Bharadvaj et al.[45,46] defined a standard geometry of the carotid bifurcation (an average over 57
actual geometries from different subjects) and conducted stationary studies of the internal carotid
blood flow. They found a region of low velocities near the non-dividing wall that extend with
increasing Reynolds number. Conversely, the opposite region showed substantial axial velocities
and shear stresses. These results were confirmed by Rindt et al.[47] using experimental and
computational stationary models. This method is limited, however, by the preparation required
before running the equipment; a complicated process susceptible to limitations of accuracy in the
angle of the lasers and attenuation as a result of the tube and fluid material. Some flow
characteristics, such as the WSS are challenging and even the more advanced experimental
methods can provide poor results near the wall region. Although a considerable amount of in vitro
experimental studies have been conducted, the majority of them are focused on flow velocity
measurements, while one of the most important hemodynamic parameters, WSS, is not accessible
due to the relatively low spatial resolution of the visualized flow field.
Anayiotos et al.[48] compared WSS distribution in rigid and compliant models of a carotid
bifurcation using laser Doppler velocimetry. Their results indicated that vessel compliance reduced
significant on the instantaneous maximum and minimum shear stresses, which could be reduced
by as much as 100% in the compliant model in some locations.
Similarly, in computer simulations, a 25% decrease of WSS was reported in a compliant model of
the carotid bifurcation[49]. Plenty of evidence implicates the mechanical forces and intravascular
hemodynamics that result from blood flow [e.g., high circumferential tensile stress and low WSS
(WSS)] and can chronically affect and regulate blood vessel structure[50]. Perktod and Resch[51]
investigated the effects of artery geometric factors, such as the shape of the carotid sinus and the
branch angle, in carotid bifurcation under pulsatile flow conditions. They concluded that the most
physiologically relevant flow variable is WSS and its temporal variation, which is in agreement
with previous in vitro results. Following this, numerous numerical studies were conducted in a
variety of arterial models, predominantly artery bends and bifurcations like WSS research[52,53],
and related indices such as oscillatory shear index (OSI)[54], WSS gradients (WSSG)[55,56].
The first numerical study of pulsatile blood flow in aneurysms[57] demonstrated the presence of
a vortex that varied in size and intensity during the cardiac cycle. Perktold et al.[58] represented
pulsatile flow patterns with velocity vectors and particle paths through axisymmetric aneurysm
models in carotid artery bifurcation. Finol et al.[59] numerically simulated pulsatile flow,
providing flow patterns and their effect on WSSs and pressure distributions.
In the cases above, blood was assumed to be a Newtonian fluid. It has been demonstrated that
assigning Newtonian behavior to blood is only valid when it has shear rates more than 100s-1,
which tends to occur in larger arteries[59]. In most cases, though, non-Newtonian blood models
would provide a more accurate representation of blood flow behavior within the arteries of interest,
particularly for stenosed conditions. In some diseased conditions, blood flow is non-Newtonian
regardless. Direct numerical simulations of non-Newtonian flow have been conducted under
pulsatile conditions, resulting in flow patterns and WSSs that were underestimated for otherwise
Newtonian flow behavior.
As an emerging research tool, computational fluid dynamics (CFD) approach is progressively
adopted by biofluid dynamics community as the preferred technique for numerical modeling of
large artery hemodynamics. CFD simulations can offer numerous hemodynamic parameters such
as WSS which remain difficult to access via in vivo and in vitro measurements. Quite a few
study of compliant aortic bifurcation models[60] found that compliance reduced the shear rate at
the outer walls and increased the shear rate at the inner walls.
Recently, computer simulations have been an excellent non-invasive method of studying flow
within stenosed vessels. Computational simulations tend to have the benefit of being economical
in comparison to experimental methods, which often require substantial investment in equipment.
Initially, most of the simulations tended to make assumptions as to the geometry as well as on the
fluid behavior to reduce computational time. With an increase in computational power, flow
models of disease vessels now incorporate far more complicated simulations that increasingly
approach the conditions as present within the body itself. Recent technological methods have
allowed the scanning of arteries using angiography, which allows simulations to incorporate
realistic artery geometries. The result is simulations which have geometries similar to that of real
patients who have atherosclerosis
In recent years, FSI has been primary interest in modeling blood flow numerical simulations
because of the arterial wall remodeling process. Fluid-structural interaction is a relatively new
technique used in numerical problems to provide an understanding of the impact the flow has on
structures, both within the flow and encompassing the flow. In recent years, the study of FSI effects
in biomechanics has intensified, especially in the field of arterial blood flow. Other examples of
the application of FSI analysis in cardiovascular research is the modeling of blood flow through
the left ventricle[61] and the aortic valve[62]. This study aimed at investigating the hemodynamics
of a compliant patient-specific femoral artery bifurcation model by a FSI scheme[63].
Despite the advances made in computing power and numerical algorithms, the high computational
cost and the fundamental challenge of the FSI problem still restrict their use to a limited region,
such as a bifurcation, the aortic arch or the examples listed above. This limitation motivates the
adoption of 1D models, as they allow to compute the fluid dynamics in large part of the arterial
tree at a reasonable computational cost[64,65].
As well as understanding many aspects of vascular physiology, clinical therapy such as the
mechanism of disease, materials for treatment, matching of artificial vascular grafts to host vessels,
assisting physicians in positively identifying individuals who exhibit the development of vascular
disease, and accurate modeling of blood flow. Study of FSI effects in biomechanics has intensified,
(fluid) and arterial wall deformations (structure) and has received growing interest because of its
potential impact in the medical field[66,67]. It has been implemented in modeling abdominal
aorta[68], carotid bifurcation[69], and cerebral aneurysm[70]. Torii, Wood et al.[71] studied the
effects of wall compliance on a patient-specific right coronary artery with a severe stenosis and
found noticeable differences in the instantaneous WSS produced by the FSI and rigid wall models.
Apart from the difference in geometrical properties, a significant diversity in mechanical properties
of the vessel wall exists. The larger arteries are more elastic than, the smaller ones. Deformations
up to 10% of the vessel radius are common in large arteries. This elasticity gives rise to the
Windkessel effect (i.e., the distension of the large arteries during systole, functioning as a buffering
reservoir for blood)[65] and provides a passive mechanism for smoothing the pulsatile blood flow
from the heart.
Pulse waveforms carry information about the morphology and functionality of the cardiovascular
system. Therefore, a good understanding of the mechanics of pulse wave propagation in normal
conditions and the impact of disease and anatomical variations on the patterns of propagation can
provide valuable information for clinical diagnosis and treatment. When arterial wall behavior is
considered to simulate a wave propagation in the arterial tree, a heterogeneous composition of the
cardiovascular models can be triggered featuring different assumptions on the spatial degrees of
freedom.
On one hand, the heterogeneity of the circulatory system requires the use of different models in its
various compartments, featuring different assumptions on the spatial degrees of freedom. On the
other hand, the mutual interactions between its compartments imply that these models should
preferably not be considered separately. These requirements have led to the concept of geometrical
multiscale modeling, where the main idea is to couple 3D models with reduced 1D and 0D models.
Recently, the coupling and integration of models with different DOF have been analyzed by
Quarteroni et al.[72,64,73–75], linking together reduced 1D model with 3D models of the arterial
tree. This task is very cumbersome since this problem involves deformable domains (compliant
arterial walls) as well as other non-linearities in the governing equations such as convective terms,
FSIs and also, regions of various dimensionality and the coupling conditions between them. This
research proposed an alternative approach for coupling models of non-matching dimensionality
Geometric multiscale FSI models have received considerable attention in recent years is the key
component of hemodynamic modeling. 1D and 3D formulations have been used extensively to
simulate arterial hemodynamics. Landmark contributions in 1D modeling include the works of
Hughes and Lubliner[76], Stergiopulos et al.[77], Olufsen et al.[78], Formaggia et al.[79], Sherwin
et al.[80], Bessems et al.[81], and Mynard and Nithiarasu[82]. 1D methods have been used to
improve our theoretical understanding of hemodynamics, in particular, to study the mechanisms
underlying pulse wave propagation and also clinically in applications such as wave intensity
analysis. Several comparisons against in vivo[78,83] and in vitro[84,85] data have shown the
ability of the nonlinear 1D equations of blood flow in compliant vessels to capture the main
features of pressure and flow waveforms in large arteries. Indeed, arterial pulse wavelengths are
sufficiently long compared to arterial diameters to justify the use of a 1D rather than a
three-dimensional 3D approach when a global and sectionally averaged assessment of blood flow in the
arterial system is required.
Accurate predictions can be made when the flow is predominantly unidirectional, and there are no
sudden changes in cross-sectional area. However, 1D models require the introduction of additional
empirical laws to account for recirculation and pressure losses in the presence of vessel curvatures,
stenosis, aneurysms, etc[86]. These geometric complexities are intrinsically captured with 3D
models, which can provide localized hemodynamic quantities such as WSS, particle residence
time, etc. Nan Xiao et al.[86], studied a systematic comparison between 1D and 3D compliant
arterial models to exploit the advantages of both schemes: a computationally efficient 1-D model
combined with a full 3D model sharing identical boundary condition and constitutive laws. This
overlapping 3D-1D approach can potentially accelerate the solution turn-around time of complex
3D models, therefore improving their clinical applicability, and differs from previous
efforts[75,87,88] where 3D and 1D models were coupled to represent spatially distinct parts of the
arterial tree.
There are a few research groups in the United States that are currently working on cardiovascular
hemodynamics modeling or related topics[89–91], such as a general approach to derive the FSI
problem have been applied based on Hamilton’s variational principle[92,93]. Therefore, based on
the statistical demonstrations on the importance of this issue, regarding health and economic
aspects, a need for expanding the research effort on this subject in the United States seems to be
4 OBJECTIVES
This thesis presents a mathematical and numerical methodology that evaluates the CV parameters
fields during an entire cardiac period in idealized 3D arterial units such as bifurcated branches
and arterial aneurysm . The methodology uses robust algorithms to implement the geometrical
multiscale modeling by coupling 3D Newtonian FSI models with quasi-1D FSI model that
simulate the blood circulation in the circle of Willis. This approach will exploit the combination
of two models, with different complexities, due to the fact that the current technology is not
advanced enough to simulate the whole cardiovascular network using complex and accurate
models, since this implies an elevated computational cost.
To reduce complexity of 3D geometry for the study, an idealized arterial model is taken into
account. We use a quasi-1D as the reduced model, which resort to some simplifying assumptions
in order to provide cross-sectionally averaged quantities for the pressure and velocity fields. The
3D model describes the blood flow using 3D equations for incompressible Newtonian fluids.
Though it is well known that the mechanical interaction between the blood flow and the compliant
vessel wall is relevant in the blood flow propagation phenomenon, the 3D model is constructed as
a domain free in radial directions, considering the wall displacements.
This methodology solely focuses on simulating the multiscale interaction to overcome defective
boundary conditions at coupling interface and studying local effects, while leveraging quasi-1D
segment of the global in-house 1D algorithm demonstrated in application of Hamilton’s variational
method by A.S.Liberson et al. [92-94]. Available software packages for solving the governing
fluid and structural equations and parsing boundary parameters between 3D & 1D models are
employed. The main objectives of the present research are summarized as follows:
To model an idealized large arterial bifurcation and perform 3D FSI pulsatile flow simulation,
using isotropic compliant structure and artificial boundary conditions.
To develop a scheme to implement an in-house coupling formulation at 3D-1D interface using
commercially available tools. In this case, a validated 1D model acts as an absorbing
downstream boundary condition to 3D.
5 METHODOLOGY
Governing equations developed are independent of the material characteristics. A constitutive
relation (material model) is required to relate the stress state of the body to its motion or state of
strain. We are interested in Newtonian behavior for fluids and elastic behavior for solids.
5.1 Fluid Domain: Newtonian Blood
The most appropriate set of equations to simulate the blood flow in the arterial network is the
time-dependent fluid equations Navier-Stokes expressing the balance of linear momentum derived from
the underlying physical principles of conservation of the momentum and mass, Eq. 4 & 5
respectively. These describe blood flow in arteries as a homogeneous, unsteady, and
incompressible fluid, in terms of the velocity and the pressure fields. In an open bounded domain,
the system of equations representing blood is given by:
𝜌𝜕𝑢
𝜕𝑡+ 𝜌(𝑢. ∇)𝑢 − 𝑑𝑖𝑣 𝜎(𝑃, 𝑢) = 0 (4)
𝑑𝑖𝑣 𝑢 = 0 (5)
𝜎(𝑃, 𝑢) = 𝑝𝐼 + 𝜏(𝑢) (6)
where 𝜌 is the fluid constant density, and the Cauchy stress tensor 𝜎(𝑃, 𝑢) depends on the fluid
velocity 𝑢 and 𝑃 is the Lagrange multiplier connected to the incompressibility constraint, which
defines the mechanical pressure for incompressible fluids, identified by 𝑃 = 𝑃(𝑥, 𝑡) and 𝐼 is the
unitary tensor. 𝜎(𝑃, 𝑢) holds the assumption that the stress tensor only depends on the velocity
gradient and the fluid mass density at a particular time, and is independent upon the previous
history of the fluid deformations. 𝜏(𝑢) = 𝜏(𝜇, 𝐷(𝑢)) is also called the extra stress tensor, with
D(u) denoting the symmetric part of the velocity gradient (strain rate tensor),
𝜏(𝑢) = 2𝜇1
2𝜇(∇𝑢 + ∇
𝑇𝑢) = 2𝜇𝐷(𝑢) (7)
Conservation of momentum now is,
𝜌𝜕𝑢
𝜕𝑡+ 𝜌(𝑢. ∇)𝑢 + ∇𝑃 − 𝑑𝑖𝑣 𝜏(𝑢) = 0 (8)
The Newtonian fluid model is a good approximation for many fluids and assumes that the stress is
proportional to the rate of deformation:
𝜎 = 2𝜇𝐷(𝑢) + 𝜆𝑡𝑟(𝐷(𝑢))𝐼 (9)
Here 𝜇 is the coefficient of shear viscosity or dynamic viscosity. The second constant of
proportionality 𝜆 is termed the second viscosity which relates stress to volumetric deformation. In
the incompressible limit 𝜆 → ∞ and 𝑡𝑟(𝑑) = 0, to account for the unknown hydrostatic pressure
𝜆𝑡𝑟(𝑑) is replaced so that the Cauchy stress is given by
𝜎 = 2𝜇𝐷(𝑢) − 𝑝𝐼 (10)
Applying the constitutive fluid equation, the Navier-Stokes equations for incompressible
Newtonian fluids becomes,
𝜌𝜕𝑢
𝜕𝑡 + 𝜌(𝑢. ∇)𝑢 + ∇𝑃 − 𝑑𝑖𝑣(2𝜇𝐷(𝑢)) = 0 (11)
𝑑𝑖𝑣 𝑢 = 0 (12)
The Reynolds number, Eq 14, is used to predict transitions from laminar to turbulent flow. It is a
similarity parameter for viscosity and expresses the ratio of steady inertial forces to viscous forces
within the fluid. And Eq 11 can be written as Eq 13,
𝜌𝜕𝑢
𝜕𝑡 + 𝜌(𝑢. ∇)𝑢 + ∇𝑃 −
1
𝑅𝑒(2𝜇 𝑑𝑖𝑣 𝐷(𝑢)) = 0 (13)
𝑅𝑒 =𝜌|𝑢|𝐷
𝜇 (14)
A low Reynolds number (Re << 1) reflects the high viscous forces over inertial ones, meaning that
the local boundary highly controls the flow pattern. For a Reynolds number much less than one,
which is the case of the smaller arteries (arterioles), it is reasonable to neglect convective
acceleration terms. On the other hand, a high Reynolds number (Re >> 1) reveals the turbulence
in the flow pattern, resultant from the inertial dominance. An increased Reynolds number seems
to increase the WSS and to decrease the pressure [95]. Typically, viscous stresses (Re << 1) tend
to stabilize and organize the flow, and excessive inertial forces (Re >> 1) tend to disrupt the
organized flow, leading to spontaneous flow irregularity and eventually to turbulent behavior.
Another non-dimensional Womersley number, Eq 15, which governs the relationship between
𝛼 ∝ 𝐷
√𝜇𝑇 (15)
where 𝐷 is the artery diameter, 𝑇 is the pulse period. physically, the Womersley number is assumed
to be the ratio between the tube diameter to the laminar boundary layer growth over the pulse
period, since this growth can be considered proportional to√𝜇𝑇. For very small Womersley values,
the velocity reaches a parabolic profile, as predicted by the Poiseiulle because of the low frequency
of pulsations. In fact, in some situations, even unsteady flows are reasonable treated as quasi-static
[97]. For high Womersley number greater than 10, the velocity profile tends to flatten. Besides
obtaining the velocity and pressure fields, it is also relevant to get information about mechanical
parameters. The most common indicators related to arterial diseases are defined, due to their
believed influence in the origin and aggravation of many pathologies, including aneurysms, on or
near the wall [98]. The most sought hemodynamic indicator is the WSS. The WSS is the shear
stress vector at the wall, including direction, can be obtained by substracting the normal component
of the viscous stress vector from the total viscous stress vector, Eq 16, on the wall, and is given by
𝜏𝑡. 𝑡 = τ − 𝜏𝑛. 𝑛 (16)
Where 𝑡 is the unit tanget to the wall, 𝑛 is the outward normal to the wall surface, 𝜏𝑡 & 𝜏𝑛 are the tangential and normal components of the viscous stress vector, respectively. The WSS is not easily
measured for pulsatile flows, but for laminar steady flows it i,s calculated as Eq 17, where Q is the
cross-sectional flow rate.
𝑊𝑆𝑆 =32𝜇𝑄
𝜋𝑑3 (17)
A numerical simulation is an excellent tool, to gather information on hemodynamic indicators,
since having the velocity flow field it is extremely feasible to compute the WSS or its derived
measures, contrary to in vitro or in vivo experiments. The prescription of proper initial and
boundary conditions is a crucial step in the mathematical modeling and the numerical formulation
of the arterial region of interest. After defining the initial condition, 𝑢 = 𝑢0, for 𝑡 = 0 in the fluid equations are mathematically well defined and prepared to be solved by numerical methods only
when the appropriate set of boundary conditions is imposed on the limits of the bounded domain.
The classical conditions that we can prescribe on the boundary are the Dirichlet and the Neumann,
or natural, boundary conditions, Eq 18 & 19 respectively. For the fluid equations, the former
𝑢(𝑥, 𝑡) = 𝑢̅ (18)
𝜎(𝑥, 𝑡). 𝑛 = 𝑡̅ (19)
Besides the Dirichlet and Neumann boundary conditions, it is also possible to prescribe an
appropriate combination of these two, called Robin boundary conditions.
5.2 Structure Domain: The Artery Wall
Arteries exhibit non-linear elastic behavior, where the material does not follow Hooke’s Law
Fig.5.2.1(b). Due to the properties of its constituents, the arterial wall exhibits a non-isotropic
nonlinear response to cyclic pressure loads Fig.5.2.1(a). The relationship is non-linear showing
that as the stress in an artery increases, the material becomes stiffer and resists the strain. Moreover,
the arteries are tethered mainly longitudinal by the surrounding tissue observed using a change in
the geometrical ratio between the diameter and thickness of the arterial wall. Due to these complex
properties, it formally is not possible to define Young's modulus as done in linear elastic theory.
Still, in order to obtain a global idea of the elastic behavior, it is possible to lump all properties
together as if the arterial wall was homogeneous and measure the stress-strain relationship. In such
cases, we define Young’s modulus as the slope of the curve at a given stress-strain point as shown
in Fig 5.2.1(c), linearized about an equilibrium state, for instance, the mean or diastolic pressure
yields an incremental effective Young’s modulus, defined as
𝐸 =𝑑𝜎
𝑑𝜀 (20)
Figure 5.2.1 Non-linear elastic response due to cyclic pressure loads
Small displacements, for FSI problems that involve small displacements, the fluid-flow field can
be solved assuming that the structural displacement does not affect the flow field. As a result,