Submitted to Archive of Applied Mechanics
Investigation of a hydraulic impact
– a technology in rock breaking
Martin Genet
*Laboratoire de Mécanique et de Technologie,
61 av. du Président Wilson, 94235 Cachan Cedex, France
Wenyi Yan
Department of Mechanical and Aerospace Engineering,
Monash University, Clayton VIC800, Australia
Thanh Tran-Cong
Computational Engineering and Science Research Centre,
University of Southern Queensland, Toowoomba QLD4350, Australia
2
Abstract
Finite element method and dimensional analysis have been applied in the present paper to study a hydraulic impact, which is used in a non-explosive rock breaking technology in mining industry. The impact process of a high speed piston on liquid water, previously introduced in a borehole drilled in rock, is numerically simulated. The research is focused on the influence of all the parameters involved in the technology on the largest principal stress magnitude in the rock, which is considered as one of the key factors to break the rock. Our detailed parametric investigation reveals that the variation of the rock material properties, especially its density, has no significant influence on the largest principal stress, which implies a good adaptability of the method for different rock materials. The influences of the depth of the hole and the depth of the water column are also very small. On the other hand, increasing the initial kinetic energy of the piston can dramatically increase the largest principal stress and the best way to increase the initial kinetic energy of the piston is to increase its initial velocity. Results from the current dimensional analysis can be applied to optimize this non-explosive rock breaking technology.
Keywords: Finite element simulation, Dimensional analysis, Rock breaking, Non-explosive
method, Hydraulic impact.
1. Introduction
3
Furthermore, explosive method involves complex drilling, blasting, scaling, ground support and the evacuation of people and equipment before blasting. Such a multi-activity cycle is time-consuming, inefficient and unproductively expensive [1]. Another major concern with explosive blasting is the associated danger and undesirable impact on the environment such as fly rocks, air blast, noise pollution and toxic fumes. When blasting occurs close to residential areas, or during tunnel construction, environmental protection regulation could seriously affect the rate of rock excavation. In some cases, blasting would be excluded as an acceptable method of rock breaking. Apart from the breaking of large rock masses for transportability purposes, tunnelling requires more carefully controlled rock breaking. Oversized boulders often cause blockage of mine draw points. When such blockage occurs, extensive shutdown of mine operation will result, causing loss of millions of dollars per hour. Thus, fast, simple, safe and clean methods of breaking boulders are required in some cases to make total mining operation efficient.
4
borehole and is impulsively loaded by a high speed piston. The highly pressurized water, with the reflection of the pressure wave, will result in huge stresses in the rock mass, especially at the bottom of the hole, which is a stress raiser. Consequently, cracks will be initiated around the borehole, especially at the bottom, and the pressurized water will penetrate into the cracks, providing the driving force for crack propagation. Eventually, cracks will propagate back to the surface due to free surface effect and a volume of the hard material will be removed.
All the available inventions and patents focused on the principle of the rock breaking methods, i.e., different approaches are used to answer the basic question of how to break a rock mass. In terms of the application of the non-explosive technology, one needs to quantify many parameters, such as the depth of the borehole and the initial velocity of the piston, etc. In the current investigation, the dimensional analysis and numerical method are applied to quantify the hydraulic impact process, which is involved in a non-explosive rock breaking technology as shown in Fig. 1. The efficiency of the impact is evaluated by the largest principal stress magnitude in the rock during an impact process. Numerical results from the investigation will assist industry to quantitatively apply this non-explosive rock breaking technology and, therefore, to improve rock breaking efficiency.
5
2. Impact simulation
The finite element method has been applied to simulate the hydraulic impact process. We use a finite element package, CASTEM, to create the finite element mesh, a PERL script to translate CASTEM meshes into ABAQUS meshes, the commercial package ABAQUS/Explicit to perform the simulations, and a PYTHON script to automate this simulation process.
2.1. Finite element mesh
The borehole, as shown in Fig. 1, can be idealized as a cylinder. Therefore, this problem can be treated as axisymmetric. Moreover, the rock body can be considered as semi-infinite. Infinite elements are used to simulate the semi-infinite body. Figure 2 shows the finite element mesh generated by using CASTEM. The definition of the geometrical parameters shown in Fig. 2 can also be found in Table 1.
6
2.2. Material properties
The piston is normally made of steel, which is assumed to be a homogeneous and isotropic material. We also assume that the piston stays in its elastic domain during the impact process. Thus we can choose the piston’s material data as Young’s modulus Ep =200 GPa, Poisson's
ratio
ν
p =0.3 and densityρ
p =7800 Kg m/ 3.As this study does not consider any cracks in the rock, water will be confined within the borehole, and then transfer force and energy from the piston to the rock through deformation and not through flow. In this case, according to Wilson [6], the water can be modelled as an elastic, homogeneous and isotropic solid with theses material coefficients: Young’s modulus
6207813 w
E = Pa, Poisson's ratio νw =0.4995, and density ρw =1000 Kg m/ 3. Let’s remark that this material has the key properties for our present study: quasi-incompressibility
(ν ≈0.5) and correct pressure wave speed (c
λ
2µ
1500 /m sρ
+
= ≈ ). For further studies,
when cracks will be introduced, an improved model will be used for water.
7
relevant universe equipments for this non-explosive technology. Furthermore, the possible plastic deformation of the rock is not taken into account in the present research, neither the creation nor the propagation of cracks, which will be our future study. Consequently, there are three parameters to describe the rock: Young’s modulus Er , Poisson's ratio
ν
r and it's densityρ
r.2.3. Contact simulation
As shown in Fig. 1 and Fig. 2(a), there are three pairs of contacts involved in the impact process, i.e., the contact between the piston and the water, the contact between the piston and the rock, and the contact between the water and the rock. We use the hard contact algorithm from ABAQUS without damping to simulate these contacts. The friction is also neglected in our simulation. Practically, the friction between water and piston or rock should be very low. Further study will be carried out after we obtain reliable friction value involved in the contact between piston and rock.
2.5. Simulation
8
maximum principal stress at this local area in the rock. One can imagine, once cracks initiate, the highly pressurized water will penetrate into the cracks and drive the cracks to propagate, which will be the core of the investigation to understand the rock breaking in our future study.
3. Dimensional analysis
All the parameters involved in the simulation are listed in Table 1. Here, the radius of the piston is the same as the radius of the borehole. Dimensional analysis is a powerful method to systematically carry out parametrical study on a complicated problem involving many parameters, see examples [8-10]. This method is applied in the current investigation. The objective variable in our dimensional analysis is chosen as the largest principal stress in the rock,
σ
m, during an impact process. The rock material can be roughly considered as brittle material. According to Coulomb’s criterion of maximum normal stress, the maximum principal stress will initiate cracks in the rock and lead to the fragmentation of rock mass. Generally, the largest principal stress is a function of all the parameters listed in Table 1, i.e.,(
L ,E ,p p p, p,V ,D ,E ,p w w w, w,R ,D ,R ,E ,h h a r r, r)
m fσ = ν ρ ν ρ ν ρ . (1)
According to the Buckingham Π-theorem [11] for dimensional analysis, the number of parameters can be reduced based on the number of fundamental dimensions presented in the physical problem by using dimensionless parameters. For this purpose, Dh, the depth of the hole,
ρ
p, the density of the piston and Ep, the Young modulus of the piston are chosen as the primary quantities that express all the fundamental dimensions of the physical problem (m, N, s). Therefore, the dimensionless function for the largest principal stress isp p w w w h a r r
1 p 1/ 2 1/ 2 w r
h p h p h h p
L V D E R R E
, , , , , , , , , , ,
D D D D
m
p p p p
E E − E E
= Π
×
σ
ρ
ρ
ν
ν
ν
9
Among all the dimensionless parameters in Eq. (2), some values can be considered as unchanged in this physical problem. The piston is generally made from steel and water is normally used as the liquid in this technology. Therefore, the material data for the piston and the water can be treated as constant. Consequently, the following dimensionless parameters will be considered constant in our model:
0.3
p
ν
= ,ν
w =0.4995, (3)6 11 6207813 31 10 2 10 w p E
E = × = × ,
1000 0.128 7800 w p
ρ
ρ
= = . (4)Therefore, the dimensionless function (2) can be simplified as
p p w h a r r
2 1/ 2 1/ 2 r
h p h h h p
L V D R R E
, , , , , , ,
D D D D
m
p p p
E E − E
= Π
×
σ
ρ
ν
ρ
ρ
. (5)After this dimensional analysis, the number of variables involved in the stress analysis has reduced from 15 in the original Eq. (1) to 8 in Eq. (5).
Based on the understanding of this physical problem, the following limits of the domains for geometrical parameters are appropriated for this problem:
[
0.1; 0.8]
ph L
D ∈ ,
[
0.1; 0.8]
w h D
D ∈ . (6)
[
0.01; 0.5]
hh R
D ∈ ,
[
0.001; 0.05]
a h R
D ∈ . (7)
Referring to [12], the domains of the mechanical properties of different types of rocks are shown in Table 2. According to this table, after choosing Ep =200 GPa and
3
7800 /
p Kg m
10
[
0.05; 0.5]
r p E
E ∈ ,
ν
r ∈[
0.1; 0.35]
,[
0.25; 0.4]
r p
ρ
ρ
∈ . (8)According to Denisart et al. [5], the initial velocity of the piston can vary from 10 /m s to 200 /m s, which corresponds to the following domain of the dimensionless initial velocity:
[
]
p
1/ 2 1/ 2
p
V
0.0020; 0.0395
p
E ×
ρ
− ∈ . (9)In our numerical simulations, the limits of some parameters domains have been adjusted due to numerical instability problem. The Poisson’s ratio of water is 0.4995, which is close to the value of 0.5 of imcompressible materials. Additionally, the water is highly confined in the borehole and exposed to a highly compressive load from the impact of the high speed piston. Due to these factors, the calculation can sometimes lead to numerical instability [13]. A unsuccessful numerical instability calulcation can be detected by observing large abnormally distorted and penetrated deformed meshes. To overcome this instablility problem, some values lower than the upper limit or higher than the lower limit of the domains defined in above Eqs (6-9) were chosen sometimes. In the following section, only the correct results from the stable calculations are reported. It is believed that the fitted laws in the restricted domains of study in the following section are valid in the entire domains defined in Eqs (6-9).
4. Results and discussions
4.1. Influence of rock properties
4.1.1. Rock density
11
We have considered the two limit values of the domains of all the dimensionless parameters in Eq. (5), one by one from Fig. 5(a) to Fig. 5(g), while fixing the values of all the others dimensionless parameters at the middle values of their domains, which are defined in Eqs (6-9). For example, the two curves in Fig. 5(a) are obtained for Lp/Dh =0.17 and Lp/Dh =0.58 respectively while fixing vr =0.19, Er/EP =0.3, Ra/Dh =0.026, Rh/Dh =0.26,
/ 0.5
w h
D D = and 1/ 2 1/ 2
/( ) 0.013
p p p
V
ρ
− E = .Figures 5(a-g) clearly indicate that the variation of the normalized largest principal stress /
m Ep
σ
due to the change of the normalized rock densityρ ρ
r/ p from 0.25 to 0.4 in all the studied cases is negligibly small. Because all the studied cases have covered the domains of this physical problem, one can deduce that it is generally correct that the influence of the variation of rock density on the largest principal stress in the rock can be neglected. Consequently, the dimensionless rock density in Eq. (5) can be removed and the dimensionless stress function can be further simplified asp p w h a r
3 1/ 2 1/ 2 r
h p h h h
L V D R R E
, , , , , ,
D D D D
m
p p p
E E − E
= Π
×
σ
ν
ρ
. (10)4.1.2. Rock Poisson’s ratio
12 2.98
0.0043 0.0107 m
r p
E = + ×
σ
ν
. (11)4.1.3. Rock Young’s modulus
Figure 7 shows the variation of the normalized largest principal stress in the rock during the impact for different normalized values of the Young's modulus of the rock. Similar to Fig. 6,
/ m Ep
σ
increases slightly with the increasing of Er/Ep from 0.1 to 0.5. The set of the numerical data is also fitted by an exponential function, which is shown with the thick curve in Fig. 7.4.2. Influence of borehole dimensions
4.2.1. Borehole depth
The depth of the borehole, Dh, is chosen as the primary length in the dimensional analysis. Its influence on the problem can be implicitly reflected in the parametric study of other dimensionless length parameters, such as the dimensionless piston length and the dimensionless water depth. But it is understandable that the depth of the borehole has no direct influence on the largest principal stress in the rock, and that is the reason to choose it as the primary length to normalize the other parameters.
4.2.2. Borehole radius
13
piston. Increasing borehole radius means increasing the radius of the piston, and therefore, increasing the initial kinetic energy of the piston with fixed initial velocity. This influence in real value is very significant.
It is interesting to plot the instantaneous average velocity and the instantaneous kinetic energy of the piston over the impacting time for several values of the dimensionless radius of the hole. Figures 9 and 10 show these results. In Fig. 9, at the beginning, the piston is moving down, that is why the average velocity is negative. Then its average velocity decreases, and at
1/ 2 1/ 2 7
h p p
t
D ×
ρ
×E− = , the piston has zero averaged velocity. After that, the piston is comingup, so its average velocity is increasing. This point can also be followed in Fig. 10: the piston starts with its kinetic energy, which decreases until 1/ 2 1/ 2 7
h p p
t
D ×
ρ
×E− = where it is null,14
To understand this, an impact process is discussed by following Fig. 11, which shows the maximum principal stress in the element that has the largest principal stress and the instantaneous average velocity of the piston versus impacting time for Rh Dh =0.0167:
- The piston hits the water with its initial velocity at the beginning of the simulation, which starts the impact process.
- The created shockwave comes down in the water, and arrives at the bottom of the borehole at 1/ 2 1/ 2 2
h p p
t
D ×
ρ
×E− = . Here is the first peak in the stress curve, with3
1 10
p
E = × −
σ
.- Then the shockwave climb back to the surface (the material behaviour of the water is very different from the others material behaviours, so the transmission of energy is low) and the stress at the bottom of the hole reduces because of the dispersion of energy.
- When the shockwave arrives at the surface at 1/ 2 1/ 2 4
h p p
t
D ×
ρ
×E− = , it is reflectedand comes down again, but with more energy because the piston is still coming down.
- Thus, the second peak in the stress curve will be greater, with
σ
Ep =1.7 10× −3 at1/ 2 1/ 2 6
h p p
t
D
ρ
E− =× × .
- And when the shockwave climbs back and arrives at the surface for the second time,
at 1/ 2 1/ 2 8
h p p
t
D
ρ
E− =× × , the piston has no more velocity downward and is going up.
- So the shockwave comes down again with less energy, and the third peak in the stress curve will be smaller, with 3
1.6 10
p
E = × −
σ
at 1/ 2 1/ 2 10h p p
t
D
ρ
E− =× × .
15
downward. It indicates that the kinetic energy of the piston plays an important role in the determination of the largest principal stress.
4.2.3. Arc radius at borehole bottom
This parameter, the arc radius at the borehole bottom, as shown in Fig. 2, is introduced to avoid the problem of infinite stress at the corner and allow a better modelling of the geometry of the hole in a real situation. Obviously, it will have a substantial influence on the stress in the rock. Figure 12 shows its influence on the problem. The thick curve in Fig. 12 represents an exponential function to fit the numerical dots. The stress tends to infinity when the radius of the arc closes to zero, which is expected because of the problem of singularity when
0 a
R = mm. Practically, this parameter will never be equal to zero, and its value can be estimated from the documentation of the active part of the tool used to drill the hole, in addition to the consideration of the rock material, or from experimental tests.
4.2.4. Water depth
16
reached and the change of the curve’s slope is linked to the discontinuity of the curve for the time to reach the largest stress, and is explained in detail below.
The variation of the time to reach the maximum principal stress with the change of the water depth, shown in Figure 13, is due to the combination of two facts:
- when the depth of water increases, the time for the shockwave to travel from the surface of the water to the bottom of the hole increases too, so the time to reach the largest principal stress increases.
- and when the water becomes deep enough, the largest principal stress is not reached at the third time when the shockwave arrives at the bottom of the hole, but the second time. This can be followed in Fig. 14(a) and 14(b), which give the maximum principal stress in the element that has the largest principal stress in the rock and the kinetic energy of the piston versus times, respectively for Dw Dh =0.333 and Dw Dh =0.417, which are respectively around the corner of the stress curve and the dropping part of the time curve in Fig. 13. Figure 14(a) shows that the largest principal stress is reached at the third time when the shockwave arrives at the bottom of the hole for Dw Dh =0.333 and Fig. 14(b) shows it is reached at the second time for Dw Dh =0.417. This is the reason for the time dropping between
0.333
w h
D D = and Dw Dh =0.417 and the appearance of the corner of the stress curve in Fig. 13.
17
4.3. Influence of piston dimensions
The radius of the piston is the same as Rh, the radius of the hole. Its influence has been studied in the previous subsection.
4.3.1. Piston length
Figure 15 shows that the normalized largest principal stress increases continuously with the increasing of the normalized piston length. The longer the piston is, the higher its initial energy is because of the fixed initial velocity. Therefore, the stress in the rock increases. Such an influence is significant. Figure 15 also shows that the time to reach the largest principal stress magnitude has an irregular relationship with the piston length. This can be explained by Fig. 16(a-c), which show the relationships between the normalized maximum principal stress in the element that has the largest value in the rock during the impact, the normalized kinetic energy of the piston and the normalized impacting time for different values of the normalized piston length, Lp Dh =0.1667 in Fig. 16(a), Lp Dh =0.4167 in Fig. 16(b), and
0.5833
p h
L D = in Fig. 16(c), while the other dimensionless parameters are fixed at the middle values of their domains. Figure 16(a) indicates that when the shockwave climbs back to the surface at the second time when the slope of the curve of the kinetic energy changes, at
1/ 2 1/ 2 7.5
h p p
t
D ×
ρ
×E− = , the piston has no more velocity downward and is coming up (itskinetic energy has already been null), which means that all its energy has already been transferred to the structure, so the largest principal stress has already been reached, the second time when the shockwave arrives at the bottom of the hole (
σ
m Ep =3.5 10× −3 at1/ 2 1/ 2 6
h p p
t
D ×
ρ
×E− = ). It is exactly the same process as in previous Subsection 4.2.2. In the18
second time when the shockwave arrives at the bottom of the hole, at 1/ 2 1/ 2 6
h p p
t
D
ρ
E− =× × ,
but due to the higher impacting energy, the value of the normalized largest principal stress is larger, with
σ
m Ep 4.5 10 3−
= × . And Fig. 16(c) is for an even longer piston: the piston still have some downward velocity (its kinetic energy has not been null) when the shockwave returns at the surface for the second time at 1/ 2 1/ 2 7.5
h p p
t
D
ρ
E− =× × . Therefore, the largest
principal stress is reached at the third time when the shockwave arrives at the bottom of the hole:
σ
m Ep 5.3 10−3= × at 1/ 2 1/ 2 10
h p p
t
D ×
ρ
×E− = . This is the reason why the time to reachthe largest principal stress is irregular as shown in Fig. 15.
4.3.2. Piston’s initial velocity
Figure 17 shows the variation of the normalized principal stress in the rock with the change of the normalized initial velocity of the piston. It clearly indicates that the normalized largest principal stress increases linearly with the normalized velocity and the variation rate is significant.
4.3.3. Initial kinetic energy of the piston
The influence of the dimensions of the piston and its initial velocity on the largest principal stress in the rock have been investigated. We will now try to understand the global influence of its initial kinetic energy, which embrace all these parameters:
2 2
1 2
p p p p p
K = ×ρ × ×π R ×L ×V . (12)
19
the piston radius and changing the initial velocity of the piston, while keeping the other parameters fixed at the middle values of their domains. Numerical results from the three approaches are depicted by three curves in Fig. 18. All these curves indicate that increasing the initial kinetic energy can increase the largest principal stress in the rock. For the purpose of increasing the largest principal stress in the rock over 800 MPa for Ep =200 GPa through increasing the initial kinetic energy, Fig. 18 indicates that the most effective way is to increase the piston’s initial velocity.
5. Conclusions
The hydraulic impact problem of a non-explosive rock breaking technology has been studied. Dimensional analysis and finite element method have been applied to systematically investigate the influence of all the parameters involved in the impact process, which includes the geometrical parameters and the properties of rock, piston and water. Major conclusions from our investigation are summarized below:
- The influences of rock’s material properties on the largest principal stress in the rock are small, which implies a good adaptability of the method for different rock materials.
- The shape of the bottom of the hole has a significant impact on the problem. - The largest principal stress in the rock decreases if the depth of water is increased. - Increasing the initial kinetic energy of the piston has a significant influence on the problem: it implies an increase of the largest principal stress in the rock and a variation of the time to reach that value.
20
Acknowledgement
This work has been partially supported by the Australia Research Council through the grant ARC-LP0562720. The authors also want to acknowledge Laurent Champaney for his useful Perl scripts.
References
1. Singh S.P. Non-explosive applications of the PCF concept for underground excavation.
Tunnelling and Underground Space Technology 13 (1998) 305-311.
2. Young C. Controlled foam injection for hard rock excavation. In 37th U.S. Rock
Mechanics Symposium (1999), Vail, Colorado.
3. McCarthy D.E. Method apparatus and cartridge for non-explosive rock fragmentation.
U.S. Patent (1998) No. 5803551.
4. Young C. Controlled foam injection method and means for fragmentation of hard
compact rock and concrete. U.S. Patent (2002) No. 6375271.
5. Denisart J.P., Edney B.E., Lemcke B. Method of breaking a hard compact material,
means for carrying out the method and application of the method. U.S. Patent (1976) No. 3988037.
6. Wilson E.L. Three-dimensional static and dynamic analysis of structures. 3rd Edition.
Berkeley: Computers and Structures, Inc. 2002.
7. Jaeger J.C., Cook N.G.W. Fundamentals of rock mechanics. 3rd Edition. London:
Chapman and Hall, 1979.
8. Anderson T.L. Fracture mechanics: Fundamentals and applications. 2nd Edition. Boca
21
9. Tunvisut K., O’Dowd N.P., Busso E.P. Use of scaling functions to determine
mechanical properties of thin coatings from microindenation tests. International Journal of Solids and Structures 38 (2001) 335-351.
10. Yan W., Sun Q., Feng X.-Q., Qian L. Analysis of Spherical Indentation of Superelastic
Shape Memory Alloys. International Journal of Solids and Structures 44 (2007) 1-17.
11. Buckingham, E. On Physically Similar Systems; Illustrations of the Use of Dimensional
Equations. Physical Review 4 (1914) 345-376.
12. Russell Mineral Equipment Pty. Ltd. Internal Report. 2003.
22
Table 1. List of all the parameters involved in the impact simulation
Piston Water Rock Borehole
p
E : Young’s modulus Ew: Young’s modulus Er : Young’s modulus Rh: radius
p
ν
: Poisson's ratio νw: Poisson's ratio νr : Poisson's ratio Dh: depthp
ρ
: density ρw: density ρr: density Ra: arc radiusp
L : length Dw: depth
p
23
Table 2. Mechanical properties of typical rock materials
Rock material Density (Kg / m3) Young modulus (GPa) Poisson’s ratio
Granite 2500 - 2800 35 - 80 0.1 - 0.2
Basalt 2400 - 2900 20 - 100 0.1 - 0.3
Sandstone 2200 - 2700 10 - 40 0.2 - 0.3
Dolerite 2900 - 3100 40 - 90 0.1 - 0.3
Limestone 2000 - 2800 10 - 50 0.2 - 0.35
24
Fig. 1. Illustration of the hydraulic rock breaking technology.
high speed piston
borehole
cracks water
25 Fig. 2(a)
Axisymmetric axis Piston
Water
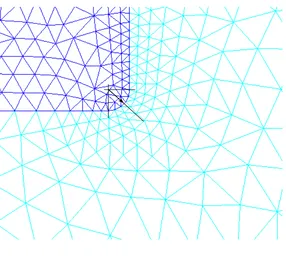
[image:25.595.101.418.72.524.2]26 Fig. 2(b)
Fig. 2. Finite element mesh and relevant geometrical parameters: (a) global mesh; (b) local
[image:26.595.157.443.64.341.2]27
28
29
ρr / ρp
0.24 0.26 0.28 0.30 0.32 0.34 0.36 0.38 0.40 0.42
σ m
/
Ep
0.000 0.002 0.004 0.006 0.008 0.010 0.012
Lp / Dh = 0.17 Lp / Dh = 0.58
Fig. 5(a)
ρr / ρp
0.24 0.26 0.28 0.30 0.32 0.34 0.36 0.38 0.40 0.42
σ m
/
E
p
0.000 0.002 0.004 0.006 0.008 0.010 0.012
νr= 0.01 νr = 0.35
[image:29.595.116.476.98.715.2]30
ρr / ρp
0.24 0.26 0.28 0.30 0.32 0.34 0.36 0.38 0.40 0.42
σ m
/
Ep
0.000 0.002 0.004 0.006 0.008 0.010 0.012
Er / Ep = 0.1 Er / Ep = 0.5
Fig. 5(c)
ρr / ρp
0.24 0.26 0.28 0.30 0.32 0.34 0.36 0.38 0.40 0.42
σ m
/
E
p
0.000 0.002 0.004 0.006 0.008 0.010 0.012
Ra / Dh = 0.0017 Ra / Dh = 0.05
[image:30.595.116.475.77.722.2]31
ρr / ρp
0.24 0.26 0.28 0.30 0.32 0.34 0.36 0.38 0.40 0.42
σ m
/
Ep
0.000 0.002 0.004 0.006 0.008 0.010 0.012
Rh / Dh = 0.017 Rh / Dh = 0.5
Fig. 5(e)
ρr / ρp
0.24 0.26 0.28 0.30 0.32 0.34 0.36 0.38 0.40 0.42
σ m
/
E
p
0.000 0.002 0.004 0.006 0.008 0.010 0.012
Dw / Dh = 0.17 Dw / Dh = 0.83
[image:31.595.120.474.96.721.2]32
ρr / ρp
0.24 0.26 0.28 0.30 0.32 0.34 0.36 0.38 0.40 0.42
σ m
/
Ep
0.000 0.002 0.004 0.006 0.008 0.010 0.012
Vp / (ρp-1/2x Ep1/2) = 0.002
Vp / (ρp-1/2x Ep1/2) = 0.024
Fig. 5(g)
Fig. 5. Influence of normalized rock density on the normalized largest principal stress in the
rock for the cases (a) Lp/Dh =0.17 and Lp/Dh =0.58; (b) vr =0.01 and vr =0.35; (c)
/ 0.1
r P
E E = and Er/Ep =0.5; (d) Ra/Dh =0.0017 and Ra/Dh =0.05; (e) Rh/Dh =0.017 and Rh/Dh =0.5; (f) Dw/Dh =0.17 and Dw/Dh =0.83; (g) 1/ 2 1/ 2
/( ) 0.002
p p p
V
ρ
− E = and1/ 2 1/ 2
/( ) 0.024
p p p
[image:32.595.121.474.95.394.2]33
νr
0.0 0.1 0.2 0.3 0.4
σm
/
E
p
0.000 0.001 0.002 0.003 0.004 0.005
Numerical results
[image:33.595.120.472.91.337.2]Fitted function:σm / Ep = 0.0043 + 0.0107 xνr2.97
Fig. 6. Influence of Poisson's ratio of the rock on the normalized largest principal stress in the
34
Er / Ep
0.0 0.1 0.2 0.3 0.4 0.5 0.6
σm
/
E
p
0.000 0.001 0.002 0.003 0.004 0.005
Numerical results
[image:34.595.121.473.121.370.2]Fitted function: σm / Ep = 0.0050 x (Er / Ep)0.098
Fig. 7. Influence of normalized Young’s modulus of the rock on the normalized largest
35
Rh / Dh
0.0 0.1 0.2 0.3 0.4 0.5 0.6
σm
/
E
p
0.000 0.002 0.004 0.006 0.008 0.010 0.012
Numerical results
[image:35.595.120.470.93.339.2]Fitted function: σm / Ep = 0.0164 x (Rh / Dh)0.547
Fig. 8. Influence of normalized borehole radius on the normalized largest principal stress in
36 t / (Dhxρp1/2x Ep-1/2)
0 2 4 6 8 10 12 14 16 18
V
/
(
ρ p
-1
/2
x
E p
1
/2 )
-0.015 -0.010 -0.005 0.000 0.005 0.010 0.015
Rh / Dh = 0.0167
Rh / Dh = 0.1667
Rh / Dh = 0.2500
[image:36.595.120.469.99.387.2]Rh / Dh = 0.3667
Fig. 9. Normalized average velocity of the piston versus normalized impacting time for
37 t / (Dhxρp1/2x Ep-1/2)
0 2 4 6 8 10 12 14 16 18
K
/
(
E p
x
D
h
3 )
0.0 2.0e-6 4.0e-6 6.0e-6 8.0e-6 1.0e-5 1.2e-5
Rh / Dh = 0.0167
Rh / Dh = 0.1667
Rh / Dh = 0.2500
[image:37.595.122.469.98.391.2]Rh / Dh = 0.3667
Fig. 10. Normalized kinetic energy of the piston versus normalized impacting time for several
38
t / (Dhxρp1/2x Ep-1/2)
0 2 4 6 8 10 12 14 16 18
K
/
(
Ep
x D
h
3 )
0.0 5.0e-9 1.0e-8 1.5e-8 2.0e-8 2.5e-8
σ
/
E
p
0.0000 0.0002 0.0004 0.0006 0.0008 0.0010 0.0012 0.0014 0.0016 0.0018 0.0020
K / (Epx Dh 3
)
[image:38.595.120.479.94.328.2]σ / Ep
Fig. 11. Normalized energy of the piston and the normalized maximum principal stress in the
39
Ra / Dh
0.00 0.01 0.02 0.03 0.04 0.05 0.06
σm
/
E
p
0.000 0.002 0.004 0.006 0.008 0.010 0.012
Numerical results
[image:39.595.125.472.90.341.2]Fitted function: σm / Ep = 0.0003 x (Ra / Dh)-0.539
Fig. 12. Influence of normalized arc radius at the bottom of the hole on the normalized largest
40
Dw / Dh
0.2 0.4 0.6 0.8
tm
/
(
Dh
x
ρp
1
/2
x
Ep
-1
/2 )
0 2 4 6 8 10 12
σm
/
Ep
0.000 0.001 0.002 0.003 0.004 0.005 0.006 0.007
Numerical results: tm / (Dh x ρp1/2 x Ep-1/2)
Numerical results: σm / Ep
[image:40.595.119.478.92.330.2]Fitted function
Fig. 13. Influence of normalized water depth on the normalized largest principal stress in the
41
t / (Dhxρp1/2x Ep-1/2)
0 2 4 6 8 10 12 14 16 18
σ / E p 0.000 0.001 0.002 0.003 0.004 0.005 K / ( Ep x D h 3 ) 0 2e-7 4e-7
6e-7 σ / Ep
K / (Epx Dh3)
Fig. 14(a)
t / (Dhxρp1/2x Ep-1/2)
0 2 4 6 8 10 12 14 16 18
σ /
E p 0.000 0.001 0.002 0.003 0.004 0.005 K / ( Ep x D h 3 ) 0 2e-7 4e-7
6e-7 σ / Ep
K / (Epx Dh3)
[image:41.595.116.482.95.655.2]Fig. 14(b)
Fig. 14. Normalized kinetic energy of the piston and the normalized maximum principal
42
Lp / Dh
0.2 0.4 0.6 0.8
tm / ( Dh x ρp 1 /2 x E p -1 /2 ) 0 2 4 6 8 10 12 σm / E p 0.000 0.001 0.002 0.003 0.004 0.005 0.006 0.007
Numerical results: tm / (Dhxρp1/2x Ep-1/2)
Numerical results: σm / Ep
[image:42.595.120.478.93.327.2]Fitted function:σm / Ep = 0.0064 x (Lp / Dh)0.3453
Fig. 15. Influence of normalized piston length on the normalized largest principal stress in the
43
t / (Dhxρp1/2x Ep-1/2)
0 2 4 6 8 10 12 14 16 18
K / ( Ep x D h 3 ) 0 2e-7 4e-7 6e-7 8e-7 1e-6 σ / E p 0.000 0.002 0.004 0.006 0.008
K / (Epx Dh3)
σ / Ep
Fig. 16(a)
t / (Dhxρp1/2x Ep-1/2)
0 2 4 6 8 10 12 14 16 18
σ / E p 0.000 0.002 0.004 0.006 0.008 K / ( Ep x D h 3 ) 0 2e-7 4e-7 6e-7 8e-7 1e-6
σ / Ep K / (Epx Dh3)
[image:43.595.111.486.90.707.2] [image:43.595.115.487.95.359.2]44
t / (Dhxρp1/2x Ep-1/2)
0 2 4 6 8 10 12 14 16 18
σ
/
E
p
0.000 0.002 0.004 0.006 0.008
K
/
(
Ep
x
D
h
3 )
0 2e-7 4e-7 6e-7 8e-7 1e-6
σ / Ep K / (Epx Dh3)
[image:44.595.120.478.95.364.2]Fig. 16(c)
Fig. 16. Normalized kinetic energy of the piston and normalized first principal stress in the
45
Vp / (ρp-1/2x Ep1/2)
0.000 0.005 0.010 0.015 0.020 0.025
σm
/
E
p
0.000 0.002 0.004 0.006 0.008 0.010
Numerical results
[image:45.595.122.472.93.349.2]Fitted function: σm / Ep = 0.3654 x (Vp / (ρp-1/2x Ep1/2))
Fig. 17. Influence of normalized initial velocity of the piston on the normalized largest
46
Kp / (Epx Dh3)
0.0 5.0e-7 1.0e-6 1.5e-6 2.0e-6 2.5e-6 3.0e-6 3.5e-6
σ m
/
E p
0.000 0.002 0.004 0.006 0.008 0.010
Changing Lp Changing Rh
[image:46.595.121.477.122.387.2]Changing Vp
Fig. 18. Influence of normalized initial kinetic energy of the piston on normalized largest