The 20th Annual Conference of the Association for Chinese
Economic Studies Australia (ACESA)
30 Years of Economic Reforms in China:
Retrospect and Outlook
Airline Consolidation and its Market Power Implication
on China Eastern’s Business Routes: A Simple
Difference-in-differences Analysis
Yahua Zhang
Airline consolidation and its market power implication on China
Eastern’s business routes: a simple difference-in-differences analysis
Yahua Zhang* * School of Accounting, Economics and Finance University of Southern Queensland
Toowoomba, QLD 4350, Australia Email: [email protected]
Abstract:
After a careful explanation of the evolution of China’s airline industry, this paper looks at the airfares of China Eastern Airlines on its key business routes out of Shanghai with the purpose of detecting any market power that it might have developed following the 2002 airline consolidation, using a simple difference-in-differences approach. The results in this study do not reveal any serious market power exercised by China Eastern in 2003.
Keywords: Consolidation, market power, airline
1. Background for China’s airline industry1
People travelling to China or within China may be familiar with the names of Air China, China Southern and China Eastern, as well as the names of some smaller regional carriers. But not many people know that these names were created only about 20 years ago. Before that, they operated under the same brand name but without any real
individual identity. Until the late 1990s most of these new airlines, which emerged from the monolithic Chinese government-owned carrier CAAC, had failed to establish a brand image and develop a favourable reputation among consumers. However, in the late 1990s, strong competition between them surfaced as a result of deregulation of China’s airline markets, and each individual airline had the opportunity, and indeed faced the commercial necessity, to determine its own pricing policies and to design its own development strategies (Zhang and Round 2008).
A striking feature of China’s airline industry is the robust growth in traffic in recent years, measured either by passengers carried, cargo handled, or total traffic volume. For example, the annual growth in passenger traffic was more than 10% from 1999 to 2005, except for 2003 (due to the SARS pandemic). Cargo traffic has increased more than 8% each year in this period, except for 2001 (probably due to the 9/11 attack in the US, which caused a decline worldwide).2 Nevertheless, China’s airline markets are far from mature. The huge population of China and its improving living standards will result in boom conditions for the aviation industry for the foreseeable future.
However, from day one of the birth of these airlines, internal and external changes have continued, including changes in organisational structures, ownership structures, and regulatory policies. These have been driven and influenced by the country’s economic policies and the constant changes in the airline industry worldwide. The most recent significant extensive change was the airline consolidations that occurred in October 2002, resulting in the creation of three major airline groups (Air China, China Southern and
1
Some of the materials in Section 1 and 2 are developed based on Zhang and Round (2008, 2009).
China Eastern). All these changes reflect the dynamic nature of the airline industry worldwide.
Among the changes, relaxation of the Chinese government’s control of airfares in 1997 might have been the most influential in shifting the way that the carriers compete. As a result of this deregulation, airfares in general became more flexible and cheaper, and more consumers were attracted to air travel. Other forms of deregulation in the last decade, including ownership conditions and entry to and exit from markets, have also brought continuous benefits to consumers, and have put significant competitive pressure on all carriers. However, this trend towards relatively deregulated airline markets in China has not been accompanied by the presence of any effective antitrust laws to govern the carriers’ behaviour, nor of any forceful antitrust authority to investigate potentially anticompetitive behaviour or mergers. The 2002 airline mergers took place without any antitrust challenge, and since then the major carriers have frequently engaged in collusive price agreements with no threat of prosecution in China’s airline markets.
The interesting thing is that China’s airline markets have attracted the attention of many international major carriers, but have failed to attract the attention of academics to any great extent. Literature on China’s airline markets remains relatively sparse. This paper seeks to explore the impact of the 2002 airline consolidations on China Eastern Airlines’ pricing on some important business routes using the difference-in-differences approach. The next section will give some details about China Eastern’s history, and then we look at changes in market concentration on some routes out of Shanghai in Section 3. The difference-in-differences model is presented in Section 4 and Section 5 reports the regression results, followed by concluding remarks.
2. China Eastern Airlines
groups by the Chinese government in the early 1990s. The China Eastern Group not only operated businesses connected with aviation-related areas such as passenger and cargo services, postal delivery, ground handling services and maintenance services, but also non-aviation activities in import and export, real estate, advertising, financial services, catering and tourism. In April 1995, China Eastern Airlines was converted into a corporation by the restructuring of the China Eastern Group. Assets and liabilities relating to aviation as well as some equity interests went to China Eastern Airlines Co. Ltd (hereafter CEA). Its parent company, renamed Eastern Airline Group and holding the state-owned shares, engaged in non-airline-related businesses such as real estate
investment and futures trading. China Eastern was publicly listed in Hong Kong, New York and Shanghai in 1997.
The acquisition of China General Aviation Corporation, China Great Wall Airlines and Wuhan Airlines extended China Eastern’s operating areas from East China provinces to the northern provinces of Shanxi and Hebei and the central province of Hubei. Its networks, centred in Shanghai and radiating to the whole country, link China to Asia, Europe, North America and Australia.
Eastern Airline Group was replaced by China Eastern Air Holding Company (hereafter, CEA Holdings), which was founded on 11 October 2002 after the acquisition of China Northwest and China Yunnan. The names of the two new members were changed to China Eastern Northwest Company and China Eastern Yunnan Company, respectively. As a result of the consolidation, CEA Holdings had total assets of 47.3 billion Chinese yuan (US$5.9 billion) with a fleet of 142 aircraft providing services on 386 routes (in October 2002).
Integration in other areas had been instituted soon after the establishment of CEA Holdings. At a meeting in February 2003, CEA Holdings required its members to implement “five unifications”: unification in aircraft deployment and network design; in operating manuals; in market strategy; in logo, code, services and training programs; and in aircraft maintenance and aircraft parts purchases (Yang and Qi 2004). From March 2003, all domestic and international flights of the new members within CEA Holdings adopted CEA’s carrier code “MU”. From the beginning of 2003 individual logos on planes were gradually replaced by CEA’s logo. Two A300s from China Eastern Northwest and two CRJsfrom China Eastern Yunnan were deployed to the Shanghai market, which implied that the airlines in the group had begun to coordinate the use of their resources. From 8 August 2003, all three airlines jointly adopted a new frequent flyer program called “Eastern Miles” with joint promotion policies implemented since the second half of 2003 (Zhang and Round 2009).
3. CEA’s market share in the main markets out of Shanghai
Before looking at CEA’s market share, one issue associated with Shanghai airport must be clarified. Shanghai has two airports: Hongqiao and Pudong. Hongqiao has been a domestic-only airport since 2000, while Pudong has accommodated both domestic and international flights since then. In this study, I will treat the two airports as one and assume that they have no influence on customers’ choice. Besides considerations of convenience, the main reason is that it was the government that decided which flight should depart from which airport in the past few years and such decision changed from time to time subject to lobbying by the interested parties.
share and HHI at its main base, Guanzhou, also increased but to a lesser extent. However, in general, CSA is more dominant at its base than is CEA at Shanghai, according to the market share variable. This suggests that other airlines also have a relatively significant presence at Shanghai airport, which could be a constraint on CEA’s ability to exercise market power.
Table 1 Market shares of CEA and CSA and HHI at Shanghai and Guangzhou respectively
Market Share (%) HHI
2002 2003 2004 2002 2003 2004
CEA at
Shanghai
27 36 38 1533 2209 2362
CSA at
Guangzhou
48 54 51 2701 3351 3086
Note: calculated by author based on airline frequencies
We now look in Table 2 at CEA’s market shares on the ten most heavily travelled routes out of Shanghai. It appears that its market shares increased on most of the routes in 2003 and 2004, but most of them are below 40%. In the same time period, the HHI on these routes also showed an increasing trend, but not in a dramatic way except for Xiamen. Given the nature of the airline industry where the presence of carriers on a route is small in number, these changes in market share and HHI can be said to be moderate.
Table 2 Market share of CEA and HHI on 10 main routes out of Shanghai
Market Share (%) HHI
Shanghai
to 2002 2003 2004 2002 2003 2004
Beijing 49 41 42 3327 3391 3314
Xiamen 23 30 56 3221 3130 4398
Dalian 13 19 13 3938 4792 5065
Tianjin 21 27 36 2572 2713 2722
Guangzhou 21 27 36 2572 2713 2722
Chengdu 8 10 21 2686 3123 3116
Wuhan 18 39 47 3034 3493 3711
Shenzhen 23 28 25 2448 3041 2593
Chongqing 24 18 26 3358 2707 2612
Note: calculated by author based on number of seats offered by all airlines on a given route.
4. Methodology and data for detecting market power on the three most important business routes
Most of the heavily-travelled routes presented above have a high percentage of business travellers. However, for CEA and many other airlines, Shanghai to Beijing, Shanghai to Guangzhou and Shanghai to Shenzhen are the three most important business routes. This study will examine any market power effects in these three markets given their
comparable group, is so called because mergers did not take place on the routes flown in this group.
In this study, tourist routes from Shanghai to Sanya, Haikou, Wuyishan, Guilin,
Zhangjiajie and Huangshan were chosen as control group. Tourists tend to have a more elastic demand than business travellers. Therefore, a low fare is expected for the markets in and out of these cities owing to the high ratio of leisure to business passengers. The fact that market power is less likely to be present on tourist routes has been confirmed in numerous studies for other countries (for example, see Windle and Dresner 1995 and Lee and Luengo-Prado 2005).
The effectiveness of oligopolistic coordination also depends upon the degree of buyer concentration. A strong buyer can take advantage of its bargaining power to gain price cuts by threatening to redirect orders from one seller to another. Instead of providing a steady flow of small orders, buyers can break collusion by grouping them into large and infrequent orders to induce suppliers to deviate from their collusive strategy (Snyder 1996). In the airline industry, travel agents can stimulate competition among airlines in this way.This is particularly the case in some large cities in China where a few big travel agents control the main sales channels and have greatly influenced the pricing strategies of the airlines. Although reluctant, airlines have had to grant additional commissions as well as deeper price cuts to these agents. Therefore, it seems to be the norm that prices on tourist routes are suppressed to competitive levels.
was ready to step into the World Trade Organisation (WTO) to embrace the market economy, CAAC’s re-regulation measure was bound to be short-lived. A mere one month later, CAAC allowed group discounts on tourist routes from Hainan. The policy of re-regulating airfares was completely abandoned in 2001. This example clearly shows that even government-supported cartels cannot survive in the presence of very elastic demand. Therefore, it is unlikely that the consolidation would have any market power implications for tourist routes and accordingly they can serve as the control group.
On the contrary, for the business routes mentioned earlier where demand is relatively inelastic, price-fixing is likely to occur for the reason that they are the most important source of many airlines’ revenue. It has been revealed in other recent research by the author, as yet unpublished, that airlines with sales offices in Shanghai frequently engaged in collusive agreements, especially on the route from Shanghai to Guangzhou.
Unfortunately, these collusive agreements were often short-lived due to the lack of effective enforcement measures. Given these facts, it is expected that prices on business routes would be higher following the airline consolidation, if market power in fact existed.
The two time periods considered are 2002 and 2003. Although the consolidation
agreements were formally declared on October 2002, the actual merger activities did not start until early 2003 as noted previously. The DD model can be expressed as
airfare = β0 + β1y2003 + δ0business + δ1y2003*business + other factors + μ
where airfare is CEA’s monthly average fare on a given route, and y2003 is a dummy for the second period, which captures aggregate factors that would cause changes in airfares even in the absence of the consolidation. Business is a dummy and measures the business route effect not due to the consolation. The interaction term 2003*business is also a dummy variable equal to one for those observations in the treatment group in the second period.
The DD estimator δ1is of interest. A positive and significant δ1 may suggest possible
existence of market power in the treatment group (business routes) while a negative result may imply that market power is not serious (note we are cautious not to claim that no market power exists).
Other factors include route Herfindahl-Hirschman Index (HHI), route distance, quarterly and SARS dummies. These factors thought to influence airline pricing are included to reduce the error variance and to control for factors that might have been systematically different in 2003 than in 2002 following Kiel and McClain (1995).
Airfare data for the business routes and tourist routes come from CEA’s financial
department statistics. The average airfare is calculated as the monthly airfare revenue on a given route divided by the number of passengers carried. Taxes are excluded. Owing to the unavailability of traffic data for all the airlines, the route market share has to be
calculated with the available seat numbers by checking the timetables for Chinese carriers for the frequency of each airline and the type of aircraft used for each flight. This was also the method used by Lijesen, Rietveld and Nijkamp (2004), who studied European airline markets where output measures were not available on a route level. In fact, some studies have found that using either the number of flights or the number of passengers in a market as a basis for market concentration calculation generates similar results (see Bailey, Graham and Kaplan 1985; Borenstein 1991 and Stavins 1996). The use of capacity to construct market share can also be justified in the case where load factors are roughly equal for all the carriers present on a route. My interview with the sales managers of the big airlines in China confirmed that the seats available on each airline should reflect their share of the market. Based on the market shares calculated above, the HHI for each route can be computed by the sum of the squares of the shares of each firm in the market.
Prices in the SARS period (May and June 2003) were extremely high because all businesses and individuals cancelled unnecessary travel.
5. Estimation results
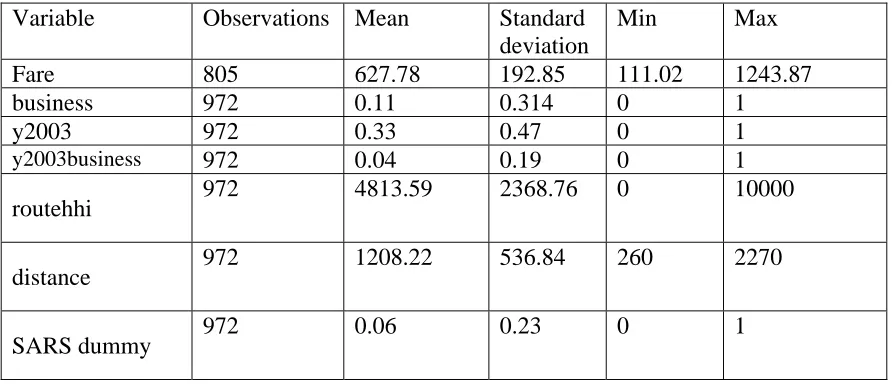
[image:12.612.84.530.257.449.2]The descriptive statistics for the main variables in the regression can be found in Table 3. The average airfares in 2002 and 2003 for treatment group and control group are reported in Table 4. It can be seen that the prices on business routes dropped significantly by 52 yuan while little change occurred on tourist routes.
Table 3 Descriptive statistics of the main variables.
Variable Observations Mean Standard deviation
Min Max
Fare 805 627.78 192.85 111.02 1243.87
business 972 0.11 0.314 0 1
y2003 972 0.33 0.47 0 1
y2003business 972 0.04 0.19 0 1
routehhi 972 4813.59 2368.76 0 10000
distance 972 1208.22 536.84 260 2270
SARS dummy 972 0.06 0.23 0 1
Table 4 Average fares in 2002 and 2003.
2002 2003 Change t value
Business routes (treatment group)
839.1 786.7 -52.3 -2.94
Tourist routes (control group)
607.6 609.6 2.1 0.11
problem, the robust standard error was reported.3 The coefficient of the interaction term is statistically significant, suggesting a significant drop in prices on business routes by an average amount of 84 yuan in 2003 following the airline consolidation. This is consistent with the general findings by Zhang and Round (2009) who systematically examined the price effects of the 2002 mergers using a different approach with large samples. The results also show that business route airfare is much higher than that on tourist routes on average, even in 2002. The coefficient of year 2003 dummy is insignificant, meaning no obvious change in price on all the routes from 2002 to 2003.
The coefficients on some of the other variables provide interesting results. For example, the negative sign of route concentration is consistent with the finding of Evans and Kessides (1991), showing a weak relationship between route concentration and airfares, i.e., route-level dominance does not confer much market power on the airlines. During the SARS period prices were extremely high as the airlines understood the inelastic demand of those who had to travel during this unusual time when most other travelers cancelled their travel. The results also show the airfares in the fourth quarter were significantly lower, which is contradictory to the western world where the Christmas season usually pushes up airfares.
3
Other model specifications, such as using log form and using yields (fares divided by route distance)
instead of using absolute fares for the dependent variable were tried, but there was no obvious model fit
Table 5 DD model regression results
Variable Coefficient Robust standard error
Constant 362.8*** 22.81
business 227.5*** 14.14
y2003 -9.5 9.22
y2003business -83.9*** 22.81
routehhi -0.008*** 0.002
distance 0.28*** 0.01
SARS dummy 157.8*** 29.76
Q2 -9.7 12.14
Q3 -19.3* 11.60
Q4 -28.5** 11.36
observations 805
Adjusted R2 0.66
***significant at 1% level; **significant at 5% level; *significant at 10% level.
6. Concluding remarks
are a significant source of revenue for many domestic airlines. It is not surprising that many airlines have continuously increased frequencies and opened up new routes to this city. As a result, although headquartered in Shanghai, CEA does not command absolute dominance at its base. In this context, the airfares on the three business routes showed a declining trend following the airline consolidation, suggesting evidence of strong competition. The fact that CEA did not acquire any significant market power may partly explain its poor financial performance in the last few years (the worst of the big three). Instead, in the years following the consolidation, competition on many routes involving the Shanghai market remained strong, and price wars broke out regularly on many of them. There have been frequent calls in recent years for a merger between CEA and Shanghai Airlines to improve CEA’s competitiveness.
Route concentration variables were found to be statistically significant with a negative sign. However, the magnitudes were rather small in commercial terms. This might provide the evidence that contestable markets theory still holds to some extent in the airline industry. Apart from actual competitors, any potential entrants that coveted the Shanghai market could become effective competitors whose entry subsequently constrained the prices that CEA could charge.
References:
Bailey, E. E., D. R. Graham, and D. P. Kaplan. 1985. Deregulating the Airlines. Cambridge: MIT Press, Cambridge.
Borenstein, S. 1991. “The Dominant-Firm Advantage in Multiproduct Industries: Evidence from the US Airlines.” Quarterly Journal of Economics 106: 1237–1266.
China Civil Aviation Statistics 2006. China Civil Aviation Press, Beijing.
Fischer, T., and D. R. Kamerschen. 2003. “Measuring Competition in the US Airline Industry Using the Rosse–Panzar Test and Cross-sectional Regression Analyses.”
Kiel, K. A. and K. T. McClain. 1995. “House prices during sitting decision stages: The case of an incinerator from rumour through operation.” Journal of Environmental
Economics and Management 28: 241–255
Kim, E. H., and V. Singal. 1993. “Mergers and Market Power: Evidence from the Airline Industry.” American Economic Review 83: 549–569.
Lee, D., and M. J. Luengo-Prado. 2005. “The Impact of Passenger Mix on Reported ‘Hub Premiums’ in the US Airline Industry.” Southern Economic Journal 72: 372–394.
Lijesen, M. G., P. Nijkamp, and P. Rietveld. 2004. “Do European Carriers Charge Hub Premiums?” Networks and Spatial Economics 4: 347–360.
Meyer, B.D. 1995. “Natural and Quasi-Experiments in Economics”, Journal of Business
and Economic Statistics, 13(2), 151-61.
Stavins, J. 1996. “Price Discrimination in the Airline Industry: The Effect of Market Concentration.” Federal Reserve Board Boston Series. Paper No.96–97.
Simpson, J. and D. Schmidt. 2007. “Difference in Differences Analysis in Antitrust: What Does it Really Measure?” Available at SSRN: http://ssrn.com/abstract=984540.
Singal, V. 1996. “Airline Mergers and Multimarket Contact.” Managerial and Decision
Economics 17: 559–574.
Snyder, C.M. 1996. “A Dynamic Theory of Countervailing Power”, RAND Journal of
Werden, G. J., Andrew S. Joskow, and Richard L. Johnson. 1991. “The Effects of Mergers on Price and Output: Two Case Studies from the Airline Industry.” Managerial and
Decision Economics 12: 341–352.
Windle, R. J., and M. E. Dresner. 1995. “The Short and Long Run Effects of Entry on U.S. Domestic Air Routes.” Transportation Journal 35: 14–25.
Wooldridge, J. M. 2006. Introductory Econometrics: A modern Approach, 3rd Edition, Thomson South-Western.
Yang, R. and Qi, M. 2004. “The Reason for Baotou Air Crash”, 21st Economy Report, 24/11/2004
Zhang, Y., and D. K. Round 2008. “China’s airline deregulation since 1997 and the driving forces behind the 2002 airline consolidations”, Journal of Air Transport Management, 14(3), 130-142.
Zhang, Y., and D. K. Round 2009. “The effects of China’s airline mergers on prices”,