Publications of the Astronomical Society of Australia
http://journals.cambridge.org/PASAdditional services for
Publications of the Astronomical Society of Australia:
Email alerts: Click here Subscriptions: Click here Commercial reprints: Click here Terms of use : Click here
The Active Algol Binary KZ Pavonis
E. Budding, S. C. Marsden and O. B. Slee
Publications of the Astronomical Society of Australia / Volume 18 / Issue 02 / January 2001, pp 140 - 147 DOI: 10.1071/AS01028, Published online: 05 March 2013
Link to this article: http://journals.cambridge.org/abstract_S1323358000003027
How to cite this article:
E. Budding, S. C. Marsden and O. B. Slee (2001). The Active Algol Binary KZ Pavonis. Publications of the Astronomical Society of Australia, 18, pp 140-147 doi:10.1071/AS01028
P u b l i s h i n g
For editorial enquiries and manuscripts, please contact: The Editor, PASA,
ATNF, CSIRO, PO Box 76,
Epping, NSW 1710, Australia Telephone: +61 2 9372 4590 Fax: +61 2 9372 4310
Email: [email protected]
For general enquiries and subscriptions, please contact:
Volume 18, 2001
© Astronomical Society of Australia 2001
Publications of the
Astronomical Society
of Australia
Publ. Astron. Soc. Aust., 2001, 18, 140–147
The Active Algol Binary KZ Pavonis
E. Budding
1,2, S. C. Marsden
3and O. B. Slee
41Central Institute of Technology, PO Box 40740, Wellington, New Zealand
2Carter Observatory, PO Box 2909, Wellington, New Zealand
3Centre for Astronomy and Atmospheric Research, Faculty of Sciences,
University of Southern Queensland, Toowoomba, Queensland, Australia [email protected]
4Australia Telescope National Facility, Vimiera & Pembroke Roads,
Marsfield 2121, NSW, Australia [email protected]
Received 2000 May 3, accepted 2001 April 20
Abstract: The Algol type eclipsing binary KZ Pav has been observed over one complete orbit (0.95 days) with the Australia Telescope Compact Array. Contemporaneous optical photometric data from the University of Southern Queensland’s Observatory at Mount Kent were also collected and have been included in this multi-wavelength study.
Preliminary indications are that the low levels of emission observed share similarities to those of some RS CVn binaries. The optical data show phase-linked effects which can be related to the mass transfer process of Algols. The possibility that the radio emission may be related to this process is considered.
Keywords: stars: activity — stars: coronae — binaries: close — stars: individual (KZ Pavonis) — radio continuum: stars — techniques: miscellaneous
1 Introduction
Microwave emission has been observed with large radio telescopes from a few dozen Algols and RS CVn binaries with periods of several days. The flux density correlates with rotation rate (Slee & Stewart 1989) and is related to strong magnetic fields in convective outer envelopes and consequent gyrosynchrotron emission (Owen, Jones & Gibson 1976; Dulk 1985). This is generally associated with the cool subgiant components. Both RS CVn and Algol systems contain such subgiants, though the evolu-tionary states of Algols and RS CVns are quite different. The subgiants in RS CVn binaries have expanded beyond the main sequence, but not yet reached the surrounding ‘Roche-lobe’ (cf. Popper & Ulrich 1977). Algols, how-ever, are already into an era of mass transfer, where the subgiant sheds matter from its Roche-lobe filling surface (cf. Lubow & Shu 1975).
The Algol type, eclipsing binary star KZ Pavonis (=HD 199005; RA 20 h 58.6 m, dec −70◦ 25 [2000],
Vmax = 7.71) is some 99 pc distant from the Earth
(HIPPARCOS), and has an orbital period of 0.9499 d. It consists of a mid-F type dwarf, of mass 1.2M, sepa-rated a little over 5Rfrom a mid-K type subgiant. The main parameters are summarized in Table 1 (cf. Walker & Budding 1996). The system’s net brightness variation is about 0.6 magnitudes inV. It has been detected previously with the ATCA at a level of about 0.4 mJy (cf. Stewart et al. 1989; Walter, Hering, & De Vegt 1990). It has relatively low mass compared with most better known Algols, and may resemble the R CMa subgroup (Kopal 1959; Budding 1989). There is also at least one lower-brightness com-panion within a few arcseconds of the optical position
(Kholopov 1987; Chambliss 1992). It appears to be at an early stage of semi-detached life, so that the inter-binary stream is still relatively vigorous, entailing possible obser-vational consequences (cf. Budding, Slee & Jones 1998a). The measured rate of period increase over recent decades verifies the scale of such interaction.
[image:3.842.318.498.632.770.2]Recently, Gunn et al. (1999) have studied flux varia-tions of the Algol system V505 Sgr, which they related to an intercomponent emission region. Uncovering source structure is a key aim in their work. The spatial inci-dence of Algols is, however, generally less than that of RS CVns, so that observed Algol radio fluxes tend to be less than those from RS CVns. Consequently, the available information for studying Algol emission geometry is less. Budding et al. (1998a) found weak indications of a max-imum detectability of Algols at orbital phase∼0.4. That study was based on isolated observations, mainly from
Table 1. Astrophysical Parameters of KZ Pav
Parameter Value
Primary (F6V) LuminosityL1 3.6L
Secondary (K4IV) LuminosityL2 1.5L
Primary MassM1 1.2M
Secondary MassM2 0.8M
Primary RadiusR1 1.50R
Secondary RadiusR2 1.66R
Primary TemperatureT1 6500 K
Secondary TemperatureT2 5000 K
Orbital inclinationi 86.0◦
SeparationA 5.05R
Abs. Mag. (system)MV 2.31
The Active Algol Binary KZ Pavonis 141
Parkes (e.g. Slee et al. 1987), covering most orbital phase ranges.
The present small multi-site, multi-wavelength cam-paign, planned in mid-1998, involved the ATCA and photometric facilities of the University of Southern Queensland in an effort to probe this potentially active binary. Orbital-phase-related data were sought to clarify comparisons with RS CVn binaries, or distinguish any factors reflecting the particular Algol status, as well as retrieve an accurate astrometric position.
2 Observations
We were granted 24 hrs of continuous ATCA time in August 1998.1There are six 22-m dishes in the ATCA, accurately mounted on an east-west baseline. They can be arranged at appropriate separations to obtain specific angular resolutions at preassigned microwave observa-tion frequencies (for further instrumental details cf. e.g. Manchester 1991). A double C-band experiment was car-ried out, i.e. we employed two adjacent 128 MHz bands at 4.848 and 4.976 GHz, which were co-added to improve the signal-to-noise properties of the observations. The full 6-km array with 6 antennas was used. High angular resolu-tion was desirable for KZ Pav, both to get a good posiresolu-tion and to rule out confusion over possible emission from close-by companions. The ATCA data covered slightly less than one complete orbital cycle in a continuous run.
Combining such observations with temporally close optical data is effective for physical interpretation. Photometric data were arranged from the Mount Kent Observatory of the University of Southern Queensland, Toowoomba, and were gathered over the period August– September, 1998.
2.1 Radio Data
ATCA observations started at 02 h 12 m UT on August 28, 1998 and continued until 23 h 00 m UT on August 29. The discrete source PKS B 0823–500 provided primary cali-bration of the flux levels at 4.848 GHz and 4.976 GHz. The high declination source PKS B 2146–783, conveniently placed for phase calibrations, was observed for 4-minute integrations, before 25-minute dwell times on KZ Pav. Excellent phase stability within ±2◦ was maintained throughout the observations.
The ATCA data were conveniently handled on-site using the MIRIAD data reduction package (Sault & Killeen 1996). The full available instrumental bandwidth for these microwave ranges is 128 MHz. Our processing procedure made use of the ‘birdie’ option in the MIRIAD routine ATLOD, which permits 13×8 MHz independent, interference-free, non-overlapping channels to be used for either band, summing to 104 MHz of total bandwidth. The flux levels used to construct the light curves dis-cussed in what follows were read from uncleaned sky
1The Australia Telescope National Facility is operated by the CSIRO.
1
[image:4.842.328.558.78.341.2]2 3
Figure 1 A cleaned 4.80-GHz MIRIAD field map of the region around KZ Pav constructed from 41 25-min cuts equally spaced over a 22 hour angle range. The observation was centred on 20 h
58 m 40.8 s;−70◦2536, but the map is here off-centred to show
the two outlying sources in Table 2. The restoring beam of 3.2×2.7
in position angle 87.3 degrees is indicated by the small filled ellipse at the bottom left corner.
maps produced from the recorded visibility data via the MIRIAD data-reduction suite.2
We concatenated the UV data from both IF bands and then produced a clean map of a large area around the posi-tion of KZ Pav. The rms variaposi-tion over the cleaned map was close to the theoretical value of 22µJy/beam. This map (Figure 1) shows three clear radio sources including KZ Pav (source No. 2). The measurements are summarised in Table 2. Each source was fitted with a 2-dimensional elliptical Gaussian superposed on a linear baseline, from which positions, flux densities (background subtracted) and angular sizes at the mean frequency of 4.912 GHz were determined. All three sources were unresolved. The position errors in the fitting are 0.05 s in RA and 0.14in dec., while flux densities have a formal error of∼0.04 mJy. Our measured position for KZ Pav may be compared with that of the HIPPARCOS catalogue, i.e. (1998.75) RA 20 h 58 m 40.119 s; dec−70◦2519.80.
An enlarged extract of the field about KZ Pav is shown in Figure 2. The digital sky survey was searched for optical identifications for sources 1 and 3, but no coincident objects were found above the plate limit ofmJ =22.0. The formal error of 0.06 mJy in each of the two IF bands is too large to enable a useful measurement of the radio
2H. Anderson set up the MIRIAD software on UNIX-running computers
142 E. Budding et al.
Table 2. Radio sources in the KZ Pav field: Gaussian fit positions and flux densities
Source No. Position 1998.75
RA dec Flux density (mJy)
4.912-GHz
h m s ◦
1 20 58 04.89 −70 24 44.2 1.52
2 20 58 40.09 −70 25 19.8 0.17
3 20 58 27.96 −70 21 25.1 0.64
Source No. 2 is KZ Pav, Aug 28, 1998. Position errors are∼0.5 arcsec.
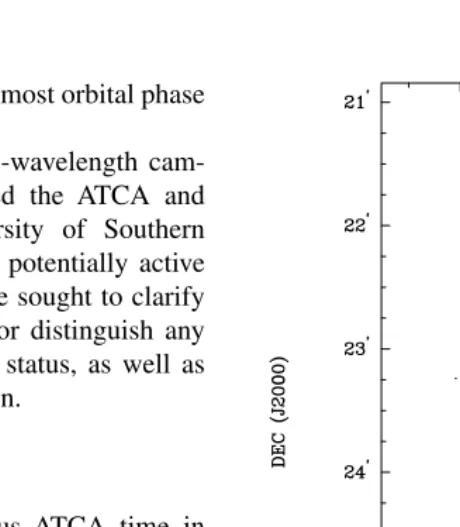
Figure 2 A close-up of the KZ Pav image at higher scale. Contours are at 3, 5, 7.7, 10, 12.5 and 15 times
the basic unit of 0.01 mJy per beam. The rms noise level over the clear area of the map is 20µJy per beam.
spectral index over the 128 MHz frequency separation of the two bands.
2.2 Flux Density versus Orbital Phase
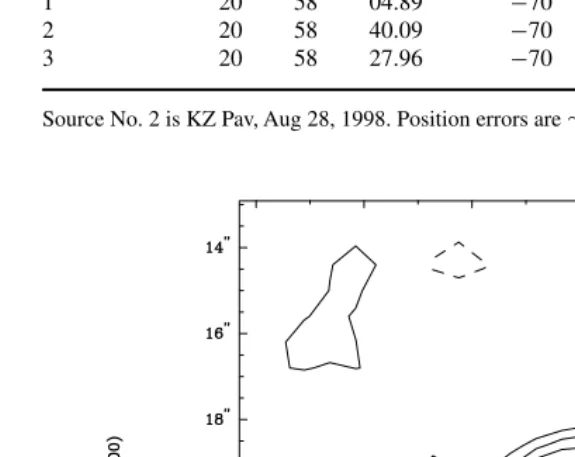
Microwave raw data on KZ Pav, covering the whole orbital phase range in the 4.8480 and 4.976 GHz bands, consisted of 41 individual MAXFIT (from MIRIAD) evaluations of the 25-min integrations. Flux densities, carefully derived from both ‘peak’ and ‘profile’ fitting techniques to point source images, were found to be not greater than 1 mJy in either frequency band during the run, and values of around 0.3 mJy, including background sky noise, were typically measured. Noise levels for the summed data sets are about 0.08 to 0.12 mJy in both bands, increasing with the atmos-pheric air mass. More information about this preliminary data was presented previously (Budding et al. 1998b). Signal levels in these original data sets were too weak to allow useful detailed analysis, however, and we concen-trate on longer time interval integrations in what follows (cf. Figure 3, which shows the co-added data and 1σerror bars).
The combined data curve (Figure 3), with 2-hour integrations, shows some enhancement centred around phase 0.7–0.8, a tendency to drop thereafter, and a fur-ther, briefer increase around phase 0.3. The same general trend is visible in the two separate contiguous C–band data sets, co-added to produce Figure 3 (cf. Budding et al. 1998b). The co-added flux densities have 1σ errors ranging between 70 and 100µJy/beam. Figure 3 shows noticeable enhancements at orbital phases 0.14–0.34 and 0.60–0.80.χ2testing of the conformity to a uniform dis-tribution in phase of the combined flux values, about their mean (Table 3), shows non-uniformity to be significant at about the 20% level, based on Poissonian error val-ues. In other words, the evidence for phase dependence of the apparent variation is not very persuasive: such non-uniformity would occur about once in five trials if of purely random origin.
[image:5.842.140.428.230.459.2]The Active Algol Binary KZ Pavonis 143
0.05 0.1 0.15 0.2 0.25 0.3 0.35 0.4 0.45
0.2 0.4 0.6 0.8 1 1.2 1.4
4.91 GHz flux density
[image:6.842.174.463.86.282.2]Orbital phase KZ Pav 29 Aug 1998
Figure 3 The 4.848 and 4.93 GHz flux densities have been combined and summed over∼2 h ranges and plotted against orbital phase. The resulting data points are shown together with error bars corresponding to the data in Table 3.
Table 3. Data points for the co-added C-band light curve of KZ Pav
Mean time (h) Peak Fitted RMS
2.989 0.317 0.309 0.101
4.921 0.153 0.141 0.085
7.049 0.147 0.146 0.074
9.185 0.283 0.273 0.070
11.181 0.273 0.266 0.069
13.301 0.278 0.280 0.069
15.263 0.203 0.191 0.069
17.222 0.205 0.206 0.072
19.175 0.170 0.178 0.078
21.135 0.289 0.280 0.094
have an emitting area of about 5×10¹⁷m2. At a distance of 99 pc, a flux enhancement of 0.1 mJy corresponds to a full luminosity of about 1.2×10⁸W/Hz at the source.
Dividing this source emission by the foregoing area, we derive a mean brightness temperature of about 2.7×10⁹K. Such a brightness temperature is typical of the emission generation scenarios of gyrosynchrotron radiation from mildly relativistic electrons in moderate magnetic fields (Dulk 1985), such as are posited for RS CVn-like stars. Further details for this kind of source were given by Budding et al. (1999) for CF Tuc. In the case of CF Tuc, this emission scenario was supported by contemporaneous optical effects, indicating large-scale active regions on the subgiant.
2.3 Optical Photometry
KZ Pav was observed at the University of Southern Queensland’s Mount Kent Observatory, using the 40 cm Webb telescope and SBIG ST6 CCD camera (cf. Waite 1999) equipped with a standard V filter. Observations from eight nights, between 29 August 1998 and 30 September 1998, were used. The comparison and check
stars used were HD199190 and HD198971, respectively (cf. Walker & Budding 1996). Walker & Budding’s (1996) photometric calibrations of these stars were adopted for the present reductions. The light contribution of the companion star was retained in the tabulated tudes. Walker & Budding (1996) estimated the magni-tude and colour of this companion as V=8.144 and
B−V=0.513, and corrected their light and colour curves accordingly.
The photometric data were analysed using the DAOPHOT routines of IRAF (cf. Stetson 1998). No significant variations between the comparison and check stars were found for any of the nights. In order to determine the changes in photometric conditions during the course of observations, the comparison star’s data were fitted with a cubic polynomial for each night. The standard devia-tion of the comparison star data to the fitted polynomial was less thanV=0.015 magnitude for data accepted as reliable. This polynomial was then subtracted from the KZ Pav magnitudes, to remove any spurious variations during the observations. If the comparison star data were found not to be monotonically increasing or decreasing during the course of a night, or if this data could not be satis-factorily fitted by the polynomial (due to variations from either dew or cloud), then the data were rejected as ‘non-photometric’. In this way, two complete nights of data and parts of another three nights were rejected. A total of 569 individual data points for KZ Pavonis were then left for analysis.
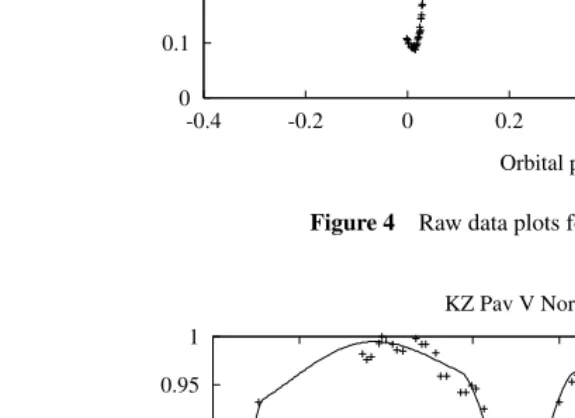
In the IRAF reduction procedure observation times (accurate to±1 second) were converted to Heliocentric Julian Dates, and the phase-folded light curve (Figure 4) produced, using the ephemeris:
Min I=2444431.7546+0.9498768E (1)
[image:6.842.90.295.366.495.2]144 E. Budding et al.
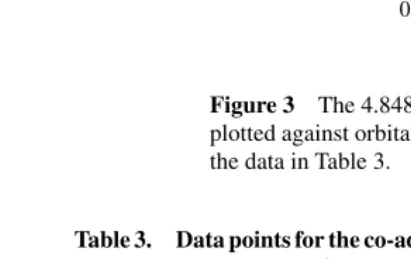
0 0.1 0.2 0.3 0.4 0.5 0.6 0.7 0.8
-0.4 -0.2 0 0.2 0.4 0.6 0.8 1
Delta mag (V)
[image:7.842.141.427.83.284.2]Orbital phase KZ Pav V Aug/Sep 1998
Figure 4 Raw data plots for KZ Pav inV.
0.55 0.6 0.65 0.7 0.75 0.8 0.85 0.9 0.95 1
0 50 100 150 200 250 300 350 400
Relative flux
Orbital phase KZ Pav V Normal points
Figure 5 ILOT curve fit to the optical (V) data set (normal points) of KZ Pav.
The light curve shows the following general features: (a) two well-defined minima; (b) the light curve is not quite complete in a region just after primary eclipse; (c) the eclipse minima occur somewhat later than the ephemeris predicts; (d) the secondary minimum is slightly asymmet-ric; (e) there is rather a large scatter in the data just after secondary eclipse, and some suggestion of a depression before that eclipse. There is no convincing evidence of any large-scale maculation effect. The low excursion around phases 0.35–0.42, for example, has an amplitude of not more than 0.01 magnitude (cf. also Figures 5 & 6), i.e. about the 1σ level for the standard model curve-fitting (Table 4).
2.4 Optical Light Curve Analysis
The light curve, prepared with phases and differential magnitudes corresponding to the foregoing information, was subsequently binned into 75 ‘normal’ points for
[image:7.842.137.425.312.521.2]The Active Algol Binary KZ Pavonis 145
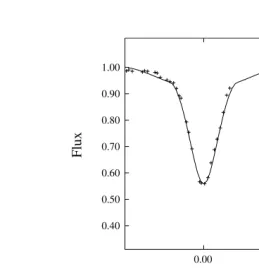
0.00 0.25 0.50 1.00
0.90 0.80 0.70 0.60 0.50 0.40
Phase
[image:8.842.192.451.81.354.2]Flux
Figure 6 Binary Makercurve fit and corresponding model representation of the semi-detached binary KZ Pav.
Table 4. Light Curve Fitting Results for KZ Pav
Parameter Value Error
Reference magnitude m0 7.740 0.004
Fractional luminosities L1 0.36 0.03
L2 0.14 0.03
L3 0.50 0.05
Fractional radii r1 0.285 0.01
r2 0.298 0.01
Inclination of orbit i(deg) 85.0 0.9
Phase correction θ0(deg) −4.4 0.5
Limb-darkenings u1 0.52
u2 0.75
Effective wavelength λ(nm) 550
Goodness of fit χ2(l=0.01) 74.0
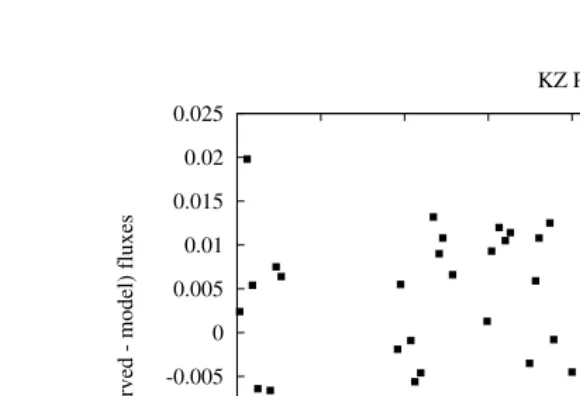
The differences between observed points and the theoretical model are shown in Figure 7. Any system-atic trends in such differences are difficult to make out against what looks like scatter at the 0.01 magnitude level. If we suppose that this scatter contains effects such as maculation from e.g. low latitude spots, such varia-tion would imply active regions of projected radius∼6◦ if set against the whole system light. However, the sec-ondary component, on which such active regions are expected to be located, accounts for only 14% of the system light. Spot radii of up to∼16◦could therefore exist on that star (i.e.0.3×its radius) without there being unambiguous evidence of their presence in the optical domain.
3 Discussion
For the previously cited case of CF Tuc (Budding et al. 1999) spot radii were found to be∼16◦. Even if such spots were present on the active component of KZ Pav, which is not established, they would not be optically distinct, as argued above. In the radio region, however, the amplitude of the main variation for CF Tuc was∼2 mJy, i.e. an order of magnitude greater than for KZ Pav, resulting in the corresponding difference in radio brightness temperatures of the two systems. While we thus cannot rule out a low level of microwave flux from the cool secondary of KZ Pav due to RS CVn-type gyrosynchrotron emission, there may be other effects at play in the special context of Algols (Gunn et al. 1999).
The previously demonstrated Algol status of KZ Pav (Walker & Budding 1996) is confirmed in the light curve solution of Table 4, which essentially repeats the main results of Walker & Budding (1996). The irregularities of the second half of the light cycle may perhaps be associated with mass transfer. Walker & Budding (1996) interpreted thus the delayed minima of the binary, and, using reasonable estimates for key quantities, obtained a value ofP /P ∼ 10−10 for the current rate of period variation.
[image:8.842.81.303.421.569.2]146 E. Budding et al.
-0.025 -0.02 -0.015 -0.01 -0.005 0 0.005 0.01 0.015 0.02 0.025
0 50 100 150 200 250 300 350 400
(Observed - model) fluxes
[image:9.842.137.427.85.283.2]Orbital phase KZ Pav
Figure 7 Difference between observations and optimal model fit. Note the systematic enhancement around
phase 300◦(≈0.8).
that of the foregoing period, therefore, the period has increased by 0.0000032 days, or P /P ≈ 10−10 for the current rate of period variation. This variation ties in reasonably well with the conservative Case B model considered previously by Walker & Budding (1996).
In such a regime one may write, for the mass transfer rate
˙
m1/m1= −3ηs/(R1[1+6η(1−2x)/(1−x)
−0.27η/f (x)]), (2)
wherem˙1is the rate of mass loss of the mass-losing star,
of massm1,ηis the density of the surface layer of the
mass-losing component as a fraction of its mean density,
R1 is the mean radius of this star,x is the value ofm1
expressed in terms of the mass of the entire system,f (x) is the formula for the mean relative radius of the Roche lobe (cf. Plavec 1968), ands is the rate of expansion of the mass-losing component. If we substitute in the appro-priate numbers, as in Walker & Budding (1996), we find a representative mass loss rate of 1.9×10⁻⁸Mper year.
Considering the potential energy that the transferred mass picks up in dropping from the inner Lagrangian point L1(∼2.7Rabove the primary’s centre) to the
sur-face of the primary,∼0.3Gm˙1m2/r2, we would thence
infer a figure of about 0.15L, or 5.5×1025W. The sys-tematic enhancement in Figure 7 at around phase 300◦ (∼1% of the 5L of system light, cf. Table 1) that can be associated with this transferred energy in the visible range of the spectrum, would thus be about 30% of the available power. The optical data can thus be seen as reasonably self-consistent if, instead of appearing as as a direct, black-body-like emission from the photospheric impact region (‘hot spot’), an appreciable fraction of the transferred mechanical energy of the stream is transferred into dissipative processes in plasma accreting around the hot spot’s vicinity.
It is feasible that the small peak in the radio emission around phase 0.8 is associated with energy release pro-cesses related to such mass transfer, but, in view of the low significance of the radio flux variation with phase, it is unrealistic to develop details from the present evidence.
4 Conclusions
The ATCA light curves presented, covering slightly less than one complete orbital cycle at 4.848 and 4.976 GHz in one continuous run, show a definite level of emission at around 0.2–0.3 mJy above the background sky level. There is a slight indication of some real phase-dependent vari-ation, but the low intensity data sample is also consistent with a more or less uniform level of emission with phase. Phase-related effects are supported by a small, but not very significant, correlation between the 4.848 and 4.976 GHz data sets. If real, there would be one main enhancement, rising in a quasi-symmetric manner to about 0.1 mJy above the background, over the phase range 0.5–0.9 and peaking at phase 0.7.
The existence of the weak emission is suggestive of the gyrosynchrotron mechanism, as is often associated with RS CVn-like stars. However, the possibility of some sep-arate emission effects peculiar to the Algol condition, and different to that of RS CVns, cannot be ruled out. This point calls for continued detailed studies of these classes of stellar radio source as data improve in quality and quantity.
Acknowledgements
EB acknowledges the support of the CIT’s Research & Scholarship Committee in supporting the observational visit to the Australia Telescope.
References
Banks, T., & Budding, E. 1990, Ap&SS, 167, 221
The Active Algol Binary KZ Pavonis 147
Budding, E. 1993, An Introduction to Astronomical Photometry, (Cambridge: Cambridge University Press)
Budding, E., Slee, O. B., & Jones, K. L. 1998a, PASA, 15, 183 Budding, E., Jones, K. L., Slee, O. B., & Gunn, A. 1998b, Occ. Paper
Ser. CIT, Central Institute of Technology, New Zealand, No. 13 Budding, E., Jones, K. L., Slee, O. B., & Watson, L. 1999, MNRAS,
305, 966
Chambliss, C. R. 1992, PASP, 104, 663
Dulk, G. A. 1985, Ann. Rev. Astron. Astrophys., 23, 169
Gunn, A. G., Brady, A., Migenes, V., Spencer, R. E., & Doyle, J. G. 1999, MNRAS, 304, 611
Kholopov 1987, General Catalogue of Variable Stars, (Nauka: Moscow), 1987
Kopal, Z. 1959, Close Binary Systems, Chapman and Hall, London and New York.
Lubow, S. H., & Shu, F. H. 1975, ApJ, 198, 383 Mallama, A. D. 1982, PASP, 94, 987
Manchester, R. 1991, Advances Space Res., 11, 403
Owen, F. N., Jones, T. W., & Gibson, D. M. 1976, ApJ, 210, L27 Plavec, M. 1968, Adv. Astron. Astrophys., 6, 201
Popper, D. M., & Ulrich, R. K. 1977, ApJ, 212, L131
Sault, R., & Killeen, N. 1996, Multichannel Image Reconstruction, Image Analysis and Display (MIRIAD) — Users Guide, ATNF, CSIRO
Slee, O. B., et al. 1987, MNRAS, 227, 467
Slee, O. B., & Stewart, R. T. 1989, MNRAS, 236, 129 Stetson, P. B. 1998, Bull. CHFT, 38, 1
Stewart, R. T., Slee, O. B., White, G. L., Budding, E., Coates, D. W., Thompson, K., & Bunton, J. D. 1989, ApJ, 342, 463
Waite, I. 1999, The Active Young Solar-Type Star PZ Tel, MPhil Thesis, University of Southern Queensland, Australia