Theses Thesis/Dissertation Collections
7-6-2016
Examining the Differences in After-Sale Service
Quality Perceptions between Managers and
Customers in the Automobile Industry and Their
Impact on Customer Satisfaction
Mohamed Al Hammadi
Follow this and additional works at:http://scholarworks.rit.edu/theses
This Master's Project is brought to you for free and open access by the Thesis/Dissertation Collections at RIT Scholar Works. It has been accepted for inclusion in Theses by an authorized administrator of RIT Scholar Works. For more information, please [email protected].
Recommended Citation
Examining the Differences in After-Sale Service
Quality Perceptions between Managers and
Customers in the Automobile Industry and Their
Impact on Customer Satisfaction
By
Mohamed Al Hammadi
A Capstone Project Submitted in Partial Fulfillment of the Requirements
for the Degree of Master of Science in Service Leadership and
Innovation
Department of Service Systems
College of Applied Science and Technology
Rochester Institute of Technology-Dubai
Dubai, United Arab Emirates
Committee Approval:
Abstract
The purpose of this study was to explore how service managers and their customers
perceive the after-sale service quality provided by automobile service centers in the United Arab
Emirates (UAE), with a goal to identify the existence of gaps, if any, between their perceptions
and how they can impact customer satisfaction level. A qualitative phenomenologicalmethod
was implemented to gather a description of the participants’ actual experiences, and data were
collected using semi-structured interviews with seven service mangers and 20 customers. The
structure of the managers’ interview questions was designed to go beyond identifying the most
important factors that customers insist on having and focus on the methods that managers use to
gather customer data, the obstacles that prevent meeting customers’ needs, frequent customer
complaints, and the effectiveness of aligning managers’ and customers’ perceptions to increase
customer satisfaction. The questions used to interview customers were also designed to collect
in-depth feedback regarding how they evaluate service managers’ understanding of their needs
and how that can have a crucial impact on their future transactions. Existing literature on the
same topic did not fully address the issues of having different perceptions between service
managers and customers. The findings of this study endorse the need for service managers to
discover the hidden and underestimated customer requirements that prevent them from having
aligned perceptions between both parties. This study makes an important contribution to the
literature by expanding and enriching the existing knowledge of the after-sale service quality in
Table of Contents
List of Tables ... 7
Introduction ... 8
Problem Statement ... 10
Significance and Contributions of the Project ... 11
Literature Review... 12
Service Quality ... 13
After-Sale Service Quality ... 14
Perceived Quality ... 15
Customers’ Perception of After-Sale Service Quality ... 15
Managers’ Perception of After-Sale Service Quality ... 17
After-Sale Service Quality and Customer Satisfaction ... 18
Methodology ... 20
Research Questions ... 20
The Qualitative Research Paradigm ... 21
The Phenomenological Research Design ... 22
Interview Research Design ... 23
The Researcher’s Role ... 26
Setting ... 27
Sample ... 27
Event ... 28
Processes... 28
Ethical Considerations ... 29
Data Collection Strategies ... 30
Data Analysis Procedures ... 32
Verification ... 35
Evaluation and Outcomes ... 36
Results and Interpretations ... 37
Section 1... 38
Part 1: Service Managers’ Perception of Post-Sale Service Quality ... 38
Theme number 1: Managers perception of the customers’ common needs. ... 39
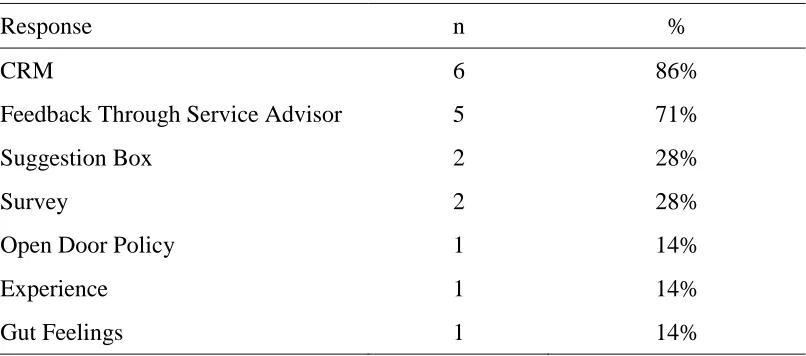
Theme number 2: Methods managers use to identify customers’ needs. ... 44
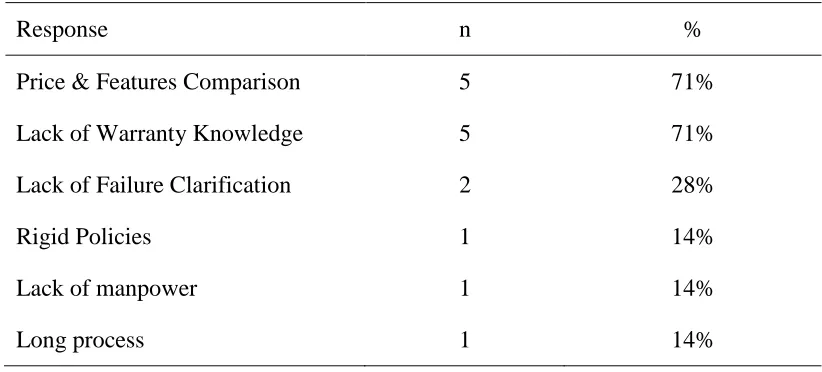
Theme number 3: Factors preventing managers from meeting customers’ needs. ... 50
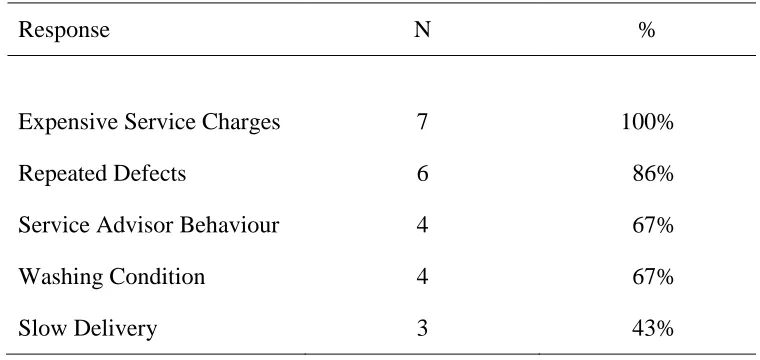
Theme number 4: Common customer complaints from service managers’ perspectives. .... 54
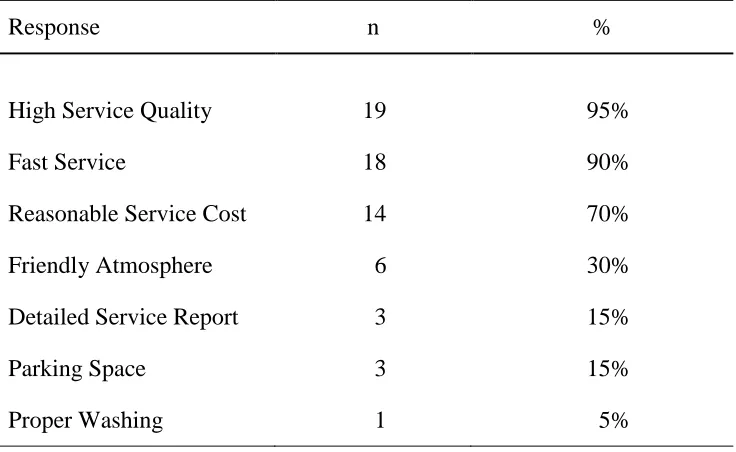
Theme number 5: Customers’ expectations of the after-sale service quality. ... 57
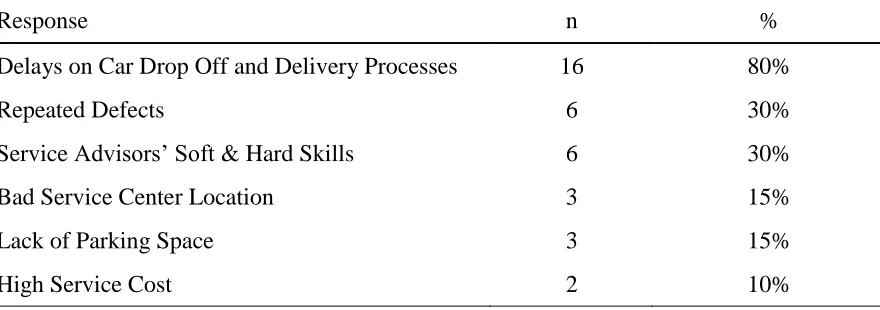
Theme number 6: Frequent customer complaints. ... 63
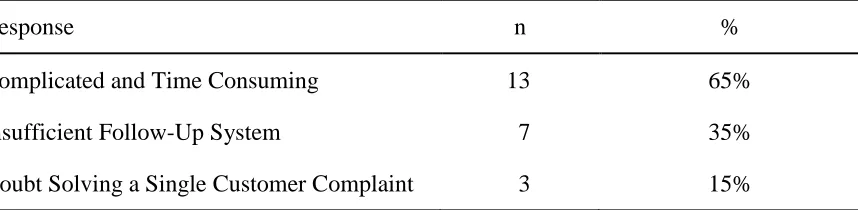
Theme number 7: Reasons for not complaining to the service centers’ management. ... 67
Section 2... 71
Part 3: Cross Comparison of Managers’ and Customers’ Perception of the Post-Sale Service Quality ... 71
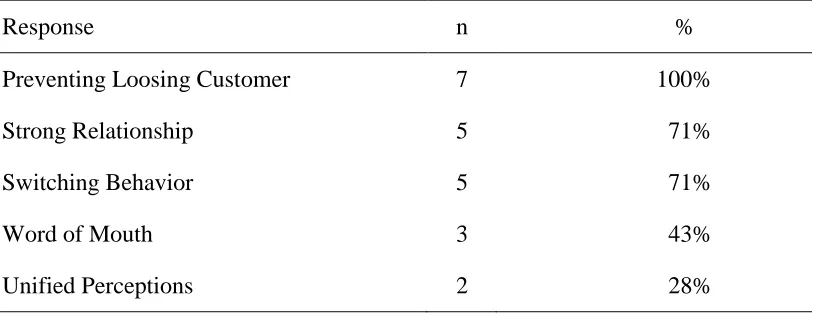
Theme number 8: The importance of customers’ satisfaction. ... 72
Theme number 9: Customers’ evaluation on the managers’ understanding of their various needs. ... 78
Conclusion ... 87
Recommendations for Future Research ... 103
Limitations of the Study ... 104
References ... 106
Appendix I ... 113
Appendix II ... 114
List of Tables
Table 1 Theme Number 1: Managers’ Perception of the Customers’ Common Needs 44
Table 2 Theme Number 2: Methods Managers Use to Identify Customers’ Needs 49
Table 3 Theme Number 3: Factors Preventing Managers from Meeting Customers’ Needs 53
Table 4 Theme Number 4:Common Customers Complaints from Managers’ Perception 57
Table 5 Theme Number 5: Customers’ Expectations of the After-Sale Service Quality 62
Table 6 Theme Number 6: Frequent Customer Complaints 68
Table 7 Theme Number 7: Reasons for Not Complaining to the Service Center’s Management 71
Table 8 Theme Number 8: The Importance of Customers’ Satisfaction 78
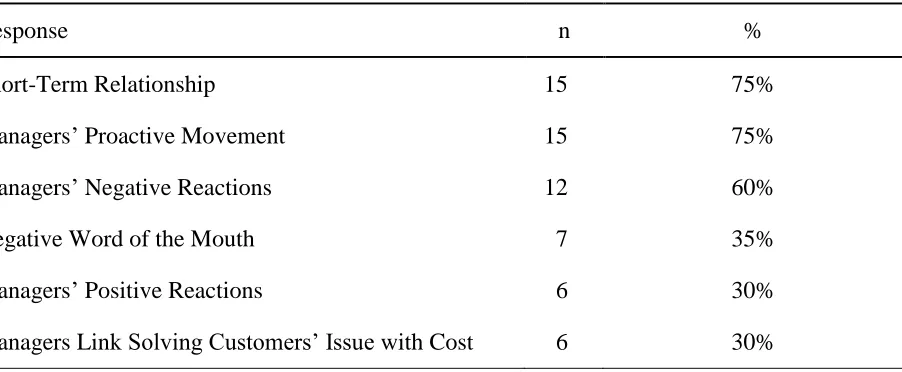
Table 9 Theme Number 9: Customers Evaluation of the Managers’ Understanding of Their
Introduction
Recently, many service centers have shared the concern of providing quality in their
manufacturing organizations. Although these service sectors (including automobiles) took slow
steps toward recognizing the effect of quality (Pakdil & Harwood, 2005), they have come to
realize how important it is for them to ensure a sustained competitive market position (Kuei,
1998).
Growth in the automobile industry is highly dependent upon factors such as economic
conditions, flexible financing terms, and favorable government and consumer purchasing power
polices (Khan, 2010). These factors and more are strongly presented in a competitive market like
the one in the United Arab Emirates (UAE). According to the United Arab Emirates Autos
Report-Q4 2014, issued by Business Monitor International (BMI, 2013), car sales raised to 20%,
to 199,277 sold units, compared to 166,290 units in the same period of time in 2013.
Nowadays, all automobile dealers strive hard to extend their relationships with their
customers after completing their cars sales transactions. They do this through offering after-sale
services, which include providing on-time feedback on customers’ various inquiries, offering
superior maintenance packages with irresistible prices, and managing their warranty systems
(Lin, Chen, & Chiu, 2010). The after-sale services can only show be effective in building
long-term relationships if they are designed to fulfill customers’ varied requirements, which drives
customers toward being highly satisfied. But what most sales managers cannot understand or
sometimes negate is the role that a high level of satisfaction can play in optimizing their
customers’ value in the long run (Elliott & Serna, 2005). Therefore, it is important for managers
perceived and judged by their customers (Andaleeb & Basu, 1994) so that they can have a
unifying understanding between them and their customers.
Determining a specific method to identify the most significant service attributes that have
the most effect on customers’ behavior will continuously be viewed as a challenge. There are
multiple and complex factors resulting from the rapid change in technology (Shammot, 2011).
For example, in order for customers to save the time they normally would spend waiting at the
service center, it is perceived as crucial by these customers to have an online option to book their
upcoming maintenance. On the other hand, it could be viewed as a non-value-added option to
other customers—especially by those who are less inclined to use technological features.
Parasuraman, Zeithaml, & Berry (1985) argued that service centers find it difficult to ascertain
what aspects contribute the most in being perceived as high quality to customers and what is the
required level for those aspects to be delivered in high quality services.
It is critical for managers to have a comprehensive understanding and an effective service
analysis of the after-sale services provided by their automobile service centers. They should
design their perception of service quality based on the customers’ perceptions. Grönroos (1988)
stated that “when the service provider understands how the clients evaluate its services, it can
identify how to manage these evaluations and how to influence them in a desired direction” (p.
10). The diverse perceptions between managers and customers is the main reason why
organizations do not have the proper information that can be used to solve the service quality
dilemmas (Gowan, Seymour, Ibarreche, & Lackey, 2001).
The main reason for this research project was to investigate the relationship between how
customers perceive quality, or the after-sale services provided by the automobile service centers
if any gaps exist between the two perceptions. The existence of these gaps is highly linked to the
level of customer satisfaction. Therefore, the research obtained results that can be utilized by
automobiles service center managers to identify gaps in their current after-sale service processes
in order to implement any corrective that is action needed that, in turn, would lead to stronger
customer satisfaction.
Problem Statement
Automobile service centers have no less involvement than other retailers in strong market
competition, which forces many of these centers to offer attractive after-sales promotions as a
serious step toward improving their relationship with their customers and enhance their
customers’ level of satisfaction. For example, Ford UAE offers free tinting as a part of their
value proposition (Cooper, 2003). Al Tayer Motors, a Range Rover distributor, offers 60,000 Km
or 3 years’ free warranty, whichever comes first, on major parts (Cooper, 2003). Al Nabooda, an
Audi and Porsche distributor, and Al Arabiya, a Nissan Dubai and North Emirates distributor,
launched multiple new and modern service centers in various locations so they could be reached
by the majority of their customers (Cooper, 2003).
Although these companies have specified that a huge amount of their yearly budget is to
be utilized on different after-sale services-improvement areas, the researcher observed that they
still had many customers who perceived the quality of their after-sale service was not what they
expected, and they expressed dissatisfaction through various non-written and/or written
complaints. For example, the researcher noted, from a friendly chat he had with the customers
while visiting these service centers, that most of the customers perceived the cost of services as
too high and unreasonable. Others complained that the service advisors had weak skills in
during his visits that some customers had gone back to the service centers immediately after the
required service was performed, and they complained that they had the same problem that they
originally informed the service advisor about, and the problem still had not been fixed. Also, the
researcher witnessed a huge argument over the lack of communication between the service
advisor and the call center, which is the organization responsible for notifying the customers by
short message service (SMS) or phone call, as soon as the car reaches the delivery stage. In some
cases, customers went to the service center after receiving a notification SMS or a call, and they
became frustrated after discovering that their cars were not repaired and not ready to be collected
by them. Other customers were irritated by the service cycle time, stating that it needs to be
revised and reduced due to the long time it currently takes for repairs.
Service managers might be aware that these issues that have been occurring for an
extended period of time. The question that is significant is why have there been no corrective
actions taken? Is that because service managers do not see these issues as serious issues as the
customers do? Is it because the service managers have not prioritized these issues as urgent
matters that need to be fixed? All of these questions highlight the importance of investigating the
existing after-sale service-quality process that is provided by these companies to establish an
improvement plan to recover the existence of any negative impact on their customers.
Significance and Contributions of the Project
The quality of the automobile after-sale services provided to customers is highly
associated with their level of satisfaction, and quality can be used to control the customer
behavior of switching to other brands. For example, Arabian Automobiles (Nissan) declared a
market share loss over 2012 in favor of its strongest competitor, Al Futtaim (Toyota), allowing
convince customers to accept a certain level of service quality, especially in today’s competitive
market environment; customers always put high expectations on the type of services they
receive. Their common response to defective service is what Keaveney and Parthasurathy (2001)
referred to as “churn,” where customers of a certain type will move to a competing brand
because the competitors convince the customers that they are the better service providers.
Losing market share is an indication of loss in profit and revenue. Therefore, this research
project is designed to improve the quality of the after-sale services provided by the automobile
service centers through detecting any gap that is generated from the perception differences
between customers and service managers. Previous literature highlights how important it is for
managers to understand what is important for their customers and take that information as a
starting point to set up the various necessary processes that aim to fulfill customers’
requirements.
The results of this research project will benefit service centers managers in:
1. Highlighting the most significant factors affecting customers’ satisfaction.
2. Perceiving these factors as important to them as they are for their customers.
The results will also help automobile companies to be prepared for the future when
customers will expect these companies to know all of their requirements without addressing
them. This would address new challenges for service managers because they would not have any
space for defective service delivery.
Literature Review
There are various types of literature in different sectors, such as healthcare and
hospitality, that highlight the relationship between the discrepancy of the customers’ and
satisfaction. On the other hand, there are limited studies related to the automobile sector. Most of
the results indicate a strong relationship between both perception and the level of customers’
satisfaction, which are highly dependent upon how much the perceptions align together
Service Quality
Service quality is becoming one of the critical success factors in providing competitive
advantages in the current era (Edvardsson, 2005; Rust, Zahorik, & Keiningham, 1995). It has a
strong influence in multiple factors such as customer satisfaction (Amin, Yahya, & Aniza, 2013),
intentions (Hooper, Coughlan, & Mullen, 2013; Srivastava & Sharma, 2013), and value
perception (Wu, 2013).
Different researchers have different views toward service quality. Berry, Parasuraman, &
Zeithaml (1988) referred to service quality as the obtained results from comparing special
customer requirements with performance after utilizing that service. Parasuraman, Zeithaml, &
Berry (1994) stated that customer perception can be identified after the customer purchases the
service. Zeithaml and Bitner (2000) linked service quality with long-term customer evaluations
of service. Others, such as Kandampully (1997), perceived service quality as being intangible in
nature. Therefore, providing a sufficient level of service quality in environments, such as
automobile maintenance services, has a certain level of complexity, and there is unfair customer
judgment due to the technical nature of automobiles and because customers are not regularly
involved in evaluating and monitoring the repair process of their cars as it relates to the detailed
knowledge that service providers possess.
Service from automobile service providers concerning the mechanical repair of an
automobile is completely different from guest services provided by hotels, where customers can
Grönroos (1984) supported technicality involvement by dividing service quality into technical
and functional quality.
After-Sale Service Quality
Omotuyi and Zairi’s (1996) definition of after-sales service fit properly in fulfilling the
purpose of this research project. They defined it as “all activities geared towards maintaining the
quality and reliability of the car carried out after the customer has taken delivery with the goal of
ensuring customer satisfaction” (p. 2).
Many car dealerships in various markets have observed how small the profit margin is if
they only rely on the vehicles sale (Senter & Flynn, 2010). Therefore, they started to include the
after-sales activities, such as maintenance and part sales, to improve their profit and revenue
(Senter & Flynn, 2010). Some authors estimate that the revenue generated from after-sales and
spare parts maintenance services to go beyond the initial purchase by three times (Saccani,
Johansson, & Perona, 2007; Wise & Baumgartner, 1999). Other authors increased the estimation
up to five times (Bundschuh & Dezvane, 2003; Saccani et al., 2007).
Logically, it can be determined that the better the after-sale service quality an
organization provides, the better the organization’s profit; plus, valuable long-term relationships
can be built. There is a strong correlation between the willingness of customers to pay an
increased price and gaining an attractive warranty program with trustworthy after-sales service.
These strengths also could help in the organization achieving sustainable growth (Eagle, Kitchen,
Rose, & Molye, 2003). Godlevskaja, Iwaarden, & Wiele (2011) found that automotive
organizations filled the gap on achieving product-based differentiation due to their complexities
Perceived Quality
The National Quality Research Center (NQRC) (2005) highlighted two main factors
when defining perceived quality. The first one is “customization,” which refers to the degree to
which the product or service can fulfill the customer’s desires. The second one is “reliability,”
referring to the ability of delivering these desires to the customer. Other authors, such as Aaker
(1991) and Zeithaml (1988), argued that perceived quality is related to a customer’s judgment
about the service experience, in general, rather than the quality of the brands or products.
Zeithaml, Berry, & Parasuraman (1988) stated that customers judge the quality of the
service based on intrinsic and extrinsic cues. For the automobile companies, the intrinsic cues are
reliability and serviceability, and the extrinsic cues are price, brand name, and brand image.
Perceived quality is strongly associated with the customers’ purchasing decisions; they will
always compare what competitors in the same category are providing while putting the price into
consideration (Jin & Suh, 2005).
Customers’ Perception of After-Sale Service Quality
Customers have always been viewed as the main judge on quality. These ideas were seen
in the early writings of quality gurus, such as Juran and Godfrey (1989), who defined quality as
“fitness for use” (p. 2.2), and Crosby (1979), who defined quality as “conformance to
requirements” (p. 8). Both definitions support the idea that states that “the consumer is the final
authority on quality” (Gowan et al., 2001, p. 276). Clemmer and Sheehy (1992) supported the
same idea stating, “your customers’ perceptions of the value they are receiving must become the
common yardstick against which all activities throughout your entire organization are measured”
Meeting and exceeding customer expectations cannot be better practiced in areas other
than the area of service quality. Many organizations have well understood that the characteristics
quality of service cannot be treated as less important than the physical characteristics of service
(Gowan et al., 2001). Boyet and Conn’s (1991) research results supported the previous statement
when they identified reasons for customers to leave a company when it had nothing to do with
the quality of the product: 20% of the customers suffered from the lack of personal attention,
49% left because of rudeness and unhelpful service, and they concluded that no less than 69%
left mainly because of issues related to service quality. Also, Evans and Lindsay (2002)
estimated that companies lose 35% of their customers on a yearly basis due to poor customer
service. These percentages position companies’ market shares at a serious risk. Customers will
only go back to do business with the same company if they are satisfied with the quality of the
services provided (Gowan et al., 2001). In addition, customers will communicate positively with
others and promote the image of the business through a word of mouth (Wu, 2013).
There have been limited studies conducted on analyzing the perception of customers
toward the service quality provided in the automobile service sectors (Saravanan & Roa, 2007).
Most of the studies were concerned with hotels and the healthcare sectors. The most common
measurement tool, which has been mentioned in many research articles and has been used
effectively to measure the quality of the services provided in various sectors, is SERVQUAL.
The SERVQUAL instrument measures the quality of services along five factors: (a) reliability,
(b) responsiveness, (c) assurance, (d) empathy, and (e) tangibility (Parasuraman, Zeithaml, &
Berry, 1988). Another way to measure service quality by performance is through using
SERVPERF. Although the SERVPERF instrument shares the same dimensions for measuring
have experienced (Palmer, 2001). Sureshchandar, Rajendran, and Anatharaman (2002b)
measured the service quality of the banking sector in India, and Saravanan and Roa (2007)
measured the service quality in the automobile service stations in India and used the five factors
of service quality that they perceived as critically from the customers’ point of view: (a) human
element of service delivery, (b) core service, (c) systematization of service delivery: non-human
element, (d) tangibles of service (servicescapes), and (e) social responsibility. The first study
(Sureshchandar et al., 2002b) indicated that people-oriented issues are more significant to service
quality than technology-related issues, while the second study (Saravanan and Roa, 2007)
indicated that the non-human factors have higher ratings than human factors regarding
perceiving service quality.
Managers’ Perception of After-Sale Service Quality
Since 2001, managers from different sectors have realized that the intangibility of service
has introduced a challenging task due to the high level of interaction between the customers and
the service providers (Gowan et al., 2001). It has become difficult to clarify the needed level of
quality when providing a service. Cottle (1990) described it as being “held hostage by the
client’s cooperation” (p. 49). Some of the high-level service-delivery processes are so difficult to
control by managers because they are not physically present at each transaction. This also allows
the customers to be more familiar with the service process and it is a problem for the managers
(Gowan et al., 2001).
Service managers have always been viewed as the main source for detecting customers’
expectations and requirements; they can do so through deeply perceiving and examining the
current quality of the service offered. Their service quality standard should be built based on the
earlier that management should build their service strategy emphasizing the performance
perceived by customers. The Gowan et al. (2001) study on service quality perceptions among
managers, employees, and customers, which was conducted on a public agency, indicated that
the level of customer perception on service quality is higher than the employees’ and managers’
perceptions of quality. The differences in perception explained by the researchers declared that
managers are more focused on meeting the organization goals and objectives through reasonable
cost, while customers’ emphasis is on having their needs met regardless of the cost. Opposite
results were obtained from Dedeoğlu and Demirer’s (2015) study on the hotel industry where the
managers’ perceptions of service quality are higher than the customers’ perceptions, which also
goes in line with Tsang and Qu’s (2000) study results. They explained the reason for their
findings was because of different organizational aspects such as management techniques, the
laborers are emotionally engaged, and personality characteristics.
The existence of these differences might be because employees and managers do not like
to criticize the quality of the service delivered to the customers (Grandey, 2000). On the other
hand, the customers would not accept any deficiencies in the service that was delivered. Both
scenarios can lead to creating barriers to achieve the favorite level of service quality.
After-Sale Service Quality and Customer Satisfaction
The term customer satisfaction (CS) has been used in the service industry to evaluate
service performance and how well the service center provides the services that are fulfilling
customers’ requirements. Raphel and Raphel (1995) said that the cost of creating new customers
could reach up to nine times more than maintaining existing customers. Yu et al. (2014) pointed
out that it is better to utilize the market resources in maintaining the existing customers rather
5%, that would lead them to obtaining up to 85% profit improvement (Raphel & Raphel, 1995).
High service quality is critical to enhance customer satisfaction and to the increase the
probability of success of the organization (Mao & Zhang, 2012).
Limited studies have measured the effect of time on the relationship between service
quality and customer satisfaction, and the focus was concerning product satisfaction and loyalty
(Mittal, Kumar, & Tsiros, 1999). Oliver (1997) found that there are emotional factors derived
from consuming a service and those emotional factors are highly related to customer satisfaction.
Most researchers measured the quality of service and its effectiveness on customer
satisfaction through the five SERVQUAL dimensions. For example, Wang and Shieh (2006)
found that all of the five dimensions are significant to customers’ satisfaction of an expected
responsiveness. Other researchers, such as Jamal and Naser (2003) and Blodgett and Wakefield
(1999), confirmed that there is no strong relationship between the tangibility dimensions and
customer satisfaction, but Dabholkar, Thorpe, and Rentz (1996) confirmed the opposite. Arasli,
Turan, and Mehtap-Smadi (2005) highlighted the importance of reliability, while Chaniotakis
and Lymperopoulos (2009) disagreed with their conclusion.
Shammot’s (2011) study examining the impact of service quality provided by the Peugeot
Company in Jordan on customer satisfaction used a descriptive, analytical approach in measuring
the level of customer satisfaction for the after-sale maintenance service. The results highlight
three main factors that have significant impact on customer satisfaction, and they are price,
maintenance efficiency, and employee presentation.
Andronikidis’s (2009) study on perceiving service quality in the Greek automotive repair
industry used SERVPERF as a measurement tool. The study results confirmed that the five
study produced three new dimensions: holistic customer consideration, infrastructure, and
empathy.
There are two main outcomes that can be concluded from the above results. The first
outcome is that a customer will be satisfied by a service center if he or she perceives the service
center delivers high quality service. The second outcome is there is no standard measurement
system, attributes, or dimensions that can be used by all firms to measure their customers’
satisfaction levels.
Methodology
Research Questions
The qualitative study requires the researcher to present research questions. Such
questions are not aimed at identifying the specific objectives of the study or hypotheses based on
some variables and statistical tests like the ones that can be found in the quantitative studies.
Alternatively, it aims to explore the general research idea to investigate the related factors around
the main phenomenon and to identify the different perceptions each participant held throughout
formulating a central research question (Creswell, 2014). The central question was defined by
Creswell (2014) as “a broad question that asks for an exploration of the central phenomenon or
concept in a study” (p. 139).
The design of the central question for this study was based on a phenomenological
qualitative research strategy, which differs from other qualitative strategies such as ethnography
research and grounded theory. The questions of the phenomenological research strategy cannot
be formulated based on the information in the existing literature. Instead, it is based on the
expression of the participants for a specific phenomenon or their experience in a certain situation
The researcher for this study used phenomenological processes to document the
perceptions of the after-sale service provided by a number of automobile service managers and
the perceptions of their customers as receivers of the mentioned services. The researcher used
interviews as a method to explore the possibility of having an existing gap between both the
perceptions and how they could affect customers’ satisfaction levels. The central research
questions of this study are:
1. What are the most common factors that impact managers’ and customers’ perception
of the after-sale service quality?
2. How can service managers improve customers’ satisfaction level through determining
their needs?
As suggested by Creswell (2014), the central questions began with the word “what” in
the first question and with “how” in the second question in order to “convey an open and
emerging design” (p. 140). Moreover, both questions included open-ended verbs, such as
“perceive” and “improve,” which tell the reader that the study will describe the core of the
customers’ and managers’ experiences. Furthermore, it focuses on two aspects that are the
quality of the after-sale service and customers’ satisfaction level. Finally, the questions
mentioned the participants who are service managers of automobile service centers and their
customers who were involved in experiencing the provided after-sale service.
The Qualitative Research Paradigm
Quantitative research through questionnaires is the most common method used by
researchers when examining the impact of dissimilar perceptions of service quality between
customers and managers in various sectors. As mentioned previously, the quantitative research
impact on service quality and customer satisfaction. Therefore, and in order to perform a large
and in depth investigation, the qualitative method was used.
Miller (1992) described the characteristics that can be used to distinguish the qualitative
scholarly research from quantitative scholarly research:
Qualitative research fits well with the occurrence of human behaviors and events.
Qualitative research relies on assumptions, while the quantitative research is based on
theory or an hypothesis.
The researcher is the primary source for data collection (Lincoln & Guba, 1985).
Qualitative research data are descriptive.
Qualitative research focuses on perceptions and experiences of participants (Lincoln
& Guba, 1985).
The Phenomenological Research Design
This study followed the phenomenological research method. This design comes from the
field of psychology and philosophy where the researcher describes the participants’ experiences
with a specific phenomenon (Creswell, 2014). The phenomenological research method is the
most appropriate method for studies that require deep examination and further explanation. The
qualitative phenomenological method focuses on everyday phenomena that people live with. It is
useful for obtaining a deep understanding of how a process works or how people evaluate and
describe things (Malterud, 2001). Creswell (2007) stated that applying the phenomenological
research approach helps the researcher to uncover new phenomena that he or she has not
experienced before. The researcher of this present study was interested in exploring how
managers of service centers and their customers perceive the quality of the after-sale services
to fluctuating customer satisfaction levels. Such deep descriptions can be perfectly obtained
through interviews.
Interview Research Design
Qualitative interviewing has become a widely used method in many important areas such
human and social sciences, education, and healthcare (Brinkmann, 2013). Rapley (2001) argued
that qualitative interviewing is the main source for conducting information about society and
social science issues that concern us. Interviewing is used as a sort of conversation to gather
knowledge about the others’ experiences, habits, motivations, and acts (Brinkmann, 2013). An
example of this is Ernest Dichter’s (1960) in-depth interview study about consumer motivation
for buying a car. Besides using observation, focus groups, and case studies as data-gathering
tools, qualitative research studies use interviews with participants as a data-collection method
where the researcher is able to document in his or her own words the participants’ feelings,
attitudes, values, and beliefs about their personal experiences (Brinkmann, 2013). The researcher
uses interviews as the primary research method to gather in-depth and complex data that cannot
be easily obtained through other questionnaire instruments such as SERVQUAL or SERVPERF.
Face-to-face interviews were the main method used for conducting the interviews for this
research study with the service center managers and their customers. The researcher was
planning to use a combination of face-to-face and telephone interviews, which was described by
Shuy (2002) as one of the dominant approaches used within the last 14 years in recent years with
regular customers of service centers because such methods are very useful in explaining “certain
core features of human talk” (Brinkmann, 2013, p. 29). Unfortunately, this researcher did not
conduct telephone interview sessions with customers as a result of some limitations, such as not
In general, the qualitative interviewing method is advantageous over other methods
because when facing the difficulties of the participants, the researcher can observe directly, and
the interviewing method can reveal vital historical information provided by the participates, such
as previous (bad or good) situations that the customer or manager participants experienced while
dealing with past customer complaints or service managers’ behavior. Also, the interviewing
method puts the researcher in control through his or her role of questioning (Creswell, 2014).
Face-to-face interviews are the standard research method for the phenomenological research
approach because the nature of such an approach requires gathering information that is mainly
about human experiences and an individual’s views (Denscomb, 2014). Also, the collection of
the data that are related to these experiences require deep explanation and investigation, which
cannot be better detailed with any other type of data collection methods that does not involve
face-to-face interviews. The desired outcome of the phenomenological research approach can be
fulfilled through face-to-face interviews because the interviewees describe how things were
experienced by those who were involved (Denscomb, 2014). For example, the phenomenological
investigation of something likes customers’ satisfaction toward the quality of the after-sale
services provided by their automobile dealers focuses on the experiences of being satisfied or
dissatisfied with the variety of the after-sale services provided. This method helps the researcher
try to understand how customers judge types of services from their point of view and how they
evaluate or explain the causes of being satisfied or dissatisfied. Moreover, face-to-face
interviews help by providing a description of the authentic experience. Such a description is vital
to undercover the complexity of different situations by dealing with the things in depth without
trying “to gloss over the subtleties and complications” that can be considered as crucial aspects
approach requires a detailed explanation of the experiences that were encountered by the
participants, and face-to-face interviews play a significant role in obtaining such details.
The disadvantages of the qualitative interviewing method are that some critical
information can be filtered through the view of the participant. Moreover, the quality of the
responses might differ due to participants’ having different levels of articulation and perceptive.
Furthermore, the existence of the researcher may bias the responses (Creswell, 2014). For
example, the participants’ responses might be affected by the interviewer’s personality traits,
which means participants might be engaged in in-depth communication with the interviewer who
appears to be friendly by demonstrating high levels of smiling, laughing, and eye contact, which
results in the collection of a greater amount of quality information and responses (McAdams,
Jackson, & Kirshnit, 1984). Also, the interviewer’s presence might bias the participants’
responses if they were to perceive that the interviewer was biased in some why. Such bias could
occur if the participants wrongly understood what the interviewer wanted to hear rather than
what the situation is really like. Additionally, managers, in most cases, do not like to highlight
deficiencies in the quality of the services they provide. In other words, they avoid degrading the
services they are delivering (Dedeoğlu & Demirer, 2015), which highly affects achieving
accurate responses.
In order to minimize the negative effects of the abovementioned biases, the researcher,
first, carefully follows the prepared interview protocol (Appendix I) to ensure having a standard
interview procedure and process in place while conducting all of the interviews activities.
Second, the interviewer has to ensure the same physical-friendly appearance through all of the
interviews in order to establish an appropriate interview environment that helps the participants
technique that the interviewer started with for establishing such a welcoming environment was to
use an ice breaking question. For example, the interviewer started each interview with questions,
such as, “How was your day so far?” or “How was the traffic on your way to work?” Last, the
interviewer made sure that the reason behind the research, in general, and the interview,
specifically, was properly transmitted and delivered to the participants in order to avoid any type
of confusion or fears in responding to the questions. It was critical for the participants to have a
good understand that the main purpose of the research was to enhance and improve their existing
after-sale services that were provided rather than to criticize them.
The Researcher’s Role
As stated before, the researcher is the primary source for the data collection. The
researcher’s perceptions of the after-sale services provided by the automobile companies that
were chosen for this project were shaped by his personal experience. The researcher had been a
customer of some of the dealers that were included in this research and he had several
experiences in evaluating the quality of the services they provided.
As a result of some of these experiences, especially the most frustrating ones, the
researcher could have included biases into this study. Great efforts were made to prevent these
biases from shaping the way the data was collected and interpreted. For example, both interviews
questions (with customer and manager participants) were designed as open-ended questions that
aimed to give the participants enough space to express all of their ideas and thoughts. This
practice prevented the researcher from understanding the problem from one single perspective,
and it also made it much difficult for the researcher to overlook several participants’ answers,
especially the ones that the researcher may not have favored. The researcher worked to avoid
were ready for the interview, the questions were clear enough, and they enough time was given
to the participant to answer each question. In the interpretation process, the researcher made sure
all collected data were fully presented in order to minimize the possibility of results being
omitted. Also, the researcher concluded with what the data was showing without manipulating
the results. The researcher started this project assuming that the automobile after-sale services
included many complex factors that might prevent the service managers from perceiving what
was critical for their customers. The researcher was questioning how aligned were the existing
managers’ perceptions of the after-sale service quality with the customers’ perceptions and what
was the process they are using to identify the most significant factors that had the most effect on
their customers’ satisfaction.
Setting
The service managers’ interviews were conducted at the workshop facilities and
specifically in the managers’ offices. These facilities provided various services, such as
scheduled and non-scheduled maintenance activities, structural repairs, painting, and quick
services where the customers only required an oil change. The customers’ interviews were
conducted in a quiet corner of the customers’ seating area located in the service centers.
Sample
In general, the targeted population of this study was the automobile dealers who were
operating in the UAE and their regular customers. They were familiar with sharing common
features related to the after-sale services they provided. Specifically, the targeted sample of this
study was the service managers who were employed by the best-five automobile dealers in the
UAE in 2014: Toyota, Nissan, Mitsubishi, Hyundai, and Ford (BMI, 2013), and their regular
The manager interview dates and times were scheduled by phone and the objective for the
project was discussed with the participants to clarify the reason behind the interviews. The
customers’ face-to-face interviews were conducted in the customers’ seating area, which was
located in each of mentioned companies’ service centers, after permissions were obtained from
such customers. The second method that the researcher was planning to use was phone
interviews where the researcher requested an access to phone numbers of customers who had
visited the service center regularly, especially those who showed a previous interest when
participating in similar interviews or surveys. The researcher asked for permission to access data
that indicated the level of interaction of the regular customers with previous and similar surveys
or interviews questions, which would have helped to determine and select the proper sample type
needed, but the request was refused by the service managers due to their companies’ customer
privacy policies, which insist on protecting their customers’ private information as they
described it. In both manager and customer interviews, the reason behind the interviews was
discussed and clarified for the participants in order to gain their approval prior to the start of the
interview sessions.
Event
By using an interview research methodology, the focus of the study was to determine
how far managers’ perceptions of after-sale services differ from customers’ perceptions. If a gap
between the perceptions exists, what are the common factors or dimensions that managers do not
detect?
Processes
The interview protocol was developed as a guide to be used during both the managers’
recorded by using digital audiotaping device and handwriting notes as a backup plan to recover
any sudden or unexpected failures with the recording device (Creswell, 2014).
Ethical Considerations
The following ethical interview circumstances were taken into consideration during and
after the interview process:
The purpose of the research was clarified verbally and in writing format and was
handed to the participants for their review.
Permission was asked from the participants for the ability of the researcher to use a
recording device.
The participants were informed that the study results would be available for their
review and implementation as they desired.
Any participant requests or wishes, such as not declaring their names, were taken into
consideration. Including anonymity in the sample size could have positively or
negatively affected how honest the participants might have been in responding to the
interview questions. Complete anonymity could encourage the participants to give
more accurate answers because it could minimize social pressure. An example of
such pressure might result in harming the company’s reputation if the service
manager willingly declared a deficiency in the existing after-sale services provided to
customers. On the other hand, complete anonymity could negatively encourage the
participants to be less accountable and less responsible for their answers. Complete
anonymity could motivate the participants to respond with less detailed and less
honest answers, which, in the end, might affect the research results. Therefore, the
make the participants sense that the accuracy of the research results would depend
highly on the accuracy of their responses. The researcher clarified to the participants
that the main objective of the research was to create an effective, efficient, and robust
after-sale service-quality process that would help in enhancing the customers’ future
experiences and increase automobile industry profits.
Data Collection Strategies
The first part of the data collection was from a total number of seven interviews,
consisting in length of approximately 45 minutes, with service managers who were working for
the previously mentioned automobile dealers. The interview consisted of eight unstructured and
open-ended questions that aimed to stimulate opinions and points of view as the participants
perceived them (Creswell, 2014). The structure of the interview questions (Appendix II) was
based on the information gathered from the secondary data, which was the literature review
information. The questions covered the following core study areas:
How do services managers currently perceive the after-sale service, and how do they
evaluate it?
How do service managers identify the significant dimensions or factors customers
perceive as critical for delivering high quality service?
How do service managers treat customer complaints, and how do they ensure the
complaint will not happen again?
How do service managers shape their perception about the quality of the after-sale
services provided, and what is the customer’s role in that?
What does customer satisfaction mean to service mangers, and how do they evaluate
For the second part of the data collection, there were a total of 20 interviews, which
included face-to-face interviews that lasted approximately 15 to 20 minutes each. The
researcher tried to minimize the interview time with the customers as much as possible so they
would not be delayed in their schedules, which encouraged them to participate. As was the case
with the managers’ interviews, the interview questions for the customers consisted of five
open-ended and unstructured questions (Appendix II) that aimed help with a deep description about
the customers’ opinions on the quality of the after-sale service they usually received. Some of
the customer interview questions were structured based on information obtained from the
literature review, and some were structured by the researcher’s personal effort to explore and
obtain insight regarding the central research question. The questions covered the following
customer areas:
How do customers evaluate the quality level of the after-sale service provided to
them?
What would cause a customer to be unhappy?
What matters the most to the customers, and what could affect their level of
satisfaction?
The researcher developed an interview protocol (Appendix I) as a guide for use during
the interview sessions and for recording the answers for the qualitative interview process. The
researcher used audiotaping and note taking methods to record the participants’ answers. The
note taking process was used as a recovery procedure in case the audiotaping device failed to
function. The manager and customer interview protocol included the following components
A heading: Each service manager’s interview included the date and time that was
scheduled by telephone, including the interviewer’s and interviewee’s names. Each
face-to-face customer interview was conducted in the customer seating area after the
interviewer obtained the required permissions.
The interviewer followed one, standard-procedure written instruction sheet in
conducting all of the interviews (Appendix I), such as using an ice-breaking question
at the beginning of the interview. The interviewer asked the participant how the
traffic was on the participant’s way to work, dropping, or picking up his or her car,
followed by sub questions for the research plan.
One question was designed to help the participants elaborate more or explain their
ideas in further detail.
The answers were recorded and there was also enough space on the one,
standard-procedure written instruction sheet to have written notes for each question.
A log was developed to document all of the collected data for the analysis process.
The log was divided separately, which means the managers’ interview responses were
separated from the customers’ responses in order to create a smoother retrieval
method.
Data Analysis Procedures
The researcher started with extensively transcribing the recorded audio of the managers’
and the customers’ interviews to ensure examining and defining of the main structure of the talk
and to have an implied meaning of each discussion. The researcher intensively prepared prior to
starting the transcribing process. First, Denscomb (2014) stated that it would take several hours
recordings into tasks can be. Therefore, a suitable amount of time, approximately 1 month, was
scheduled for the process, based on the number of the interviews that were conducted and the
length of those interviews. Second, factors such, as the clarity of the recording and typing speed
of the researcher, was also taken into consideration because of their roles in reducing the
transcription time. Third, the transcription page layout was structured in accordance with the
interview transcription requirements. For example, there was sufficient space on the pages for
recording notes clearly, plus there were wide margins on the side of the page that were used for
data coding and classification purposes (Denscomb, 2014). Last, but not the least, Mazza,
Chapman, and Michie (2013) stated that while analyzing the data, the researcher needs to go
over the transcripts more than once. Therefore, the researcher reviewed the interview answers
three times to ensure that all the information was included that was mentioned by the
participants.
Following the proper procedure for transcribing the recorded interviews allows for the
qualitative data to be prepared and organized in a way that makes them amenable to analysis.
First, the researcher started with preparing back-up copies for all of the originally collected data
by storing them in two different locations (laptop hard drive + dropbox) (Denscomb, 2014).
Second, the researcher used HyberRESEARCH software, version 3.7.3, for coding and
categorizing all of the raw data. Using such software helped the researcher have a smoother
navigation process by making it easy to go back and forth over the collected data taking less time
(Denscomb, 2014). Moreover, it helped eliminate errors and contractions that were not relevant
to the main purpose of this study. Furthermore, it allowed the researcher to generate themes
based on grouping and categorizing the data. In addition, the software enabled the researcher to
themes (Creswell, 2007). The managers and customers transcribed interviews where coded as
separate cases in order for the researcher to identify factors that affected each category of
perceptions and to develop the core themes that were relevant to the after-sale service quality.
The coding system was established to help find similar or adjacent words that had been presented
in the interviewees’ answers. The researcher was able to form themes from the participants’
repetitive answers by reading the answers to each question repeatedly to identify the common
issues and points of view that kept occurring.
Gläser and Laudel (2103) stated that the coding process is similar to tagging where the
researcher gives a unique number or letter to the data to allow for a smoother identification
process. Therefore, the researcher assigned each of the interviewed managers’ cases with a
special code starting from “M1,” which referred to the first interviewed manager, until “M7,”
which referred to the last interviewed manager, or in other words, manager number seven. The
same process was followed for coding each of the customers’ cases. The first interviewed
customer was given the “C1” code until the last customer, who was given the “C20” code. Each
of the managers’ and customers’ interviews were entered into the HyberRESEARCH software as
a separate case in order to assign suitable keywords, which helped with creating two lists that
included the common and most repetitive factors that underlined how managers and customers
perceived the level of the after-sale service quality and how determining such factors could help
managers improve their customers’ satisfaction level. The coding process led the researcher to
come up with a list of themes, which were considered the major themes that were identified by
the participants and sub-themes that were listed under each of the identified major themes. These
themes and sub-themes became the core categories for the analysis procedure. They were used to
significantly affect managers’ and customers’ perceptions of the after-sale service quality and
how these factors are directly linked to the customer satisfaction level. In addition, the coding
process included highlighting chunks of text that presented some of the past satisfying or
frustrating experiences that the customers had gone through, which also helped support the
emerging themes founded by the researcher. Also, the data analysis process included comparing
the research findings with the previous literature findings in order to confirm the existence of
supporting relationships between the findings or to address new findings as value-added
information to the research topic that could be viewed in the conclusion section of this paper.
Verification
The following recommend strategies by Creswell (2014) and Denscomb (2014) were
employed to validate and make reliable the data:
Triangulate by collecting the data from different sources. The primary source is the
participant’s information, and the secondary source is the literature information that
was gathered from books and scholarly journals.
Member checking through going back to the participants’ answers to determine if
they had been accurate enough or some change needed to take place.
Peer debriefing by the subject professor or the project advisor who was acting as a
peer examiner.
The researcher strived to find a common theme across a number of interviews to
avoid relying on one person’s statement as the only source of what was real. Such
themes indicated the same idea that was shared among many people. Therefore, the
researcher referred to the idea with a more confident manner than any other idea that
Most of the collected data was grounded extensively in the field work, which was, in
this case, the service centers’ or customers’ seating areas. That provided a solid
evident that the data were built on detailed examinations of the interviews involved,
and it increased the credibility of the research.
The researcher supplied information that could enable others to examine how
applicable are the findings to be used in another settings or organizations. For
example, the researcher was targeting to interview 20 regular, automobile after-sale
services customers. The number cannot be generalized to the whole population, but
information such as age, sex, job description, and monthly income might help in
thinking about how the similar findings can be applied to the whole automobile
industry in the UAE.
Evaluation and Outcomes
The outcomes of this research project will contribute to advancing and enriching the
knowledge regarding the quality of the after-sale service provided by various automobile dealers
in the United Arab Emirates. Research on the effectiveness of the after-sale service quality in the
same industry, in general, and in the UAE, specifically, are limited. Previous literature confirms
that there are no consistent or proven service-quality dimensions or factors that can be
generalized and that properly fit all service industries. Therefore, such a study will be useful,
especially for the service providers, so they can explore the significant areas that customers
perceive as crucial to classifying their service centers as having high quality service.
Service managers can utilize the study results to identify any differences between their
perceptions and the customers’ on the quality of the services provided after the sale of their
help fulfill those requirements ahead of time. Such a practice is essential in the current
competitive environment. Customer satisfaction is the key element that prevents the automobile
companies from losing market shares, which cannot be obtained without focusing on the
customer requirements and striving to fulfill them.
Results and Interpretations
The purpose of this study was to determine how service mangers and their customers
perceive the after-sale services quality provided by the top five selling automobiles companies in
the UAE and how customer satisfaction level could be affected by having an existence gap
between the perceptions. Seven service managers and 20 customers participated in face-to face
interviews to gather details about the after-sale services based on their knowledge or experiences.
Although demographic characteristics, such as age, sex, experience, education level, etc.,
can have a significant effect on customer satisfaction level, as stated by Danaher (1998) and the
Mittal and Kumar (2001) study finding that showed that customer satisfaction is moderated by
the outcomes of such demographic characteristics, which includes the customer repurchasing
behavior as an example. But the researcher did not take any of their characteristics into
consideration because the main research objective was to highlight the common and general
factors that customers and managers perceive as crucial regardless of the segment to which they
belong. Also, the researcher assumed that customers in different segments would have similar
perceptions and requirements regarding the quality of the after-sale service they wish to receive,
and they would share similar factors that affected their level of satisfaction. Kumar (2012)
supported this researcher through stating that various segmentations suffer from the same issues
customers based on various aspects, but it would not help in differentiating the individuals and
their needs within the marketplace.
Manager interviews were conducted in their offices, while the customer interviews were
conducted in the customer seating areas located in the various service centers. The participants’
answers showed a variety of opinions, points of view, and interesting outcomes regarding the
existing after-sale services. The research questions directed the phenomenological examination
toward being more focused on understanding and evaluating what are the participants’ insights
and perspectives were regarding the after-sale services and how they could be linked to overall
customer satisfaction level.
The findings of this research study are divided into two main sections. The first section,
which is related to Research Question 1, is divided into three main parts. The first part is the data
collected from the service manager interviews, the second part is the data collected from the
customer interviews, which contain both parties’ perceptions on the quality of the after-sale
services and their beliefs about the most important factors that significantly enhance the way
they perceive the quality of the after-sale services. The third part presents a cross comparisons of
service managers’ and customers’ perceptions. The second section, which is related to Research
Question 2, reflects data that presented the significant link between managers’ and customers’
perceptions of the after-sale service quality and customer satisfaction level.
Section 1
Part 1: Service Managers’ Perception of Post-Sale Service Quality
The series of the interview open-end questions were structured to go beyond the
managers’ perspective about the most important factors customers required to have in the
repeated customer’s complaints to have a comprehensive overview of the managers’ perceptions.
Four main themes emerged in the analysis of the service managers’ interviews: managers’
perception of the customers’ common needs, methods managers use to identify customers’
needs, factors that prevent managers from meeting customers’ expectations, and common
customer complaints from the managers’ perception.
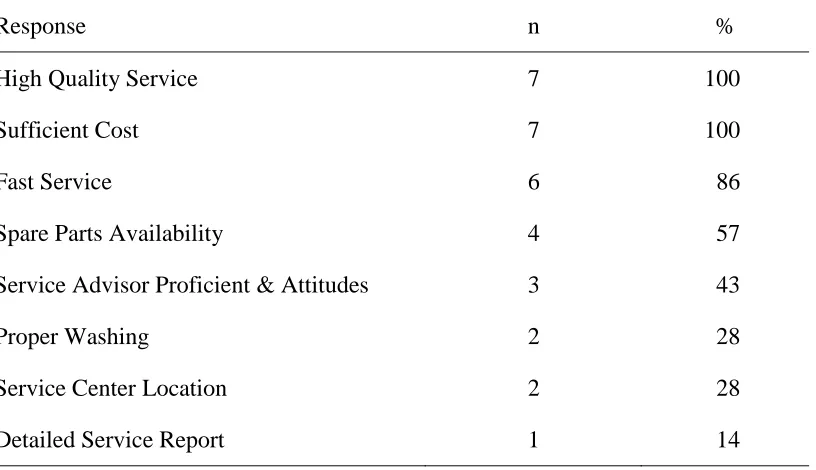
Theme number 1: Managers perception of the customers’ common needs.
The researcher pursued to stimulate service managers to provide a list that contained
critical elements related to the customers’ common needs as they perceive them. Eight
sub-themes emerged from interviewing the service managers in relation to customers’ common
needs: high quality service, sufficient cost, fast delivery process, service advisors’ proficient and
attitudes, spare parts availability, proper car washing, detailed service reports, and service center
location.
High quality service, fast delivery process, and sufficient cost were the most consistent
elements that were mentioned by all of the service managers. The interesting finding, though,
was that there was no similar definition or interpretation to what they meant by “high quality
service” among all seven interviewed service mangers. Some of the managers referred to high
quality service as performing the maintenance activities in authorized dealer workshops, doing
the needed jobs with high standards, and fixing the issues the first time. Others perceived high
quality service as a customer judgment at the delivery stage of the service, while one of the
service managers described high quality service as delivering the cars to the customers in safe
condition. Also, some of the service managers mentioned that high quality service meant
“fault-free service” or “zero-defects service,” which they described further by saying it was about
delivering the cars to the customers. Participant M5 used a different term, which was “peace of
mind.” He explained it further by stating, “customers don’t expect to see any type of problems
with the vehicles after the service.”
All the seven service managers referred to the service cost as one of the most important
requirements for their customers. M3 and M4 ranked service cost at the top of the customers’
priority list, M3 stated “
From the customers’ perspective, all the three elements, which are cost, speed, and quality are important; but as a service manager, I think cost is the most important need for the customers. They would always negotiate the price trying to get the maximum discount they can, of course they would not sacrifice on the other two elements to get a better a discounted price, but you would still notice that their interest regarding the price is more than delivery speed and the quality of the service.”
M4 stated “customers usually put the cost of the service as their first priority because
they assume that they paid for brand new cars, which should not break, and everything is
included under the warranty contract.” Other service managers emphasized the continuous
customer request of having suitable service chargers, assuming that the prices were too high. M1
was the only manager who admitted that their service prices were too high by stating “we admit
that we offer high service prices, but that is due to the high quality services and materials we are
using in our inspections, which is not offered by our competitors.”
The majority of the service managers emphasized the importance of service speed as a
core element in their customers’ needs list. The only manager who did not include service speed
in the customers’ needs list was M6. Instead he highlighted other elements, such as high quality
service, service cost, and proper washing. The interesting finding about service speed was that all
six managers linked the service speed to how long it would take until the customer would get his
car back, neglecting an important aspect, which was the drop off process or how long the