This content has been downloaded from IOPscience. Please scroll down to see the full text.
Download details:
IP Address: 143.167.29.251
This content was downloaded on 23/06/2017 at 11:48 Please note that terms and conditions apply.
A measurement of material in the ATLAS tracker using secondary hadronic interactions in 7
TeV pp collisions
View the table of contents for this issue, or go to the journal homepage for more 2016 JINST 11 P11020
(http://iopscience.iop.org/1748-0221/11/11/P11020)
Home Search Collections Journals About Contact us My IOPscience
You may also be interested in:
High voltage multiplexing for the ATLAS Tracker Upgrade E G Villani, P Phillips, J Matheson et al.
Results from the commissioning of the ATLAS Pixel detector Sara Strandberg
HVMUX, a high voltage multiplexing for the ATLAS Tracker upgrade E. Giulio Villani, P. Phillips, J. Matheson et al.
Mechanical studies towards a silicon micro-strip super module for the ATLAS inner detector upgrade at the high luminosity LHC
G Barbier, F Cadoux, A Clark et al.
A double-sided silicon micro-strip Super-Module for the ATLAS Inner Detector upgrade in the High-Luminosity LHC
S Gonzalez-Sevilla, A A Affolder, P P Allport et al.
A study of the material in the ATLAS inner detector using secondary hadronic interactions The ATLAS collaboration
Status of the ATLAS Experiment
Martin Aleksa and the Atlas Collaboration
2016 JINST 11 P11020
Published by IOP Publishing for Sissa MedialabReceived:September 15, 2016
Accepted:November 21, 2016
Published:November 30, 2016
A measurement of material in the ATLAS tracker using
secondary hadronic interactions in 7 TeV
p p
collisions
The ATLAS collaboration
E-mail: atlas.publications@cern.ch
Abstract: Knowledge of the material in the ATLAS inner tracking detector is crucial in under-standing the reconstruction of charged-particle tracks, the performance of algorithms that identify jets containingb-hadrons and is also essential to reduce background in searches for exotic particles
that can decay within the inner detector volume. Interactions of primary hadrons produced in pp
collisions with the material in the inner detector are used to map the location and amount of this material. The hadronic interactions of primary particles may result in secondary vertices, which in this analysis are reconstructed by an inclusive vertex-finding algorithm. Data were collected using minimum-bias triggers by the ATLAS detector operating at the LHC during 2010 at centre-of-mass energy√s = 7 TeV, and correspond to an integrated luminosity of 19 nb−1. Kinematic properties
of these secondary vertices are used to study the validity of the modelling of hadronic interactions in simulation. Secondary-vertex yields are compared between data and simulation over a volume of about 0.7 m3around the interaction point, and agreement is found within overall uncertainties.
Keywords: Detector modelling and simulations I (interaction of radiation with matter, interaction of photons with matter, interaction of hadrons with matter, etc); Performance of High Energy Physics Detectors
2016 JINST 11 P11020
Contents
1 Introduction 1
2 ATLAS inner detector 3
3 Event samples, track and secondary-vertex reconstruction 3
3.1 Track reconstruction 4
3.2 Track selection 5
3.3 Secondary-vertex reconstruction 5
3.4 Secondary-vertex selection and resolution 6
3.5 Vertex yields 8
4 Qualitative comparison of data to simulation 9
4.1 Displacement of material layers 13
4.2 Pixel and SCT detector modules in their local coordinate frames 13
4.2.1 Pixel modules 14
4.2.2 SCT modules 15
4.3 Kinematic characteristics of secondary vertices 15
5 Systematic uncertainties 16
5.1 Tracking efficiency 16
5.2 Modelling of hadronic interactions in simulation 17
5.3 Vertex reconstruction 19
5.4 Other sources 20
5.5 Total systematic uncertainty 20
6 Results 20
7 Conclusions 23
The ATLAS collaboration 26
1 Introduction
2016 JINST 11 P11020
known to an accuracy of about 4–5%, which was achieved by weighing the various componentsbefore installation.
Traditionally, photon conversions, sensitive to the radiation length (X0), have been used to map
the material in particle detectors. A complementary approach, based on hadronic interactions of primary particles with material in the ID, has been developed [2], which is sensitive to the hadronic interaction length (λ). Secondary hadronic interactions with material in the ID usually involve low- to medium-energy primary hadrons with average momentum around 4 GeV, and with about 96% having momentum less than 10 GeV. Consequently, the outgoing particles have relatively low energy and large opening angles between them. The trajectories of these particles can be reconstructed by the tracking system, and in cases where two or more such tracks are reconstructed, the precise location of the interaction can be found.
In ATLAS, an inclusive vertex-finding and fitting algorithm is used to find vertices associated with hadronic interactions. Typical resolutions of vertex positions,1 inr (z), are around 0.2 mm (0.3 mm) for this technique, as compared to around 2 mm (1 mm) for photon conversions. In the latter, the opening angle between the outgoing electron-positron pair is close to zero, thereby degrading the radial resolution. The good position resolution of hadronic-interaction vertices is exploited to study the location and amount of material in the ID.
Knowledge of the exact location of this material is needed in searches for exotic particles that can decay within the ID volume, as secondary interaction vertices are a background to these searches. The results from a previous study were used in analyses searching for decays of exotic particles that are postulated to exist in models ranging from R-parity-violating supersymmetry, split supersymmetry, Generalized Gauge Mediation [3] to Hidden Valley scenarios [4]. In these analyses, part of the search region was masked out using material maps based on the results of ref. [2]. Additionally, since this technique directly probes the hadronic interaction length of any material, it can also be used to study the modelling of low- to medium-energy hadronic interactions in simulation.
The analysis presented here uses a modified tracking configuration and improved vertex selec-tion criteria, which substantially increase the number and quality of reconstructed vertices over a larger volume as compared to the previous study. The previous study was restricted tor <320 mm
and|z| < 300 mm, whereas this one expands this region tor < 400 mm and|z| < 700 mm, which represents an increase in the fiducial volume from 0.19 m3to 0.70 m3. The dataset used now is the
same one as in ref. [2], although the track reconstruction algorithms use improved ID alignment parameters. The data are compared to simulation, which has an improved description of the ID geometry and other corrections to resolve some of the discrepancies found in the previous study.
This paper is structured as follows. A brief introduction to the ATLAS ID is given in section2. The event samples, track selection and vertex reconstruction and selection are described in section3, along with the yield of reconstructed secondary vertices (SV). Section 4 contains a qualitative comparison of data with simulation, followed by an estimate of the systematic uncertainties in section5. The results are presented in section6, and conclusions are given in section7.
1ATLAS uses a right-handed coordinate system with its origin at the nominal interaction point (IP) in the centre of
the detector and thez-axis along the beam pipe. Thex-axis points from the IP to the centre of the LHC ring, and the
y-axis points upward. Cylindrical coordinates(r, φ)are used in the transverse plane,φbeing the azimuthal angle around
2016 JINST 11 P11020
2 ATLAS inner detector
The ATLAS detector consists of an inner tracking detector, electromagnetic and hadron calorimeters, a muon spectrometer, and three magnet systems [1]. The inner tracking detector is crucial to this analysis; its active volume extends from 45 mm to 1150 mm inr and±2710 mm in |z|. A quarter section of the ID is shown in figure1.
The ID is composed of three sub-systems: a silicon pixel detector, a silicon microstrip detector (SCT) and a transition radiation tracker (TRT), all of which are immersed in a 2 T axial magnetic field. The tracking system consists of a cylindrical barrel region (|η| .1.5) arranged around the
beam pipe, and two end-caps. Disks in the end-cap region are placed perpendicular to the beam axis, covering 1.5.|η|< 2.5. The pixel detector is located atr< 150 mm, and provides precision measurements from 80.4 million sensors. It consists of three barrel layers with |z| < 400 mm and six disks in the end-cap region, which extend out to |z| ∼ 660 mm. The SCT detector has four barrel layers extending fromr ∼250 mm to 550 mm with|z| < 750 mm, and 18 disks in the end-cap region with|z| < 2710 mm; it consists of∼ 6.3 million readout strips. The TRT consists of 298,000 straw tubes with diameter 4 mm, and provides coverage out to |η| ∼ 2.0. In the barrel, it stretches fromr∼560 mm to 1100 mm and|z| <780 mm. The end-cap region extends the TRT toz = ±2710 mm. The regions between the material layers are filled with different gases, such as CO2or N2. In addition, there are various support structures, which, for the most part, are carbon
fibre reinforced plastic honeycomb shells, and services such as cooling pipes.
3 Event samples, track and secondary-vertex reconstruction
Data were collected in 2010ppcollisions at a centre-of-mass energy of 7 TeV and correspond to an integrated luminosity of 19 nb−1. Triggers used to collect data relied on the coincidence between the beam pickup timing devices (z=±175 m) and minimum-bias trigger scintillators (z=±3.56 m) [6]. The instantaneous luminosity in the early part of the run was approximately 1027–1029 cm−2s−1, which implies, on average, a very low number of extra interactions per beam crossing (pile-up). This data sample is the same as in ref. [2], although the track reconstruction algorithms use improved ID alignment parameters. The data are compared to simulation, which includes an improved description of the ID geometry, e.g., the position of the beam pipe, the implementation of a slight shift of the pixel barrel layers, and the amount of material in the end-region of the pixel barrel.
Monte Carlo (MC) simulation events were generated using PYTHIA8 [7] with the MSTW2008LO set of parton distribution functions [8] and A2MSTW2008LO set of tuned param-eters [9]. Particle propagation through the detector was simulated with GEANT4 [10]. Hadronic interactions in GEANT4 were simulated with the FTFP_BERT [11] model, which is an improve-ment over the previous model. The simulated events were processed with the same reconstruction software as data. The ATLAS simulation infrastructure is described in ref. [12].
2016 JINST 11 P11020
Envelopes Pixel SCT barrel SCT end-cap TRT barrel TRT end-cap 255<R<549mm |Z|<805mm 251<R<610mm 810<|Z|<2797mm 554<R<1082mm |Z|<780mm 617<R<1106mm 827<|Z|<2744mm 45.5<R<242mm |Z|<3092mm Cryostat PPF1 Cryostat Solenoid coil z(mm) Beam-pipe Pixel support tube SCT (end-cap) TRT(end-cap)1 2 3 4 5 6 7 8 9101112 1 2 3 4 5 6 7 8
Pixel
400.5
495580650749853.89341091.51299.91399.7 1771.4
2115.2 2505 2720.2 0 0 R50.5 R88.5 R122.5 R299 R371 R443 R514 R563 R1066 R1150 R229 R560 R438.8 R408 R337.6 R275 R644 R1004 2710 848 712 PPB1 Radius(mm) TRT(barrel) SCT(barrel) Pixel PP1 3512 ID end-plate
Pixel
400.5 495 580 650
0 0 R50.5 R88.5 R122.5 R88.8 R149.6 R34.3
Figure 1. View of a quadrant of the ID [5] showing each of the major detector elements with their active
dimensions and envelopes. The lower part shows a zoomed-in view of the pixel detector region.
were 18 (6) million events in data (simulation). The simulated events were weighted such that the mean and width of thez-coordinate distribution of the PV position matched the data.
3.1 Track reconstruction
Since tracks originating from secondary hadronic interactions generally have large impact param-eters with respect to the PV, the reconstruction efficiency of such tracks needs to be as high as possible. In the standard track reconstruction algorithm, stringent upper limits are placed on the impact parameters of the tracks with respect to the beam axis. Such requirements have little effect on the efficiency of reconstructing primary tracks and speed up event reconstruction time. However, these requirements severely limit the reconstruction of secondary tracks, especially those originating far from the PV.
To address the low efficiency of reconstructing secondary tracks, a second pass of track reconstruction was executed that used hits in the ID left over after the standard track reconstruction step had finished. This second pass also had looser selection criteria applied to track parameters. The increase in the number of reconstructed tracks with large impact parameters can be seen in figure2, whered0(z0) is the transverse (longitudinal) impact parameter with respect to the PV. In
2016 JINST 11 P11020
[image:7.595.100.503.85.239.2](a) (b)
Figure 2. Distributions of (a) transverse (d0) and (b) longitudinal (z0) impact parameters of tracks in
simulated events. Open squares show tracks reconstructed with the standard algorithm, closed squares show tracks reconstructed with either the standard or second-pass reconstruction algorithm.
3.2 Track selection
Secondary tracks typically have large values of transverse impact parameter. Therefore, in order to select mostly secondary tracks and reduce the contamination of primary tracks, the tracks were required to have|d0| > 5 mm. This requirement removed∼99% of primary tracks as well as many tracks originating fromKS0andΛdecays, and photon conversions.
No requirements were placed on the number of pixel hits on a track as this would have prevented reconstruction of vertices outside the pixel detector. However, tracks were required to have at least one SCT hit, to ensure that there was at least one hit per track in a silicon detector. In order to improve the quality of reconstructed secondary vertices, well-measured tracks were required, i.e., track fit χ2/dof< 5 (where “dof” means degree of freedom).
Track reconstruction efficiency and track parameters are well reproduced in simulation. How-ever, there are small differences between data and simulation [6,7] in the number of reconstructed primary tracks. The primary track multiplicity directly affects the number of secondary interac-tions; if there are more primary particles, then there are also more hadronic interactions. Since data has more primary tracks, yields in simulation are corrected to account for this difference. This correction factor was determined by extrapolating primary tracks, separately in data and simulation, to various material layers, counting how many of them intersected the layer within the fiducial volume, and taking their ratio. Particles that travel through a layer at angles different than normal encounter more material and have a higher interaction probability than those at normal incidence; this is taken into account. The correction factor ranged from 1.05 to 1.07.
3.3 Secondary-vertex reconstruction
Appcollision event may contain decays of short-lived particles such as bottom and charm hadrons, decays of long-lived particles such as KS0 and Λ, photon conversions, and hadronic interaction
2016 JINST 11 P11020
A vertex finder designed to simultaneously find all secondary vertices in the event was usedin this analysis. The algorithm begins by finding all possible intersections of pairs of selected tracks, and assumes that the two secondary tracks originate from a single point. A fit is performed, during which track parameters are varied, and modified, if necessary, and the vertex position is determined. A χ2 describing the fit quality of the vertex is determined using the differences
between the measured and the recalculated track parameters [14]. The reconstructed two-track vertices define the full set of vertices in the event, because anyN-track vertex is simply a union of corresponding two-track sub-vertices.
Requiring these two-track vertices to have an acceptable χ2/dof (<4.5) removes ∼85% of
random pairings. Studies on simulated events indicate that more than 83% of hadronic interaction vertices are retained. In the barrel region of the ID, the number of fake vertices from random combinations is further reduced by requiring that tracks do not have hits in silicon layers at a radius smaller than the radius of the reconstructed vertex, and have hits in some of the layers that are at larger radii than the vertex; in the end-cap region, only the minimum number of hits in the SCT is required. Vertices that fail to meet these criteria are removed from the list of selected two-track vertices. This procedure removes, depending on radius, anywhere from one-half to two-thirds of the initial set of two-track vertices, whereas the reduction in efficiency for reconstructing hadronic interaction vertices is about 2–10%.
To finalize the vertex finding, two further steps were undertaken: first, the total number of vertices in the event was minimized by merging the two-track candidates that were nearby, a decision that was based on the separation between vertices and on their covariance matrices; second, since a track could have been used in several two-track vertices, such cases were identified and resolved so that all track-vertex associations were unique. The algorithm worked iteratively to clean the vertex set, based on an incompatibility-graph approach [15]. In each iteration it either identified two close vertices and merged them, or found the worst track-vertex association for multiply assigned tracks and broke it. Iterations continued until no further improvement was possible. The CPU performance of the algorithm was acceptable for events with track multiplicity up to ∼ 200, which was significantly larger than the average multiplicity in events used in this analysis (about 50 tracks/event).
3.4 Secondary-vertex selection and resolution
The looser requirements on track reconstruction (section3.1) significantly improve vertex recon-struction efficiency for all values ofr andz. However, studies on simulated events show that this increase is accompanied by a decrease in the purity of secondary-vertex reconstruction, which is defined as the fraction of reconstructed vertices that match true secondary interactions. The match-ing is based on the distance between the true and reconstructed position of a secondary interaction. Since the most important purpose of the analysis is to provide precise comparison of data and simulation, purity needs to be as high as possible. To achieve this, stringent requirements were placed on tracks associated with reconstructed secondary vertices: relative error on the transverse momentum of tracksσ(pT)/pT < 0.05, transverse and longitudinal impact parameters relative to
the secondary vertex|dSV0 | < 1 mm and|zSV0 |< 2 mm respectively.
2016 JINST 11 P11020
Table 1. Purity of reconstructed vertices in various regions of the ID. Errors are statistical only.
Pixel barrel region (|z| <400 mm)
Layer Purity %
Beam pipe (r:28–36 mm) 82.5±0.1 1st pixel layer (r:45–75 mm) 75.3±0.1 2nd pixel layer (r:83–110 mm) 80.0±0.1 3rd pixel layer (r:118–145 mm) 68.0±0.1
SCT barrel region (|z| <700 mm)
Layer Purity %
Pixel support frame (r:180–220 mm) 71.9±0.2 Pixel support tube (r:226–240 mm) 87.0±0.4 1st SCT layer (r:276–320 mm) 78.1±0.2 2nd SCT layer (r:347–390 mm) 61.4±0.5 Pixel forward region (r: 75–180 mm,|z|>400 mm)
Layer Purity %
1st pixel disk (|z|:490–500 mm) 57.7±0.4 2nd pixel disk (|z|:575–585 mm) 61.9±0.5 3rd pixel disk (|z|:645–655 mm) 56.7±0.7
vertex failed these requirements, the entire vertex was discarded. This procedure removed a small fraction of real secondary vertices with more than two tracks, but since most of the reconstructed vertices had only two tracks, the benefit from the significant increase in purity outweighed the small loss in efficiency. In both data and simulation, about 90% of reconstructed secondary vertices are two-track vertices and almost all of the other 10% of vertices have three tracks. Purities are consistently higher for allrandz, especially at larger radii, as compared to the previous study. For instance, the second SCT layer was not previously studied since the purity was only 15%. Table1
lists the values at various material layers. This metric enters into the final result as an additional systematic uncertainty due to small differences in the rate of fake vertices in data and simulation. The total efficiency to find secondary vertices, containing at least two tracks withpTandηsatisfying
the selection criteria, is about 9% at the beam pipe, and decreases with radius; it includes efficiencies for track and vertex reconstruction steps, and the selection requirements described above.
The spatial resolution of the position of the secondary vertex depends on the quality of the track reconstruction. Vertices at smaller radius contain tracks with more silicon hits and are therefore reconstructed with less uncertainty. Averaging over the full kinematic range of tracks, studies on simulated events indicate that radial andzresolutions at the beam pipe and through to the first SCT layer are about 0.22 mm and 0.25 mm respectively (see ref. [2] for details). At the second SCT layer (r >320 mm), they worsen to about 0.34 mm and 0.70 mm respectively. These resolutions make it
2016 JINST 11 P11020
3.5 Vertex yieldsThe invariant-mass spectrum of reconstructed secondary vertices is shown in figure 3. During track reconstruction, the pion mass is assigned by default to tracks. The broad ‘shoulder’ around 1100 MeV is a kinematic effect and reflects the minimum required track pT. The peak around
300 MeV corresponds to photon conversions, where the non-zero mass is due to the assignment of theπ±mass to thee±tracks, and the peak around 500 MeV corresponds toK0
S-meson decays.
Λ-baryon decays do not contribute to a peak because the pion mass was assigned to the proton track.
Vertices corresponding to photon conversions, KS0-meson and Λ-baryon decays were vetoed
by restrictions on the invariant mass of the tracks belonging to the secondary vertex. In the case ofΛbaryons, the mass was recalculated by assigning the proton mass to the track with the higher
momentum, which gave the correct assignment in over 97% of such decays. If the invariant mass lay within±35 MeV of theKS0mass (497.5 MeV) or±15 MeV of theΛmass (1116 MeV), the vertex
[image:10.595.162.438.313.509.2]was vetoed. Track combinations with invariant masses below 310 MeV were removed to eliminate photon conversions.
Figure 3. Invariant-mass spectrum of the reconstructed secondary vertices, assuming the pion mass for all
tracks, in data (points) and MC simulation (solid histogram).
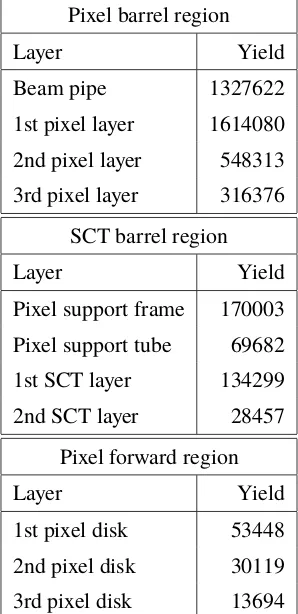
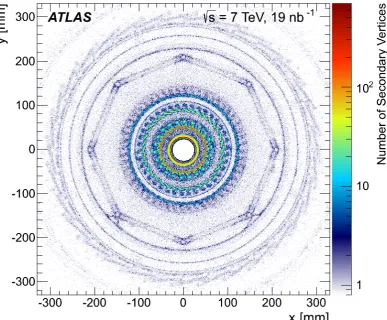
The vertex yields in data after these selection criteria are shown in table2. High-resolution images, in data, of the secondary-vertex positions in the detector are shown in figures4,5and6. In figure4
they-position is shown versus thex-position for vertices in the pixel barrel region, |z| < 400 mm. The regions with higher density than their surroundings are, going from the innermost to the outermost: the beam pipe, the first, second and third pixel layers, the pixel support frame (the octagon), the pixel support tube, the SCT thermal shield, the first SCT layer and at the very edge with few vertices is the second SCT layer. Vertices further out than the second SCT layer are expected to have worse resolution and purity due to fewer silicon hits on the associated tracks; these layers are therefore disregarded.
2016 JINST 11 P11020
Table 2. Yields of secondary vertices in data in various regions of the ID. The radius andzof these regions
are defined in table1.
Pixel barrel region
Layer Yield
Beam pipe 1327622
1st pixel layer 1614080 2nd pixel layer 548313 3rd pixel layer 316376
SCT barrel region
Layer Yield
Pixel support frame 170003 Pixel support tube 69682 1st SCT layer 134299 2nd SCT layer 28457
Pixel forward region
Layer Yield
1st pixel disk 53448 2nd pixel disk 30119 3rd pixel disk 13694
of the modules in the three pixel barrel layers is visible. The wave-like behaviour in the beam pipe and the three pixel layers is due to the fact that the layers are not centred around [0,0]. The average displacements inxandyare listed in table3. The decrease in the number of vertices between the pixel barrel and the pixel end-caps, at|z| ∼400 mm in figure6, is due to differences in the silicon-hit based fake-removal criteria in these two regions. The dense cluster of vertices at|z| ∼400–470 mm and 50 < r < 155 mm represents services at the end of the pixel barrel. The pixel end-cap disks
are atz >495 mm, andr between 80 and 175 mm.
4 Qualitative comparison of data to simulation
Vertex yields as a function of radius are shown in figure7. Each material layer is clearly visible as indicated by the increase in vertex density at specific values of r. Agreement between data and simulation is good, especially for the detector layers. However, there are small disagreements arising from simplifications made in the geometry model for some of the structures, e.g., the pixel support tube atr∼200 mm, and others which appear as sharp peaks, e.g.,raround 70 and 105 mm. There are also some disagreements in the air gaps between detector layers.
2016 JINST 11 P11020
Figure 4. Number of selected secondary vertices in data in the x–yplane of the ID. Only vertices with
|z|<400 mm are considered. For presentation purposes, the background inside the beam pipe is masked out.
2016 JINST 11 P11020
Figure 5. Number of selected secondary vertices in data in ther–φ plane of the ID. Only vertices with
|z|<400 mm are considered.
[image:13.595.107.492.474.689.2]2016 JINST 11 P11020
Figure 7. Number of selected secondary vertices per event in data (points) and MC simulation (solid
histogram), as a function ofrwith|z| <700 mm.
(a) (b)
Figure 8. Number of selected secondary vertices per event in data (points) and MC simulation (solid
[image:14.595.95.504.452.627.2]2016 JINST 11 P11020
4.1 Displacement of material layersAs reported previously [2], the positions of the beam pipe and the three pixel layers are not centred around [x =0,y=0] in the detector, as concluded from the sinusoidal behaviour in figure5. Sine
functions were fit to theφdependence in each radial interval to estimate the displacement from the origin inx andy. Their amplitudes are reported in table3; uncertainties coming from the fitting procedure are.0.02 mm. The shift in simulation agrees well with data for the beam pipe, and the
small discrepancy for the pixel layers has no impact on the quantitative results presented later in this paper.
Figure9shows ther–φdistribution of selected secondary vertices for the radial region
corre-sponding to the first SCT layer (r: 276–320 mm). The SCT inner thermal shield is atr ≈257 mm. Several deformations and shifts are visible in the thermal shield, e.g. most clearly the “bumps" at various φ positions (−1.8, −0.2 and +1.0) with a size of 0.5 mm; shifts are of order 0.5 mm to 1 mm. In simulated events, these structures are flat along theφ-axis.
Table 3. The displacement,x andy, in mm from the origin for the first four material layers of the ID.
Displacements seen in simulated events are compared with data. The radius andzof the various layers are defined in table1.
Data MC simulation Layer Disp. x Disp.y Disp. x Disp. y Beam pipe –0.21 –1.90 –0.21 –1.93 1st pixel layer –0.32 –0.50 –0.23 –0.32 2nd pixel layer –0.34 –0.46 –0.25 –0.35 3rd pixel layer –0.15 –0.16 –0.31 –0.18
4.2 Pixel and SCT detector modules in their local coordinate frames
The detector modules in the barrel overlap in r–φ to give complete coverage, as can be seen in figure4. To study details of individual modules, the positions of the reconstructed vertices were transformed from the global ATLAS reference frame to the module-specific local coordinate frame.2
These transformations were performed for vertices in the first five silicon layers of the ID barrel. Due to the decreasing number of vertices with increasingrthe visible details of the pixel modules are degraded when going from the first to the third layer, and similarly for the SCT layers. Hence for qualitative comparisons, only modules in the first pixel and SCT layers are considered. These are shown in figures10and11respectively.
Due to the excellent radial vertex resolution it is possible to specifically select vertices origi-nating in the silicon sensor element in the pixel and SCT modules; the thickness of this element in these two kinds of modules is 250 µm and 285 µm respectively. These vertices are then used in section4.3to explore kinematic details of the modelling of hadronic interactions in the silicon.
2Local-X is along the globalφ direction, local-Y is along the stave (global z), and local-Z is along the global
2016 JINST 11 P11020
Figure 9. Number of selected secondary vertices in data in the r–φ plane of the ID. The radial range
corresponds to the SCT inner thermal shield and the first SCT barrel layer.
4.2.1 Pixel modules
Components of the pixel module such as the active silicon sensor element (local-X within±9 mm and local-Z∼0 mm), the cooling-fluid pipe (seen as the half-circle on top of the module), and cables and supports (the rectangular area above the cooling pipe in simulation, and above and to the right in data) are clearly visible in figure10.
(a) (b)
Figure 10. Number of selected secondary vertices in the local coordinate frame of the pixel module,
[image:16.595.98.500.525.676.2]2016 JINST 11 P11020
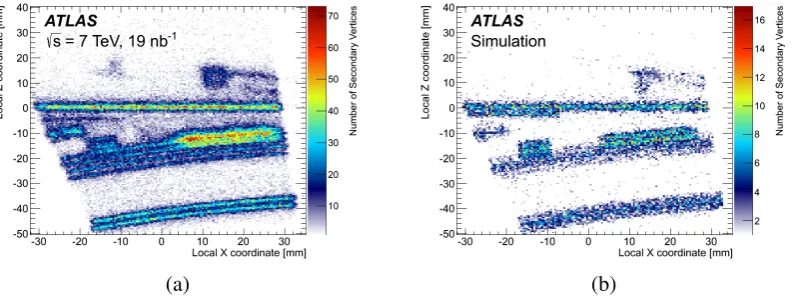
4.2.2 SCT modulesFigure11shows a detailed view of a module in the first SCT barrel layer in data and in simulation. The horizontal section around local-Z of 0 mm spanning local-X within ±30 mm is the sensor element, and the structure right above it (with local-Xin the range [10,30] mm) is the cooling-fluid
pipe. The band with local-Zin the range [−30,−20] mm is a support structure, and the band at the bottom of the plot is the SCT thermal shield.
[image:17.595.102.500.188.337.2](a) (b)
Figure 11. Number of selected secondary vertices in the local coordinate frame of the SCT module,
for (a) data and (b) MC simulation, in the first barrel layer. The data sample has more events than the simulated sample.
4.3 Kinematic characteristics of secondary vertices
In addition to comparing the location of secondary vertices in data and simulation, their kinematic characteristics are compared. This allows a study of models of hadronic interactions of low- and medium-energy hadrons used in GEANT4. Kinematic variables that are mainly dependent on details of the hadronic interactions are compared, e.g., the total momentum of tracks emerging from the secondary vertex, the fraction of the total momentum carried by the highest-momentum secondary track, and the opening angle between the tracks.
2016 JINST 11 P11020
[image:18.595.97.498.86.247.2](a) (b)
Figure 12. The total (scalar) sum of the momentum,Σ|p¯|, of secondary particles from hadronic interactions
found in (a) the beryllium part of the beam pipe, and (b) the silicon element in the pixel modules. The data (points) are compared to simulation using two models of hadronic interactions (solid histograms). The number of selected secondary vertices isNSV.
5 Systematic uncertainties
5.1 Tracking efficiency
The main source of systematic uncertainty in the reconstruction efficiency of charged hadrons is the uncertainty in the description of material in the ID [6]. The overall scale of the reconstruction efficiency of primary tracks in data is well modelled in simulation, implying that the total amount of material in the ID is well understood. However, discrepancies in the location of the material can impact the reconstruction efficiency of tracks arising from vertices far from the PV.
Decays of KS0-mesons are used to make a comparison of track reconstruction efficiency in
data and simulation as a function of vertex position. These decays are a source of charged pions that are independent of the hadronic interaction rate, yet probe the material in a manner similar to tracks from a secondary interaction vertex. Pions produced in these decays also have large impact parameters relative to the PV. The momentum spectrum ofKS0candidates in simulation agrees with
data, hence a comparison of their yields (in data and simulation) as a function of decay distance probes the efficiency of reconstructing secondary tracks. KS0 yields are determined by fitting the
invariant mass of two tracks of opposite charge with a signal and a background function, where the signal is a sum of two Gaussian functions (with a common mean) and the background is represented by a first-order polynomial.
The hadronic-interaction analysis provides differential measurements of the material budget, layer by layer. Comparing the reconstructed KS0 yield in data to that in simulation in different
radial intervals corresponding to the material layers eliminates any direct dependency of the track reconstruction efficiency on the material in that layer, since this efficiency is dependent only on the amount of materialoutsidethe given material layer. Intervals were selected so that the tracks from the KS0 decays in the selected radial range passed through the same amount of material as
2016 JINST 11 P11020
To account for different numbers ofKS0-mesons produced in data and simulation, yields invari-ous radial bins in data and simulation were normalized separately to the total yields in the respective samples. A double ratio of these normalized yields in data and simulation was constructed, and is shown in figure13. A deviation from unity would imply a difference between track reconstruction efficiencies in data and simulation. The largest deviation is about 3.4%.
The uncertainty arising from the production ofKS0-mesons in secondary interactions or decays
of heavier hadrons was estimated to be 0.3%. This was added linearly to the uncertainty determined above to give a total systematic uncertainty of 3.7% for a two-track vertex. This implies an uncertainty of 1.85% per track. Since the maximum deviation from unity was taken as a measure of the systematic uncertainty, it is likely to be conservative.
[image:19.595.155.440.333.539.2]Since about 10% of secondary vertices from hadronic interactions have more than two asso-ciated tracks, an overall systematic uncertainty was derived by randomly removing 1.85% of the tracks during vertex reconstruction. In vertices with more than two tracks, removing one of the tracks still allows the vertex to be reconstructed. The reduction in the number of secondary vertices was 3.4%, which was taken as the systematic uncertainty on the ratio of hadronic interaction vertex yields in data and simulation.
Figure 13. A double ratio ofKS0 yields at different decay distances. The bands are statistical uncertainties
from the fits to obtain Ksyields. Details are given in the text.
5.2 Modelling of hadronic interactions in simulation
2016 JINST 11 P11020
Using the differences between these cross-sections, and the numbers of interactions in variouselements due to these hadrons, the following systematic uncertainties were assigned: +0.2%
−0.4%for the beam pipe (which is mainly beryllium),±0.1% for the pixel support frame and tube (mainly made of carbon), and+0.9%
−3.2%for all other material layers (assumed to be silicon and carbon).
In addition, mismodelling of secondary hadronic interactions in GEANT4 can lead to dif-ferences in the distributions of kinematic variables between data and simulation. Several vari-ables were studied: invariant mass andΣ(pT) of the tracks emerging from the secondary vertex, (pT(max) − pT(min))/Σ(pT), where min (max) are the minimum (maximum) pT of secondary
[image:20.595.213.384.369.713.2]tracks, and the polar angle of the momentum vector of the secondary vertex, which was determined using the momenta of the secondary tracks. Ratios of yields in data to those in simulation were determined for different intervals in these variables, and based on these studies, layer-by-layer systematic uncertainties were estimated. These were combined in quadrature with previously de-termined uncertainties in the interaction cross-sections used in GEANT4. The total uncertainties are shown in table 4; they are applied to the ratios of secondary-vertex yields in data to those in simulation.
Table 4. Systematic uncertainties due to mismodelling of hadronic interactions in GEANT4 in various
regions of the ID. These uncertainties are applied to the ratios of secondary-vertex yields in data to those in simulation. The radius andzof these regions are defined in table1.
Pixel barrel region
Layer Syst. Uncert.
Beam pipe +0.2%
−0.4% 1st pixel layer +1.6%
−3.5% 2nd pixel layer +2.7%
−4.1% 3rd pixel layer +2.8%
−4.1%
SCT barrel region
Layer Syst. Uncert.
Pixel support frame +2.9%
−2.9% Pixel support tube +3.4%
−3.4% 1st SCT layer +3.0%
−4.3% 2nd SCT layer +3.6%
−4.7%
Pixel forward region
Layer Syst. Uncert.
1st pixel disk +1.7%
−3.5% 2nd pixel disk +1.4%
−3.4% 3rd pixel disk +1.2%
2016 JINST 11 P11020
Table 5. Systematic uncertainties due to fake vertices in various regions of the ID. These are applied to the
ratios of secondary-vertex yields in data to those in simulation. The radius andzof these regions are defined in table1.
Pixel barrel region
Layer Syst. Uncert.
Beam pipe 1.4%
1st pixel layer 2.0% 2nd pixel layer 1.6% 3rd pixel layer 2.6%
SCT barrel region
Layer Syst. Uncert.
Pixel support frame 3.6% Pixel support tube 1.7% 1st SCT layer 2.8% 2nd SCT layer 5.0%
Pixel forward region
Layer Syst. Uncert.
1st pixel disk 3.4% 2nd pixel disk 3.0% 3rd pixel disk 3.5%
5.3 Vertex reconstruction
Systematic uncertainties arising during the vertex selection step could come from non-optimal mod-elling of theχ2requirement on the vertex fit, and the merging of nearby vertices. Data and simulated
samples were re-analysed using different selection criteria for these variables, and the relative dif-ferences in the behaviour of these samples were used to assign a systematic uncertainty of 1%.
Studies on simulated events showed that once restrictions were placed on the invariant mass of tracks emerging from secondary vertices to remove contamination from photon conversions,KS0
andΛdecays, the remaining vertices were mainly due to true hadronic interactions or were fake,
i.e., composed of random tracks that do not originate from a common point, and consequently have large values of χ2/dof. Any residual contamination from conversions andK0
S andΛdecays was
found to be less than 1%, and was ignored.
However, an additional systematic uncertainty can arise from mismodelling the rate of fake secondary vertices. At the beam pipe, the purity is 82.5%, i.e., 16.5% of the reconstructed vertices are expected to be fake. In some of the other material layers, the fraction of fake vertices is higher (table1). Vertices with 10 < χ2/dof < 50 were chosen to study this effect. The ratio of
reconstructed vertices in data and simulation, with these poor values of χ2/dof, was studied in three
2016 JINST 11 P11020
5.4 Other sourcesIn this analysis, only the number of primary tracks in simulation was corrected to match data, and because hadronic interactions caused by secondary particles and neutral hadrons were not explicitly accounted for, a systematic uncertainty due to this source was investigated. Correction factors for primary and secondary tracks were studied separately, where the latter were selected by requiring |d0| to be> 5 mm, and an average was determined based on estimates from simulation for the fraction of interactions that were due to secondary particles. An uncertainty of 1% was assigned due to this source. Since the production rate of neutral hadrons is related to the rate for charged hadrons via isospin symmetry, and corrections were made for charged particles, any residual uncertainties were assumed to be negligible.
As discussed in section 3, a requirement on the track multiplicity at the PV was made in order to enhance non-diffractive events in data. If the distributions were to be different in data and simulation, this could introduce an uncertainty. This was tested by increasing the requirement on the number of tracks in the PV and noting the reduction in the number of vertices, separately in data and simulation samples. A difference of 0.3% was seen between the two samples, and this was taken as a measure of the systematic uncertainty from this source.
Another uncertainty could arise if the primary-particle composition was incorrectly generated in PYTHIA8 [7]. This event generator was tuned using data collected by experiments at LEP and SLAC, which had dedicated particle identification sub-detectors. Also, a comparison of PYTHIA8 and EPOS [16] samples (for 13 TeVppcollisions) showed good agreement in the generated fractions of charged hadrons such as pions, kaons and protons. Hence, the systematic uncertainty from this source was assumed to be small and was neglected.
5.5 Total systematic uncertainty
[image:22.595.140.452.510.644.2]The systematic uncertainties on the ratios of yields in data to those in simulation are listed in table6. They are assumed to be uncorrelated and combined in quadrature.
Table 6. Summary table of all systematic uncertainties in the vertex yield comparisons.
Source Syst. Uncert.
Track reconstruction efficiency 3.4% Modelling of hadronic interactions −4.7% – +3.6%
Vertex reconstruction 1.0%
Fake vertices 1.4–5.0%
Track multiplicity correction for MC simulation 1.0% Primary track multiplicity cut 0.3%
6 Results
2016 JINST 11 P11020
this approach, various acceptances and reconstruction efficiencies largely cancel, and any residualdifferences between data and simulation are assigned as systematic uncertainties on the ratio of yields; these uncertainties are listed in table6.
The ratios of yields for the beam pipe, the three pixel layers, the pixel support frame and tube, the first two SCT layers and the three pixel end-cap disks are shown in table7and figure14. All secondary-vertex quality cuts were applied before vertex yields were calculated. The yields in the simulated sample were multiplied by the correction factors to account for different numbers of primary tracks in data and simulation. Simulated events were also weighted to match the z -coordinate of the primary-vertex spectrum in data. The total uncertainty is dominated by systematic effects, discussed in section5.
[image:23.595.156.437.408.567.2]The beam-pipe region shows good agreement between data and simulation; in addition, the yields in the 800µm beryllium layer in the beam pipe agree well, where the ratio of data to simulation is 1.010±0.002 (stat.)±0.040 (syst.).3 In the three pixel barrel layers the simulation overestimates the material by about 1σwhile in the two SCT barrel layers the material in the data is larger than in the simulation by also about 1σ. The first two pixel disks agree well within uncertainties, while the third disk is low by about 1σ. An excess of material in the radial regions 180–220 mm (pixel support frame) and 226–240 mm (pixel support tube) is observed in data as compared to the ATLAS detector model; these two structures combined constitute less than 1% of the total mass of the ID. These discrepancies are understood to be due to missing components in the description of these support structures, which will be included in newer versions of the ATLAS detector geometry used in simulation.
Figure 14. Ratios of yields of secondary vertices in data to those in MC simulation for the barrel and
end-cap regions. The total uncertainties (dotted lines) include both statistical (dark shading) and systematic uncertainties (light shading) in the vertex yields.
Table8lists the ratios of yields in the silicon element of the detector modules in the first five silicon layers in the barrel using the local coordinate transformations discussed in section4.2. The agreement is within uncertainties. Since the thickness of the silicon element is well-known, these results demonstrate that experimental uncertainties are well understood.
2016 JINST 11 P11020
Table 7. Ratios of yields of secondary vertices in data to those in MC simulation for various regions in the
ID. The first uncertainty is statistical and the second systematic. The radius andzof these regions are defined in table1.
Pixel barrel region
Layer Yield Data/MC
Beam pipe 1.002±0.002±0.040 1st pixel layer 0.967±0.001+0.043
−0.053 2nd pixel layer 0.944±0.002+0.046 −0.054 3rd pixel layer 0.976±0.003+−00..051060
SCT barrel region
Layer Yield Data/MC
Pixel support frame 1.121±0.006±0.067 Pixel support tube 1.159±0.009±0.061 1st SCT layer 1.042±0.006+−00..058066 2nd SCT layer 1.100±0.013+−00..079086
Pixel forward region
Layer Yield Data/MC
1st pixel disk 1.023±0.009+−00..054062 2nd pixel disk 0.975±0.011+−00..049057 3rd pixel disk 0.937±0.015+−00..049057
Table 8. The ratios of vertex yields in data to those in MC simulation for the silicon sensor element in
the pixel and SCT modules, measured using the local coordinate transformations. The first uncertainty is statistical and the second systematic. The radius andzof the various regions are defined in table1.
Pixel barrel region
Module location Yield Data/MC 1st pixel layer 0.999±0.003+−00..045054 2nd pixel layer 0.945±0.004+−00..045054 3rd pixel layer 0.957±0.006+−00..050058
SCT barrel region
[image:24.595.206.390.550.716.2]2016 JINST 11 P11020
7 Conclusions
This paper presents an updated study of the material in the ATLAS ID using secondary hadronic interactions in 19 nb−1of√
s= 7 TeV LHCppcollision events collected with a minimum-bias trigger. The technique described here exploits primary particle interactions with ID material to reconstruct secondary vertices from the outgoing tracks. Since the incident primary particles have low to medium energies, the outgoing tracks tend to have large opening angles between them, thereby improving spatial resolutions. A major improvement is due to second-pass track reconstruction that increases the efficiency of reconstructing secondary tracks, especially those arising from vertices far from the primary vertex.
These secondary vertices are reconstructed using an inclusive vertex-finding and fitting al-gorithm, and they have good spatial resolution in both the longitudinal and transverse directions. The resulting resolutions are significantly better than the resolution of vertices produced by photon conversions, which are routinely used for material estimation. This leads to a precise ‘radiography’ of the as-built ID and facilitates comparison with the implementation of the detector geometry in simulation.
Many sources of systematic uncertainty have been investigated, viz., secondary track and vertex reconstruction efficiencies,pTandηdistributions of primary particles that interact in the ID, and the
accuracy of hadronic interaction modelling in GEANT4. Experimental systematic uncertainties, i.e., those arising from track and vertex reconstruction, are estimated from data in this analysis. Differences between data and simulation in the pT andη distributions of the primary tracks are
accounted for via a reweighting procedure. Uncertainties in the modelling of hadronic interactions in GEANT4 are studied by comparing various models.
Due to the increase in vertex reconstruction efficiency from second-pass track reconstruction, this study explores a large fiducial volume (0.7 m3). The second barrel SCT layer and the pixel
end-cap disks have been investigated for the first time with this technique. Moreover, this paper includes ‘radiography’ images of the SCT modules, which had not been studied previously. Agreement between data and simulation is good to within the experimental uncertainties, which are about 5%.
Acknowledgments
We thank CERN for the very successful operation of the LHC, as well as the support staff from our institutions without whom ATLAS could not be operated efficiently.
2016 JINST 11 P11020
and Cantons of Bern and Geneva, Switzerland; MOST, Taiwan; TAEK, Turkey; STFC, UnitedKingdom; DOE and NSF, United States of America. In addition, individual groups and members have received support from BCKDF, the Canada Council, CANARIE, CRC, Compute Canada, FQRNT, and the Ontario Innovation Trust, Canada; EPLANET, ERC, FP7, Horizon 2020 and Marie Skłodowska-Curie Actions, European Union; Investissements d’Avenir Labex and Idex, ANR, Région Auvergne and Fondation Partager le Savoir, France; DFG and AvH Foundation, Germany; Herakleitos, Thales and Aristeia programmes co-financed by EU-ESF and the Greek NSRF; BSF, GIF and Minerva, Israel; BRF, Norway; Generalitat de Catalunya, Generalitat Valenciana, Spain; the Royal Society and Leverhulme Trust, United Kingdom.
The crucial computing support from all WLCG partners is acknowledged gratefully, in partic-ular from CERN, the ATLAS Tier-1 facilities at TRIUMF (Canada), NDGF (Denmark, Norway, Sweden), CC-IN2P3 (France), KIT/GridKA (Germany), INFN-CNAF (Italy), NL-T1 (Netherlands), PIC (Spain), ASGC (Taiwan), RAL (U.K.) and BNL (U.S.A.), the Tier-2 facilities worldwide and large non-WLCG resource providers. Major contributors of computing resources are listed in ref. [17].
References
[1] ATLAS collaboration, G. Aad et al.,The ATLAS Experiment at the CERN Large Hadron Collider,
2008JINST3S08003.
[2] ATLAS collaboration, G. Aad et al.,A study of the material in the ATLAS inner detector using secondary hadronic interactions,2012JINST 7P01013[arXiv:1110.6191].
[3] ATLAS collaboration, G. Aad et al.,Search for massive, long-lived particles using multitrack displaced vertices or displaced lepton pairs in pp collisions at√s=8TeV with the ATLAS detector,
Phys. Rev.D 92(2015) 072004[arXiv:1504.05162].
[4] ATLAS collaboration, G. Aad et al.,Search for long-lived, weakly interacting particles that decay to displaced hadronic jets in proton-proton collisions at√s=8TeV with the ATLAS detector,Phys. Rev. D 92(2015) 012010[arXiv:1504.03634].
[5] ATLAS collaboration, G. Aad et al.,Expected Performance of the ATLAS Experiment - Detector, Trigger and Physics,arXiv:0901.0512.
[6] ATLAS collaboration, G. Aad et al.,Charged-particle multiplicities in pp interactions measured with the ATLAS detector at the LHC,New J. Phys.13(2011) 053033[arXiv:1012.5104].
[7] T. Sjöstrand et al.,An introduction to PYTHIA 8.2,Comput. Phys. Commun.191(2015) 159
[arXiv:1410.3012].
[8] A.D. Martin, W.J. Stirling, R.S. Thorne and G. Watt,Parton distributions for the LHC,Eur. Phys. J.C 63(2009) 189[arXiv:0901.0002].
[9] ATLAS collaboration,Further ATLAS tunes of PYTHIA6 and PYTHIA 8,ATL-PHYS-PUB-2011-014
(2011).
[10] GEANT4 collaboration, S. Agostinelli et al.,GEANT4: A simulation toolkit,Nucl. Instrum. Meth.A 506(2003) 250.
2016 JINST 11 P11020
[12] ATLAS collaboration, G. Aad et al.,The ATLAS Simulation Infrastructure,Eur. Phys. J.C 70(2010)823[arXiv:1005.4568].
[13] G. Piacquadio, K. Prokofiev, A. Wildauer,Primary vertex reconstruction in the ATLAS experiment at
LHC,J. Phys. Conf. Ser.119(2008) 032033.
[14] P. Billoir and S. Qian,Fast vertex fitting with a local parametrization of tracks,Nucl. Instrum. Meth.
A 311(1992) 139.
[15] S.R Das,On a New Approach for Finding All the Modified Cut-Sets in an Incompatibility Graph,
IEEE Trans. Comp.C 22(1973) 187.
[16] T. Pierog, I. Karpenko, J.M. Katzy, E. Yatsenko and K. Werner,EPOS LHC: Test of collective hadronization with data measured at the CERN Large Hadron Collider,Phys. Rev.C 92(2015)
034906[arXiv:1306.0121].
[17] ATLAS collaboration,ATLAS Computing Acknowledgements 2016–2017,ATL-GEN-PUB-2016-002
2016 JINST 11 P11020
The ATLAS collaboration
M. Aaboud135d, G. Aad86, B. Abbott113, J. Abdallah64, O. Abdinov12, B. Abeloos117, R. Aben107,
O.S. AbouZeid137, N.L. Abraham149, H. Abramowicz153, H. Abreu152, R. Abreu116, Y. Abulaiti146a,146b,
B.S. Acharya163a,163b,a, L. Adamczyk40a, D.L. Adams27, J. Adelman108, S. Adomeit100, T. Adye131,
A.A. Affolder75, T. Agatonovic-Jovin14, J. Agricola56, J.A. Aguilar-Saavedra126a,126f, S.P. Ahlen24,
F. Ahmadov66,b, G. Aielli133a,133b, H. Akerstedt146a,146b, T.P.A. Åkesson82, A.V. Akimov96,
G.L. Alberghi22a,22b, J. Albert168, S. Albrand57, M.J. Alconada Verzini72, M. Aleksa32, I.N. Aleksandrov66,
C. Alexa28b, G. Alexander153, T. Alexopoulos10, M. Alhroob113, B. Ali128, M. Aliev74a,74b, G. Alimonti92a,
J. Alison33, S.P. Alkire37, B.M.M. Allbrooke149, B.W. Allen116, P.P. Allport19, A. Aloisio104a,104b,
A. Alonso38, F. Alonso72, C. Alpigiani138, M. Alstaty86, B. Alvarez Gonzalez32, D. Álvarez Piqueras166,
M.G. Alviggi104a,104b, B.T. Amadio16, K. Amako67, Y. Amaral Coutinho26a, C. Amelung25, D. Amidei90,
S.P. Amor Dos Santos126a,126c, A. Amorim126a,126b, S. Amoroso32, G. Amundsen25, C. Anastopoulos139,
L.S. Ancu51, N. Andari19, T. Andeen11, C.F. Anders59b, G. Anders32, J.K. Anders75, K.J. Anderson33,
A. Andreazza92a,92b, V. Andrei59a, S. Angelidakis9, I. Angelozzi107, P. Anger46, A. Angerami37,
F. Anghinolfi32, A.V. Anisenkov109,c, N. Anjos13, A. Annovi124a,124b, C. Antel59a, M. Antonelli49,
A. Antonov98,∗, F. Anulli132a, M. Aoki67, L. Aperio Bella19, G. Arabidze91, Y. Arai67, J.P. Araque126a,
A.T.H. Arce47, F.A. Arduh72, J-F. Arguin95, S. Argyropoulos64, M. Arik20a, A.J. Armbruster143,
L.J. Armitage77, O. Arnaez32, H. Arnold50, M. Arratia30, O. Arslan23, A. Artamonov97, G. Artoni120,
S. Artz84, S. Asai155, N. Asbah44, A. Ashkenazi153, B. Åsman146a,146b, L. Asquith149, K. Assamagan27,
R. Astalos144a, M. Atkinson165, N.B. Atlay141, K. Augsten128, G. Avolio32, B. Axen16, M.K. Ayoub117,
G. Azuelos95,d, M.A. Baak32, A.E. Baas59a, M.J. Baca19, H. Bachacou136, K. Bachas74a,74b, M. Backes148,
M. Backhaus32, P. Bagiacchi132a,132b, P. Bagnaia132a,132b, Y. Bai35a, J.T. Baines131, O.K. Baker175,
E.M. Baldin109,c, P. Balek171, T. Balestri148, F. Balli136, W.K. Balunas122, E. Banas41, Sw. Banerjee172,e,
A.A.E. Bannoura174, L. Barak32, E.L. Barberio89, D. Barberis52a,52b, M. Barbero86, T. Barillari101,
M-S Barisits32, T. Barklow143, N. Barlow30, S.L. Barnes85, B.M. Barnett131, R.M. Barnett16,
Z. Barnovska5, A. Baroncelli134a, G. Barone25, A.J. Barr120, L. Barranco Navarro166, F. Barreiro83,
J. Barreiro Guimarães da Costa35a, R. Bartoldus143, A.E. Barton73, P. Bartos144a, A. Basalaev123,
A. Bassalat117, R.L. Bates55, S.J. Batista158, J.R. Batley30, M. Battaglia137, M. Bauce132a,132b, F. Bauer136,
H.S. Bawa143,f, J.B. Beacham111, M.D. Beattie73, T. Beau81, P.H. Beauchemin161, P. Bechtle23,
H.P. Beck18,g, K. Becker120, M. Becker84, M. Beckingham169, C. Becot110, A.J. Beddall20e, A. Beddall20b,
V.A. Bednyakov66, M. Bedognetti107, C.P. Bee148, L.J. Beemster107, T.A. Beermann32, M. Begel27,
J.K. Behr44, C. Belanger-Champagne88, A.S. Bell79, G. Bella153, L. Bellagamba22a, A. Bellerive31,
M. Bellomo87, K. Belotskiy98, O. Beltramello32, N.L. Belyaev98, O. Benary153, D. Benchekroun135a,
M. Bender100, K. Bendtz146a,146b, N. Benekos10, Y. Benhammou153, E. Benhar Noccioli175, J. Benitez64,
D.P. Benjamin47, J.R. Bensinger25, S. Bentvelsen107, L. Beresford120, M. Beretta49, D. Berge107,
E. Bergeaas Kuutmann164, N. Berger5, J. Beringer16, S. Berlendis57, N.R. Bernard87, C. Bernius110,
F.U. Bernlochner23, T. Berry78, P. Berta129, C. Bertella84, G. Bertoli146a,146b, F. Bertolucci124a,124b,
I.A. Bertram73, C. Bertsche44, D. Bertsche113, G.J. Besjes38, O. Bessidskaia Bylund146a,146b, M. Bessner44,
N. Besson136, C. Betancourt50, A. Bethani57, S. Bethke101, A.J. Bevan77, R.M. Bianchi125, L. Bianchini25,
M. Bianco32, O. Biebel100, D. Biedermann17, R. Bielski85, N.V. Biesuz124a,124b, M. Biglietti134a,
J. Bilbao De Mendizabal51, T.R.V. Billoud95, H. Bilokon49, M. Bindi56, S. Binet117, A. Bingul20b,
C. Bini132a,132b, S. Biondi22a,22b, T. Bisanz56, D.M. Bjergaard47, C.W. Black150, J.E. Black143,
K.M. Black24, D. Blackburn138, R.E. Blair6, J.-B. Blanchard136, T. Blazek144a, I. Bloch44, C. Blocker25,
W. Blum84,∗, U. Blumenschein56, S. Blunier34a, G.J. Bobbink107, V.S. Bobrovnikov109,c, S.S. Bocchetta82,
A. Bocci47, C. Bock100, M. Boehler50, D. Boerner174, J.A. Bogaerts32, D. Bogavac14,
A.G. Bogdanchikov109, C. Bohm146a, V. Boisvert78, P. Bokan14, T. Bold40a, A.S. Boldyrev163a,163c,
2016 JINST 11 P11020
D. Bortoletto120, V. Bortolotto61a,61b,61c, K. Bos107, D. Boscherini22a, M. Bosman13, J.D. Bossio Sola29,J. Boudreau125, J. Bouffard2, E.V. Bouhova-Thacker73, D. Boumediene36, C. Bourdarios117, S.K. Boutle55,
A. Boveia32, J. Boyd32, I.R. Boyko66, J. Bracinik19, A. Brandt8, G. Brandt56, O. Brandt59a, U. Bratzler156,
B. Brau87, J.E. Brau116, H.M. Braun174,∗, W.D. Breaden Madden55, K. Brendlinger122, A.J. Brennan89,
L. Brenner107, R. Brenner164, S. Bressler171, T.M. Bristow48, D. Britton55, D. Britzger44, F.M. Brochu30,
I. Brock23, R. Brock91, G. Brooijmans37, T. Brooks78, W.K. Brooks34b, J. Brosamer16, E. Brost108,
J.H Broughton19, P.A. Bruckman de Renstrom41, D. Bruncko144b, R. Bruneliere50, A. Bruni22a, G. Bruni22a,
L.S. Bruni107, BH Brunt30, M. Bruschi22a, N. Bruscino23, P. Bryant33, L. Bryngemark82, T. Buanes15,
Q. Buat142, P. Buchholz141, A.G. Buckley55, I.A. Budagov66, F. Buehrer50, M.K. Bugge119, O. Bulekov98,
D. Bullock8, H. Burckhart32, S. Burdin75, C.D. Burgard50, B. Burghgrave108, K. Burka41, S. Burke131,
I. Burmeister45, J.T.P. Burr120, E. Busato36, D. Büscher50, V. Büscher84, P. Bussey55, J.M. Butler24,
C.M. Buttar55, J.M. Butterworth79, P. Butti107, W. Buttinger27, A. Buzatu55, A.R. Buzykaev109,c,
S. Cabrera Urbán166, D. Caforio128, V.M. Cairo39a,39b, O. Cakir4a, N. Calace51, P. Calafiura16,
A. Calandri86, G. Calderini81, P. Calfayan100, G. Callea39a,39b, L.P. Caloba26a, S. Calvente Lopez83,
D. Calvet36, S. Calvet36, T.P. Calvet86, R. Camacho Toro33, S. Camarda32, P. Camarri133a,133b,
D. Cameron119, R. Caminal Armadans165, C. Camincher57, S. Campana32, M. Campanelli79,
A. Camplani92a,92b, A. Campoverde141, V. Canale104a,104b, A. Canepa159a, M. Cano Bret35e, J. Cantero114,
R. Cantrill126a, T. Cao42, M.D.M. Capeans Garrido32, I. Caprini28b, M. Caprini28b, M. Capua39a,39b,
R. Caputo84, R.M. Carbone37, R. Cardarelli133a, F. Cardillo50, I. Carli129, T. Carli32, G. Carlino104a,
L. Carminati92a,92b, S. Caron106, E. Carquin34b, G.D. Carrillo-Montoya32, J.R. Carter30, J. Carvalho126a,126c,
D. Casadei19, M.P. Casado13,h, M. Casolino13, D.W. Casper162, E. Castaneda-Miranda145a, R. Castelijn107,
A. Castelli107, V. Castillo Gimenez166, N.F. Castro126a,i, A. Catinaccio32, J.R. Catmore119, A. Cattai32,
J. Caudron23, V. Cavaliere165, E. Cavallaro13, D. Cavalli92a, M. Cavalli-Sforza13, V. Cavasinni124a,124b,
F. Ceradini134a,134b, L. Cerda Alberich166, B.C. Cerio47, A.S. Cerqueira26b, A. Cerri149, L. Cerrito133a,133b,
F. Cerutti16, M. Cerv32, A. Cervelli18, S.A. Cetin20d, A. Chafaq135a, D. Chakraborty108, S.K. Chan58,
Y.L. Chan61a, P. Chang165, J.D. Chapman30, D.G. Charlton19, A. Chatterjee51, C.C. Chau158,
C.A. Chavez Barajas149, S. Che111, S. Cheatham73, A. Chegwidden91, S. Chekanov6, S.V. Chekulaev159a,
G.A. Chelkov66,j, M.A. Chelstowska90, C. Chen65, H. Chen27, K. Chen148, S. Chen35c, S. Chen155,
X. Chen35f, Y. Chen68, H.C. Cheng90, H.J Cheng35a, Y. Cheng33, A. Cheplakov66, E. Cheremushkina130,
R. Cherkaoui El Moursli135e, V. Chernyatin27,∗, E. Cheu7, L. Chevalier136, V. Chiarella49,
G. Chiarelli124a,124b, G. Chiodini74a, A.S. Chisholm19, A. Chitan28b, M.V. Chizhov66, K. Choi62,
A.R. Chomont36, S. Chouridou9, B.K.B. Chow100, V. Christodoulou79, D. Chromek-Burckhart32,
J. Chudoba127, A.J. Chuinard88, J.J. Chwastowski41, L. Chytka115, G. Ciapetti132a,132b, A.K. Ciftci4a,
D. Cinca45, V. Cindro76, I.A. Cioara23, C. Ciocca22a,22b, A. Ciocio16, F. Cirotto104a,104b, Z.H. Citron171,
M. Citterio92a, M. Ciubancan28b, A. Clark51, B.L. Clark58, M.R. Clark37, P.J. Clark48, R.N. Clarke16,
C. Clement146a,146b, Y. Coadou86, M. Cobal163a,163c, A. Coccaro51, J. Cochran65, L. Colasurdo106, B. Cole37,
A.P. Colijn107, J. Collot57, T. Colombo32, G. Compostella101, P. Conde Muiño126a,126b, E. Coniavitis50,
S.H. Connell145b, I.A. Connelly78, V. Consorti50, S. Constantinescu28b, G. Conti32, F. Conventi104a,k,
M. Cooke16, B.D. Cooper79, A.M. Cooper-Sarkar120, K.J.R. Cormier158, T. Cornelissen174,
M. Corradi132a,132b, F. Corriveau88,l, A. Corso-Radu162, A. Cortes-Gonzalez32, G. Cortiana101, G. Costa92a,
M.J. Costa166, D. Costanzo139, G. Cottin30, G. Cowan78, B.E. Cox85, K. Cranmer110, S.J. Crawley55,
G. Cree31, S. Crépé-Renaudin57, F. Crescioli81, W.A. Cribbs146a,146b, M. Crispin Ortuzar120,
M. Cristinziani23, V. Croft106, G. Crosetti39a,39b, A. Cueto83, T. Cuhadar Donszelmann139, J. Cummings175,
M. Curatolo49, J. Cúth84, H. Czirr141, P. Czodrowski3, G. D’amen22a,22b, S. D’Auria55, M. D’Onofrio75,
M.J. Da Cunha Sargedas De Sousa126a,126b, C. Da Via85, W. Dabrowski40a, T. Dado144a, T. Dai90, O. Dale15,
F. Dallaire95, C. Dallapiccola87, M. Dam38, J.R. Dandoy33, N.P. Dang50, A.C. Daniells19, N.S. Dann85,
M. Danninger167, M. Dano Hoffmann136, V. Dao50, G. Darbo52a, S. Darmora8, J. Dassoulas3,
![Figure 1. View of a quadrant of the ID [5] showing each of the major detector elements with their activedimensions and envelopes](https://thumb-us.123doks.com/thumbv2/123dok_us/7802443.170722/6.595.85.510.84.381/figure-view-quadrant-showing-detector-elements-activedimensions-envelopes.webp)