FARM INCOMES IN THE EUROPEAN COMMUNITY
1990/91
including selected results for 1986/87 to 1989/90
***
*
*
*
*
**
*
**
COMMISSION
This document has been prepared for use within the Commission. It does not necessarily represent the Commission's official position.
Cataloguing data can be found at the end of this document.
Luxembourg: Office for Official Publications of the European Communities, 1993
ISBN 92-826-5519-9
© ECSC-EEC-EAEC, Brussels • Luxembourg, 1993
Reproduction is authorized, except for commercial purposes, provided the source is acknowledged.
Commission of the European Communities
FARM INCOMES in the European Community
1990/91
including selected results for 1986/87 to 1989/90
This document has been prepared for use within the Commission. It does not
necessarily represent the Commission's official position.
Copyright ECSC-EEC-EAEC, Brussel - Luxembourg, 1992
FARM INCOMES in the European Community
/ '1990/91
including selected results for
1986/87
to
1989/90
Farm
/
-Accountancy
Data
Network
/Commission of the
European Communities
This report has been prepared by the unit A-3 "Analysis of the Situation of Agricultural
Holdings" of the Directorate General for Agriculture (DG VI). It presents results using
data collected in close collaboration with Member States in the Farm Accountancy
Data Network. The report is edited by Bernard Brookes.
For further information contact:
FADN
DG VI-A-3 LOI 120
Commission of the European Communities
Rue de Ia loi 200
B-1049 BRUSSELS BELGIUM
Text and tables completed 19 November 1992.
French and Italian.
telephone: +32 2 295 5987
+32 2 295 9062
+32 2 296 1406
fax:
+32 2 296 5991
IMPORTANT!
You have acquired a copy of Farm Incomes 1990/91, which is available also in French, German and Italian versions. This report presents FADN results in graph and table form. The main body of results refer to the accounting year 1990/91 . Inevitably it takes time for accounting data to be collected and corrected, and the collection periods end with a spread of months. It is our aim in future editions to make the results available as soon as possible after the end of the accounting year.
In this edition there are detailed tables in section 4 which follow the pattern of the earlier publications of results only. In this report considerable supplementary material (such as general information on the survey, graphs and structural information) have been added. In the next edition it is intended to provide this block of detailed tables on diskette rather than in printed form.
For designing the next report, it would help us if you reply, even partially, to
the following questions.
You can reply in any official language of the
Community.
• Where are you active?
in an official economic or statistical service: analysis
in an official economic or statistical service: research
in a farmers' or producers' organisation
in university research
in third level teaching
in private Consultancy work
in another activity {please state)
• Would you like to see any general additions to the report?
• Could you suggest any parts of the report which could be left out?
• Are you interested in obtaining
specific
infonnation additional to that included in this report?(e.g. additional distributions/ more detailed result variables; on diskette, or directly accessible on
a data base). You can give a detailed answer
if
you wish.l• What is your mother tongue?
• In which other language, if any, would you prefer this report?
• Do you ever refer to F ADN infonnation in the report "The Agricultural Situation in the Community"?
text
• Space for any other comments you may have:
Please return this page to:
Commission of the European Communities F ADN/RICA (DG VI-A-3)
Rue de Ia Loi 200
B-1049 BRUSSELS BELGIUM
tables
fax: .. 32 2 296 5991
Thank you for your cooperation.
1
CONTENTS
1.
Introduction
The structure of farming in the Community and the field of survey of the Farm Accountancy Data Network.
2. Income results
2. 1. comparison of 1 990/91 and 1 989/90.
2.2. distribution of incomes in 1990/91
3.
F•m incomes: medium-term trends (1986/7- 1990/91)4. Detailed results 1990/91
4.1. by type of farming
4.2. by economic size of farm
4.3. by agricultural area of farm
4.4. by income per head
5. Methodology and definitions
5.1. income indicators.
5.2. types of farming and economic size of farm (typology)
5.3. weighting and raising of results
5.4. glossary of result items
5.5. exchange rates applied to FADN
6. References
6.1. publications
6.2. legislation
6.3. addresses of the FADN in Member States.
7. Ust of graphs and tables
PAGES
2
3-7
8- 15
16- 22
23-69
70,72-123
70,124-175
71,176-188
71' 189 - 201
202- 205
206- 211
212
213- 216
217
218
219
221
2
Farm Incomes 1990/91 26-Aug-92INTRODUCTION.
The agricultural sector in the European Community has great diversity of structure and
production patterns.
Both very large farms, perhaps covering several thousand
hectares and with large investments in machinery and equipment, and the smallest
almost subsistence units with small parcels of land, scarcely sufficient to provide an
income for the farm family, fall into the European agricultural spectrum. This diversity
makes it important to provide information about the structure of farming and the
different situation of farms, and in particular concerning income and welfare.
Some
farms behave financially as medium size businesses, whilst others could be compared
to one-man businesses: the comparison of a paper-mill to a newspaper seller would
be of the same scale.
Of those farms large enough to fall into the field of interest of the EC Farm
Accountancy Data Network (the smallest farms are for practical reasons difficult to
include, as a basic requirement is the keeping of accounts), the largest 10% have a
turnover 6 times as great as the smallest 10%.
This and other differences can be
explored using the tables and graphs presented further on in this report.
The report provides detailed farm output, cost and income results for a wide variety of
farm groups (such as different farm sizes and different production types) in the
European Community and Member States, using data from the Farm Accountancy
Data Network (FADN).
The Network collects farm accounts data, using the same
returning form, from almost 59000 (in 1990/91) businesses .
Detailed results are
given for 1989/90, and summary results for 1990/91 and earlier years back to 1986/7
to make comparisons possible. Results are given in real terms to make comparisons
even easier ..
More emphasis is put on graphs than in previous reports from FADN.
The
accompanying text is intended only to guide the reader through the graphs and the
tables serve to give additional detail.
In order to produce average results for groups or countries, and because of different
rates of sampling, individual farm accounts results are weighted during calculation by
the Commission Services. Particular attention is drawn to the revision of the weights
used compared to earlier reports.
This means that results for 1986/7 in "Economic
Results of Agricultural Holdings No. 5 - 1986/7", published in 1990, will differ from
results for the same year in this report, and will not be strictly comparable with them.
Longer time series of results, some from as far back as 1981/2, will be available in the
forthcoming publication "Farm Incomes in the European Community in the 1980s".
NOTE:
Results from FADN for Member States may differ from those produced by national
farm accounts networks due to differences in methodology and calcultation.
Farm Incomes 1 990/91 section 1 : structure of farming
3
1. THE STRUCTURE OF FARMING IN THE COMMUNITY
THE FIELD OF SURVEY OF THE FARM ACCOUNTANCY DATA
NETWORK
According to the latest EUROSTAT Farm Structure Survey results there were 8,6 million farms in the Community in 1987, with an average size of 13,4 hectares(1) (see table 1.2). There is a wide range of average farm size, from 4,0 hectares in Greece to 67,2 hectares in the United Kingdom.
The FADN field of survey covers the so-called professional farms in the Farm Structure Survey, and so excludes the smallest (and often part-time) farms below the FADN "thresholds" (shown in tables 1.1 and 1.2). This is particularly the case in Italy and Spain (see graph 1 A). The average size of farm in the Community FADN field of survey is 21 ,4 hectares. The average size in Member States ranges from 6,4 hectares in Greece to 97,5 hectares in the U.K.
The average FADN farm is closest to the average "all farms" (see table 1 .2) in Denmark (average area is 5% higher) and furthest in Italy (average area 66% higher). The average economic size of farm and labour input (in Annual Work Units) per farm are correspondingly greater for farms in the FADN field of survey (see table 1 .1 ).
Graphs 1 A and 1 B show the FADN coverage (see table 1.1 for the corresponding numbers). Although coverage of farms is apparently poor (graph 1 A) the coverage of agricultural value added on farms, as represented by the coverage of the total of standard gross margins, is good (94%). In any case the FADN sample is selected in the first instance to cover agricultural production and not the very small holdings which contribute little to aggregate agricultural production.
The farm size distributions of both the Farm Structure Survey and FADN are given in table 1 .3, together with an indication of the coverage of the FADN field of survey in each Member State.
4
section 1 : structure of farming Farm Incomes 1 990/91 2 June, 1992Graph 1. THE FADN FIELD
OF
SURVEY
A. FADN farms as share of total farms (FSS)
BEL ::::
DAN
\Ill
farms in FADN field of survey \
DEU
ELL
ESP
FRA
IRE
ITA
LUX
NED
POR
UKI
0
0.5
1
1.5
2
2.5
number of farms (millions)
\890\COVER.drw \8890\covera. ch 1
BEL
DAN
DEU
ELL
ESP
FAA
IRE
ITA
LUX
NED
POR
l)KI
0
B. Value added in FADN field of survey as share of total
(total SGMs in FADN as share of total in FSS)
[ i1J
farms in F ADN field of survey5
10
15
20
total of standard gross margins (million ESU)
22 June, 1992
[TABLE 1.1
Member State and threshold
(in European Size Units)
BELGIUM (12)
DANMARK (4}
DEUTSCHLAND (8)
ELLAS (2)
ESPANA (2}
FRANCE (8}
IRELAND (2)
ITALY (2)
LUXEMBOURG (8)
NEDERLAND (16)
PORTUGAL ( 1) *
U.K. (8) * *
EUR 12
29104/92
Farm Incomes 1990/91 section 1 : structure of farming
5
COVERAGE OF THE FADN FIELD OF SURVEY
with results from the 1987 Farm Structure Survey
number of farms in Coverage of FADN field Farm Structure Survey
%
%
% %total FADN field total total total total farms ESU UAA AWU
92468 52493 56.8 92.5 88.3 77.5
86940 81560 93.8 99.5 98.7 98.5
705083 381113 54.1 91.5 87.3 77.9
948230 502230 53.0 90.5 84.0 80.2
1772650 867224 48.9 91.5 88.9 81.3
982157 614495 62.6 94.6 91.1 83.3
216023 140596 65.1 97.0 86.0 85.0
2773859 1487968 53.6 94.2 89.6 79.8
4163 2645 63.5 94.4 92.0 83.0
132013 94307 71.4 94.8 90.5 85.6
631498 470241 74.5 92.7 93.8 81.7
249270 154770 62.1 98.6 90.1 83.7
8594354 4849642 56.4 94.3 89.7 81.4
*
as the size class boundary 1 ESU was not available for results other than holdings, estimates of half the total ESU, UAA and AWU in the lowest size class (0 - 2 ESU) have been taken.* *
threshold 4ESU for Northern Ireland only6 section 1 : structure of farming Farm Incomes 1 990/91 2 June, 1992
jTABLE 1.2 THE FADN FIELD OF SURVEY AND ALL FARMS COMPARED
Results from the 1987 Farm Structure Survey and FADN (1987 /88)
(1) all holdings surveyed in the 1987 Farm Structure Survey
(2) all holdings in the FADN field of observation (i.e. above the threshold). (3) "farms represented" in the FADN results (1987/88).
Member State threshold no. of ave ESU/ ave UAA/ ave AWU/ (in ESU) farms farm farm farm
BELGIUM 12 all farms (1) 92468 23.9 14.8 1.07 FADN field (2) 52493 39.0 23.0 1.47 FADN represented (3) 52437 46.2 24.2 1.70 DAN MARK 4 all farms (1) 86940 34.9 32.2 1.31
FADN field (2) 81560 37.0 33.9 1.37 FADN represented (3) 81362 45.4 33.8 1.10 DEUTSCHLAND 8 all farms (1) 705083 16.7 16.8 1.21 FADN field (2) 381113 28.3 27.1 1.74 FADN represented (3) 356657 35.0 29.1 1.71 ELLAS 2 all farms (1) 948230 4.1 4.0 0.89 FADN field (2) 502230 7.0 6.4 1.35 FADN represented (3) 498374 8.6 6.3 1.66 ESPANA 2 all farms (1) 1772650 5.3 13.9 0.92 FADN field (2) 867224 9.9 25.3 1.52 FADN represented (3) 602697 10.4 22.3 , .21 FRANCE 8 all farms (1) 982157 21.8 28.6 1.49
FADN field (2) 614495 33.0 41.6 1.98 FADN represented (3) 572113 38.3 41.3 1.63 IRELAND 2 all farms (1) 216023 8.8 22.7 1.18 FADN field (2) 140596 13.2 30.0 1.54 FADN represented (3) 139155 16.4 37.1 1.28 ITALY 2 all farms ( 1) 2773859 7.4 5.6 0.77 FADN field (2) 1487968 13.0 9.3 1.14 FADN represented (3) 11 27350 , 6.4 10.5 1.55 LUXEMBOURG 8 all farms (1) 4163 20.0 30.4 1.61 FADN field (2) 2645 29.7 44.0 2.10 FADN represented (3) 2438 40.2 48.9 1.69 NEDERLAND 16 all farms (1) 132013 45.2 15.3 1.77 FADN field (2) 94307 60.0 19.4 2.12 FADN represented (3) 94366 79.0 21.2 1.97 PORTUGAL 1 * all farms (1) 631498 3.9 5.3 1.48 FADN field (2) 470241 4.8 6.6 1.63 FADN represented (3) 213468 6.6 10.8 1.93 U.K. 8** allfarms(1) 249270 53.1 67.2 2.09 FADN field (2) 154770 84.3 9?.5 2.82 FADN represented (3) 132359 85.7 95.6 2.58
EUR 12 all farms (1) 8594354 11.2 13.4 1.06 FADN field (2) 4849642 18.7 21.3 1.52 FADN represented (3) 3872776 23.8 22.9 1.59
* as the size class boundary 1 ESU was not available for results other than holdings, estimates of half the total ESU, UAA and AWU in the lowest size class (0- 2) ESU have been taken.
* * threshold 4 ESU for Northern Ireland only
Farm Incomes 1990/91 section 1 : structure of farming
7
TABLE
1.3
COVERAGE AND FARM
SIZE
A numbers of farms Cthousands) in each size class
IJize cl••-• in the FADN field of •urvey
Economic Size
of farm >0-<2 2-<4 4-<8 8-<12 12-< 16 16-<40 40-<100 >•100 all FADN
(ESU} sizea field
BELGIUM 14.9 8.2 9.9 7.0 8.3 28.'5 15.9 . 1.9 92.6 52.6
DANMARK 0.5 4.9 12.8 9.1 • 7.2 27.0 21.0 . 4.6 86.9 SUi
DEUTSCHLAND 134.1 82.7 107.1 ·11+~ 53.7 186.$ . 04.4. 5~~ 705.0 381.1
ELLAS 446.0 t88.9 176.1 72.1 31.3 31.8 1.9 0.2 948.3 502.3
ESPANA 905.4 330.3 264.0. 108.5 54.5 84~4 20.0 5.5 1772.6 887+:.1!
FRANCE 152.4 91.7 123.3 98.0 81.0 293.4 120.7 21.2 981.7. 614.3
IRELAND 75.4 38.2 35.4 18.3 12.8 28.1 1.1. 0.8 216.0 140 .. 8
IT ALIA 1285.9 540.9 4l3.3 171~4 92.4 187.8
. eo.o·
22.1 2773.8 1487.9LUXEMBOURG 0.60 0.44 0.48 0.31 0.29 1.43 0.6t . 0.01 4.2 2.7
NEDERLAND 0.1 5.4 14.7 9.9 7.6. 36*0 48.2 10.1 132.0 94.3
PORTUGAL• 343.0 150.9 84.0 24.7 10.4 13.5 3.7. 1.2 631.4 470.2
U.K.•• 56.8 21.0 25.0 15.8 .. 12.3 49.0 46.() 23.4 249.3 153.0
EUR12 3415.1 1463.5 1265.9 606.7 369.8 966.8 409.6 96.3 8593.8 4847.6
COVERAGE AND FARM SIZE
B total of standard gross margins••• Cthousands ESU) in each size class
IJize cla•H• in the FADN field of aurvey
Economic Size
of farm >0-<2 2-<4 4-<8 8-<12 12-< 16 16-<40 40-<100 >=100 all FADN
IESU} sizea field
BELGIUM 14.5 23.8 58.1 69.6 87.8 782.2 913.2 282.4 2211.4 2045.4
DANMARK 0.7 15.8 74.1 90.5 99.7 716.8 1274.9 758.2 3030.7 2979.8
DEUTSCHLAND 138.3 242.7 626.1 708.2 748.6 4805.3 3545.5 992 11806.7 10799.6
ELLAS 366.6 544 1001.9 699.6 428.1 700.6. 104.8 31.'5 3878.2 3511.6
ESPANA 803 946.5 1492.7 1080.2 751.3 2009.6 1178.5 1162.6 9404.4 8601.4
FRANCE 162 266.6 720.9 972.2 11a0.9 7558 7055.5 3588.7 21454.8 20305.3
IRELAND 58.1 111.2 205.5 178.7 177.1 893.3 398.5 85.5 1907.9 1849.8
IT ALIA 1186.2 1551 2317 1682.8 1275.7 4565.8 3564.3. 4439.7 20582.3 19396.1
LUXEMBOURG 0.6 1.28 2.79 3.03 4.1 39.48 31.39 0.8 83.3 78.6
NEDERLAND 0.1 17.7 86.7 98.1 105.9 1001.1 2973.6 1883.5 5966.7 5659.2
PORTUGAL• 358.7 425.1 464.8 238.7 143.1 318.8 219 272.6 2440.8 2261_li
U.K.•• 31.6 63.4 153.2 167.1 183.2 1421 3117.9 5371.5 10508.9 10294.6
EUR12 3120.4 4209.08 7203.79 5968.73 5136.3 24591.78 24377.19 18668.8 93276.1 87781.9
farms over 1 ESU are included in the field of survey in Portugal; the total SGMs for the FADN field is an estimate. all farms over 4 ESU for Northern Ireland only are included in the field of survey.
• • • s- (explanation SGMe in 5.2)
source: EUROSTAT Farm Structure Survey 1987.
[image:17.576.72.492.514.709.2]8
section 2: income results Farm Incomes 1990/912. INCOME RESULTS.
2.1. COMPARISON OF 1990/91 AND 1989/90.
The graphs which follow (pages 11 to 13) show the changes for 1990/91 as compared to 1989/90.
Tables of results in real terms, for the above years and earlier years going back to 1986/87, (table 3.2) are given at the end of section 3 (pages 50 to 69).
All results are treated in real terms, with the absolute figures in ECU at 1990 values (see table 3.1).
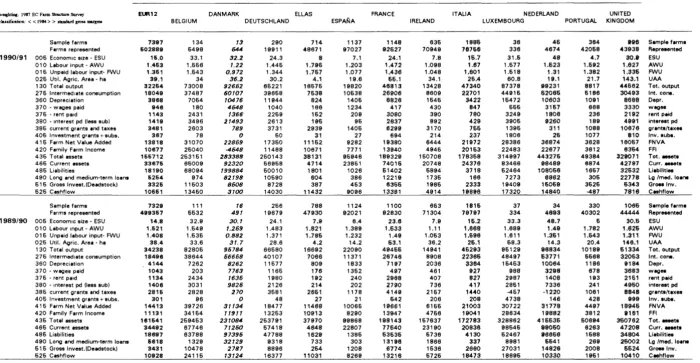
INCOMES
Between 1989/90 and 1990/91 the average income (Family Farm Income or FFI) per farm in the FADN fell by 11% in real terms. The value of output dropped (by 6%) and input costs were not sufficiently reduced to maintain incomes (intermediate consumption goods and the average depreciation charge both decreased 4%, the sum of rent, wages and interest paid, by 3%).
Changes in income ranged from nearly 60% for Denmark to a small (1 %) increase in France. Portuguese farms experienced a large fall of nearly 27%; those in Belgium, Germany, Luxembourg and the Netherlands showed falls of between 20% and 25%. Only in France did income remain almost unchanged (a marginal 0.6% increase).
Interestingly the Cash Flow result, which is a closer indicator than Family Farm Income of the cash income that farmers receive, was often less severe than the corresponding change in FFI. The aggregate average fall in Cash Flow for the Community was 6% (as compared to 11% for FFI). Indeed, in France, Cash Flow increased by 7% (whereas FFI was almost unchanged), and most dramatically, in Denmark, Cash Flow remained steady
( +
0.5%) whilst FFI fell by a dramatic 59%. Other notable changes in Cash Flow were in Spain (no change, -8% for FFI), Luxembourg (-15% , -24% for FFI) and the U.K. (-1 0%, -15% for FFI). Results for Cash Flow and Family Farm Income were closest in Greece where both fell appreciably (Cash Flow -10%, FFI -11 %).INCOME AND PRODUCTION TYPE OF FARMING
A key to the production patterns of the types of farming is given in table 5. 1 .
References to income are always to Family Farm Income (FFI), and to output to "total output", which is the final value of all production on the holding.
Farm Incomes 1 990/91 section 2: income results
9
costs. Average incomes of Spanish and U.K. cereal farms increased, by 11% and 17% respectively. In both cases the value of output was actually less than in 1989/90, but this was more than compensated by all-round falls in input costs.
On GENERAL CROPPING farms the average income results was a fall of 11 %. The Danish average moved from a low positive to a negative income result. Large falls in FFI were observed in Portugal (-36%), Germany (-23%) and Belgium (-19%), where there was a general drop in the value of output. Only in Spain (
+
1 %) and the U.K. (+
3%) were there small increases. In the case of Spain the almost unchanged average income situation hid large falls in both output and input values (see table 3.2).HORTICUL TUR£ holdings showed great volatility, changes in income varying between a fall of 56% in Portugal to a rise of nearly 200% in Germany. In Italy, the single most important country in this type group, average income rose by 28%, due especially to increased value of output. The large fall in Portugal may have been influenced by many more small farms falling into this type of farming group, pulling down both average output and income. The average fall in incomes for the Community was 5%.
For VINEYARDS there was a small rise in the average Community result (3%), but considerable difference between countries, with large falls in Germany (-44%) and Luxembourg (-25%). Italian producers experienced almost no change (
+
1 %) and their French counterparts a large rise (+
8%) in average income. German vineyards suffered a 21%
fall in total output, whilst Luxembourg producers, although benefitting from a higher value of output, suffered a very large increase in intermediate consumption costs ( + 49%). French vineyards gained from a modest increase in output.Incomes of OTHER PERMANENT CROPS farms dropped by an average 2%, and most notably in Portugal (-22%), the Netherlands (-37%) and the U.K. (-44%, but on a small sample). Both countries returned large falls in output. French holdings showed a large rise in output and very large upturn in income ( +46%). Incomes fell by an average 6% on Italian farms, due to a small fall in output.
The average Community DAIRY farm suffered a fall in the value of output (-8%) giving an average drop in income of 1 9%. Danish farms reacted most and showed a 36% fall in income, followed by Belgium (fall of 24%), Spain and Ireland (falls of 23%), the U.K. (-22%) and Germany (-21 %). French farms were the important exception and benefitted particularly from an increase in the item "current grants and (net of) taxes" giving almost no change in average income (
+
0. 7%).Incomes of DRYSTOCK farms fell by 4% following a drop in the value of output of 6%. The result would have been worse had not input costs (notably intermediate consumption and depreciation) fallen significantly (by 2.4% and 7% respectively). Hardest hit were farms in the U.K. (-31 %), Belgium (-27%) and Luxembourg (-22%). An average 6% increase in incomes in Italy and 4% in Ireland were recorded. Dutch farms (though a small sample) increased their income by 14%. Average income remained unchanged in France. There the fall in output (-5%) was compensated notably by a 52% increase in "current grants and taxes".
10 section 2: income results Farm Incomes 1990/91
MIXED farms suffered a fall in the value of output (-8%) which led to an average 19% fall
1n .ncome. There was a dramatic fall in Denmark (-71 %), where profit margins are very sensitive (in 1989/90 the value of all inputs represented 85% of the value of output). Large falls in income were recorded also in Luxembourg (-42%), the Netherlands (-31 %), Germany (-28%) and Belgium (-26%). Income falls of between 15% and 20% were recorded in the U.K., Ireland, Greece and Portugal. Farms in Italy (representing 20% of all mixed farms) showed a smaller downturn (-9%). Only in Spain did average income rise (by 4%), due to substantial falls in wage and interest payments, and a much reduced depreciation charge.
ASSETS, LIABILITIES AND INVESTMENT
For the Community TOTAL ASSETS dropped an average 3.7% between 1989/90 and 1990/91. Behind this average were marked falls in Spain (-13%) and Portugal (-12%), whilst no other Member State showed a fall of more than 6%. Changes in CURRENT ASSETS did not follow this trend and the Community average remained unchanged. However movements were very different in Member States, and average values rose sharply (
+
34%) in Italy (total assets by only 1 %) , and fell by 1 5% in the Netherlands (total assets -2%). Average current assets declined also by 7% in both Belgium and the U.K. (total assets fell by 1.5% and 6% respectively).LIABILITIES fell 2.4% overall for the Community. There were improvements (i.e. reductions) of 16% in liabilities in Portugal, 11% in Spain and Italy, and 7% in Germany and the U.K. There was a deterioration (i.e. increase) of 11% in Ireland.
GROSS INVESTMENT was down slightly by an average 3.4%. There was a massive fall of 56% in Spain, and falls of over 5% in Belgium, Denmark, Germany, Italy and Portugal. Only four other countries showed a significant increase in Gross Investment: Greece, by a remarkable 31%, Ireland by 11%, the Netherlands by 9% and the U.K. by 5%.
REAL INCOME BY ECONOMIC SIZE OF FARM 1989/90 TO 1990/91.
NOTE: the proportions of farms in the different economic size classes varies greatly from one Member State to another (certain have no farms in the smallest size classes). See sections 1, 4.2 and 5.2.
As illustrated in graph 2.4 on page 14, the largest farms in the Community showed the greatest average falls in income ( 1 5% as against the all farms average fall of 11 %) . The smallest size groups ("very small" and "small" farms) showed falls which were close to the average for all farms. The "lower medium" size group of farms showed the smallest decline in average income of all the groups (-6%).
Graph 2.1.
20
0
%
(20)
(40)
(SO) EUR12 BELG.
20
%
0(20)
(40)
Farm Incomes 1 990/91 section 2: income results
Real changes in farm results
1989/90
to
1990/91
DAN MARK ELLAS FRANCE IT ALIA NEDERL UK. DEUTSCH. ESPANA IRELAND LUX. PORTUGAL
EUR12 DANMARK ELLAS FRANCE ITALIA NEDERL U.K. BELG. DEUTSCH. ESPANA IRELAND LUX. PORTUGAL
(40) EUR12 DANMARK ELLAS FRANCE ITALIA NEDERL U.K. BELG. DEUTSCH. ESPANA IRELAND LUX. PORTUGAL
bb90\inc90_89.drw diffall.wk3
1 1
Graph
2.2.
Real changes 1989/90
to 1990/91: farm inputs
o/o
20
0
(20)
(40)
o/o
20
···---···---·--··---··---···---5
EUR12 DANMARK ELLAS FRANCE ITALIA NEDERL U.K BELG. DEUTSCH. ESPANA IRELAND LUX. PORTUGAL
____________ ,8 ____ _
---·---···---_(~)__ ___________________________________________________________________________________ __
(40) EUR12 DANMARK ELLAS FRANCE ITALIA NEDERL. U.K.
BELG. DEUTSCH. ESPANA IRELAND LUX. PORTUGAL
\bb90\inp90_89.drW diffall.wk3
o/o
20
(40)
EUR8 DANMARK ELLAS FRANCE ITALIA NEDERL U.K BELG. DEUTSCH. ESPANA IRELAND LUX. PORTUGAL
27
o/o
20
0
(20)
(40) EUR12
(38)
DANMARK ELLAS FRANCE ITALIA NEDERL. UK. BELG. DEUTSCH ESPANA IRELAND LUX. PORTUGAL
12/11/92
UJ (D
(")
...
cs·
:::I
~
s·
(")
0
3 (D
...
(D
en
c
;::;
UJ
'T1
Ql
3
5'
(")
0
3
CD (I) CD CD
0
%
Graph
2.3.
Real changes
1989/90 to 1990/91: farm capital
40 40
~~ ~ ~~~~~~~~~~s:
:1---···---_]~ -~ ~b~~~ ~~~t~ ~~---·--·---
%20 20
0 I s:·:·:·:n &:::::·::6' ... ·.·.·.·v 0
(20)
r
(20)r
\'OJ1
~3 5" ("')
0
(40) I (40) I
I
g
HJR12 DAf.NARK EUAS FRANCE ITAU.\ 1\EDERL U.K EUR12 DANMARK ELLAS FRANCE ITALIA NEDERL U.K. (I) BELG. DEUTSCH. E8PAN4 IRELAN) LUX. PORTUGAL BELG. DEUTSCH. ESPANA IRELAND LUX. PORTUGAL __.
(0 (0
%
::l~:Curre~~S~S~
I
%:~mmuuumm m~:muUIQ:$i~e&i~e:ck)IUUSu :~
CIJ CD
0 I Ailli'"''Y I~ ~ I;~ MjjW' !!''''ll'!'IY ~ ~~:~!:!i H!U!U!'i'lr . . . l~ffi~]~ r1lli1:1:::;i!!J I~ 0 I f./~fJ f./~fl (\(i f.:!/(\ t·-·.·v r:::t.l I'· ··v f:i:!fl r.·.·.y , .... ·.v ~/!f.l , ... ·.·v I
g.
:::::1
,..,
5'
(2o)
r
,.-,
(2o)r
UAJ
I~CD
...
CD (I)
c
(40) I ~
l<TI
I ;
EUR12 DANMARK ELLAS FRANCE ITALIA NEDERL. U.K. (40) . . .
BELG. DEUTSCH. ESPANA IRElAND LU>t PORllJGAl
~--···
... ···•···•··· ...···lli]llil
(,;;;j···U•• ... ··· ...
I-I
EUR12 DANMARK ELLAS FRANCE ITALIA NEDERL. U.K.w
14 section 2: income results Farm Incomes 1 990/91
Graph
2.4.
Changes in farm indicators
1989/90
to
1990/91
ffiill
Total output0
Intermediate consumptionII
Family Farm Income% change in real terms
I
by
type of farming group
I
10
5
0
(5)
(1 0)
(15)
(20)
all types gen. cropping vineyards dairy pigs/poultry
cereals horticulture oth. perm. crops drystock mixed
% change in real terms
10
(20)
All
Very Small
\bb90\tf90_89.ch1 es90_89r.ch1 eurtf/eur_es.wk3
I
by economic size of farm
I
important: see section 4.2
Small Upper Medium Very Large
Lower Medium Large
Farm Incomes 1990/91 section 2: income results
15
2.2. DISTRIBUTION OF INCOMES IN 1990/91
2.2.1. PER CAPITA 11\fCOMES
The distribution of p«3r capita incomes within the Community and Member States
is shown in graph
2.~;,The geographical distribution of per capita incomes over the Member States of the
Community in 1
990/!~1 is shown in map form in graph 2. 6.
The distributions have been calculated for Family Farm Income per Annual Work
Unit of unpaid labour (for further details see section 5.1 ).
Although the graphs take their information only from the FADN field of survey(1 ),
they provide
howeve~ra useful indicator of the income variation both within and
between Member States.
In graph 2.5 most countries show "left-skewed" distributions, that is with a larger
proportion of persons with low incomes.
The extreme case is Portugal, where
over 80% of persons: earned less than 4000 ECU.
Denmark, Greece, Spain and
Italy also have large shares of persons in the lowest income group. The case of
Denmark is special, as a very large proportion of farms have a low Family Farm
Income due only to hiigh interest costs.
France and Germany also have left-skewed, but more gradually falling,
distributions.
In Germany 39% of persons and in France 46% of persons earn
over 12000 ECU.
Belgium and the Netherlands have "right-skewed" income distributions, with a
large proportion of persons in the highest income class (28% with over 32000
ECU in the Netherlands and 21% in Belgium).
This apparent concentration is
exaggerated by the limited number of classes used in the graphs, but it still holds
that a significant share of persons in agriculture earn high incomes in those
countries.
The U.K. shows a "U" shaped distribution, with higher shares of persons in both
the lowest and highest income classes.
The occurrence of as many as 26% of
persons with less than 4000 ECU is very likely due to the farms with financial
difficulties (notably high interest shares in farm costs).
The original results used for the graphs are shown in more detail in table 4.4.
(results by income per head).
Graph
2.5a
(/)
(/)
ctS
(..)
40
Q)
E
0 (..)
c:
-5
30
ctS Q) c:
-
C\1-
'5
20
a.
c:
._
:::J0
~
10
0
Q)
._
ctS .c:
(/)
0
%
44
Distribution of per capita(1) farm incomes(2)
self-employment on professional farms
FADN 1990/91
3
2
2
1
.;
<
4000 8000 - 12000 16000 - 20000 24000 - 28000 32000 - 360004
4000 - 8000 12000 - 16000 20000 - 24000 28000 - 32000
>
36000income class in ECU
(1) Family Farm Income
(2) Annual Work Units of unpaid (family) labour for further explanation see 5.1 16.11.92 \bb90\lnceur tab2_ 3.wk3
C4
a>
n
....
s·
:I
N
s·
n
0
3
a>
"T1 Q)
3
5" ()
0
3
(t)
en
~
<0
(0
0
Graph 2.5b
41FADN 1990/91
DEUTSCHLAND BELQIE I BELQIQUE
27
4
< 4 4-8 8-12 12-18 18-20 20-24 24-211 211-32 32-38 >38
< 4 4-8 8-12 12-18 18-20 20-24 24-211 211-32 32-38 >38
< 4 4-8 8-12 12-18 18-20 20-24 24-211 211-32 32-38 >38
51 "T1
FRANCE Q)
46 rrAUA
3
5'
(")
0
3
< 4 4-8 8·12 12-18 18-20 20-24 24-211 211-32 32-38 >38 en en
0 4 3 2 <.0
< 4 4-8 8-12 12-18 18-20 20-24 24-211 211-32 32-38 >38 <.0
< 4 4-8 8·12 12-18 18-20 20-24 24-211 211-32 32-38 >38 0
-
CD44 LUXEMBOURQ
EUR12
< 4 4-8 8-12 12·18 18-20 20-24 24-28 211-32 32-38 >38 en
CD
< 4 4-8 8-12 12-18 18-20 20-24 24-211 211-32 32-38 >38 (")
< 4 4-8 8-12 12-18 18-20 20-24 24-211 211-32 32-38 >38
...
s·
83 :::::J
UNrrED KJNQDOM N
NEDERLAND
PORTUQAL 31
s·
(")
0
3
CD
..
CD
en
< 4 4-8 8-12 12-18 18-20 20-24 24-28 211-32 32-38 >38 <
4 4-8 8-12 12-18 18-20 20-24 24-211 211-32 32-38 >38 c
::+
CIO
GRAPH
2.6.
EEC 12 -FAMILY FARM INCOME/FWD -ECU
:t:::. LEGEND
1951 - 10688
:::::: 10688-1~25
•
1 ~25-28182•
28H!2-3689~•
36899 - 45638lt'
Share of farms
'
i;Nl\!l!!;l~~~~~'lj:'
'71
24
0
...
00en
(t)
(')
....
o·
:I
I\)
s·
(')
0
3
(t) ~ (t)
en
C:.-;:;
en
-n
Q)
3
5' ()
0
3
ro
en
<.0 <.0
0
Farm Incomes 1 990/91 section 2: income results 19
2. 2. 2. FAMILY FARM INCOME PER FARM (GRAPH 2. 7).
Dividing the FADN farm population into 1 0 equal parts in increasing order of income gives another view of the disparity of incomes (this time per farm incomes) at Community level. Whilst the 1 0% of farms with the lowest incomes have negative incomes, the top 1 0% have incomes of almost 60000 ECU on average and account for 58% of the total output of FADN farms. Although the deciles represent very different proportions of total agricultural output (closely following incomes, as shown by the similarity of the top and middle sections of graph 2. 7), they cover almost equal shares of the agricultural labour input (as measured in Annual Work Units of unpaid labour).
An analysis of the deciles by Member State (see table 2.1, in particular the lower part) shows the large shares of farms of northern European countries in the top deciles (in fact over half the farms in the Benelux countries) and the large shares of farms in Spain, Italy and Portugal in the bottom decile. However there is a special situation in Denmark and the U.K., where a significant proportion of farms fall into the bottom decile (35% of Danish and 20% of U.K. farms). Farms in Greece, despite their small average size, are thickly clustered around the middle income deciles. These observations are reflected in results for the average income per farm in each member State, which are compared in graph 3. 1 in section 3.
Detailed results for the Community, but for a reduced number of groups (5 quintiles rather than 10 deciles), are given in table 2.2.
20
section 2: income results Farm Incomes 1990/91Graph
2. 7.
Deciles of income per farm (FFI)
ECU
60,000
40,000
20,000
0
1st
%share 50
40
30
20
10
0
1st
%share
16
1st
2nd
2nd
2nd
EUR 12
ill
income per farm (FFI)I
3rd 4th 5th
share of all farms' output in each decile
3rd 4th 5th
3rd 4th 5th
1989/90
6th 7th 8th 9th 10th
6th 7th 8th 9th 10th
6th 7th 8th 9th 10th
C:\BB90\PER89QFF. WK3
TABLE 2.1
Shares of farms represented in each decile, by Member State
in ascending order of income
income decile: all 1st 2nd 3rd 4th 5th 6th 7th 8th 9th 10th
BELGI~ 1.2 0.1 0.1 0.1 0.1 0.3 0.2 0.4 1.5 3.0 5.8 BEL
DANMARK 1.8 6.3 1.0 0.5 0.6 0.6 0.6 1.1 1.7 2.6 3.1 DAN
DEUTSCHLAND 8.3 10.3 2.4 2.4 2.3 4.2 5.9 8.6 12.6 18.2 15.9 DEU ELLAS 11.1 1.6 5.1 9.8 13.8 18.7 20.8 20.7 13.1 6.1 1.1 ELL ESPANA 15.8 34.7 18.3 13.3 16.3 15.3 18.0 14.7 12.7 9.1 6.0 ESP FRANCE 12.5 11.0 4.4 3.6 5.1 6.4 9.0 14.8 21.5 26.2 22.9 FRA
IRELAND 3.1 3.9 2.9 3.3 3.0 3.2 3.0 3.8 2.8 2.9 2.5 IRE
ITALIA. 30,8 11.3 44.0 43.9 41.5 41.2 31.7 27.6 25.6 20.9 20.7 ITA
.,
LUXEMBOURG 0.1 0.0 0.0 0.0 0.0 0.0 0.0 0.0 0.1 0.1 0.3 LUX Q)
NEDERLAND 2.1 1.3 0.2 0.1 0.2 0.4 0.7 0,7 1.5 3,9 12.1 NED
3
PORTUGAL 9.9 13.1 20.3 21.9 15.9 8.6 8.3 5.1 3.4 1.7 1.0 POR 5"
UNITED KINGDOM 3.2 6.4 1.4 1.1 1,1 1.2 1.5 2.4 3.4 4.8 8.6 UKI (")
0
EUR12 100.0 100.0 100.0 100.0 100.0 100.0 100.0 100.0 100.0 100.0 100.0 EUR12 3 (l) (I)
c.o c.o
0
-
c.oShares of each Member State's farms in each EUR decile
in ascending order of income
income decile: all 1st 2nd 3rd 4th 5th 6th 7th 8th 9th 10th
tn
(\) n
....
BELGIQUE 100.0 0.5 0.5 0.6 1 .1 2.4 1.9 3.8 13.0 25.7 50.4 BEL (5"
DAN MARK 100.0 34.7 5.4 2.8 3.3 3.1 3.6 6.3 9.5 14.3 16.9 DAN ~
DEUTSCHLAND 100.0 12.5 2.9 2.9 2.8 5.1 7.2 10.4 15.2 22.0 19.1 DEU !":l
ELL AS 100.0 1.4 4.6 8.8 12.4 16.8 18.7 18.6 11.8 6.0 1.0 ELL
s·
ESPANA 100.0 21.9 11.6 8.4 10.3 9.7 11.4 9.3 8.0 5.7 3.8 ESP n 0
FRANCE 100.0 8.8 3.5 2.9 4.1 5.1 7.2 11.8 17.2 21.0 18.3 FRA 3
IRELAND 100.0 12.4 9.3 10.5 9.5 10.4 9.7 12.1 9.0 9.1 8.0 IRL CD
IT ALIA 100.0 3.7 14.2 14.2 13.5 13.4 10.3 8.9 8.3 6.8 6.7 ITA
;
LUXEMBOURG 100.0 4.4 1.5 0.6 0.4 0.2 4.7 5.1 10.2 24.3 48.5 LUX tn c
NEDERLAND 100.0 6.1 0.9 0.5 0.8 1. 7 3.4 3.6 7.3 18.4 57.3 NED ::; tn
PORTUGAL 100.0 13.2 20.4 22.1 16.1 8.6 8.3 5.1 3.4 1.7 1.0 POR UNITED KINGDOM 100.0 20.2 4.3 3.6 3.5 3.7 4.8 7.4 10.5 15.1 27.1 UKI
EUR12 100.0 10.0 10.0 10.0 10.0 10.0 10.0 10.0 10.0 10.0 10.0 EUR12 N --A
20-0ct-92
22
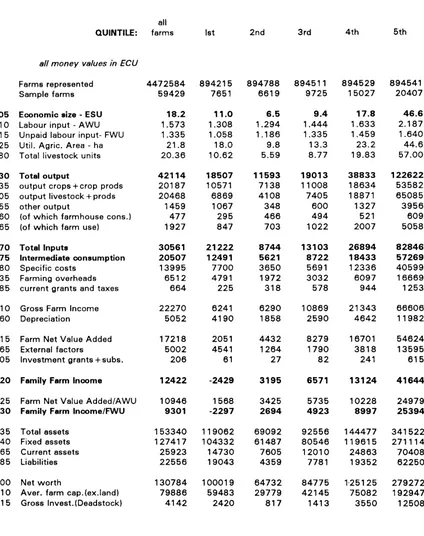
section 2: income results Farm Incomes 1990/91TABLE 2.2 QUINTILES OF INCOME(FFI) PER FARM
EUR 12 1989!90
all
QUINTILE: farms 1st 2nd 3rd 4th 5th
all money values in ECU
Farms represented 4472584 894215 894788 894511 894529 894541
Sample farms 59429 7651 6619 9725 15027 20407
005 Economic size - ESU 18.2 11.0 6.5 9.4 17.8 46.6
010 Labour input - AWU 1.573 1.308 1.294 1.444 1.633 2.187
015 Unpaid labour input- FWU 1.335 1.058 1.186 1.335 1.459 1.640
025 Util. Agric. Area - ha 21.8 18.0 9.8 13.3 23.2 44.6
080 Total livestock units 20.36 10.62 5.59 8.77 19.83 57.00
130 Total output 42114 18507 11593 19013 38833 122622
135 output crops +crop prods 20187 10571 7138 11008 18634 53582
205 outpl.lt livestock+ prods 20468 6869 4108 7405 18871 65085
255 other output 1459 1067 348 600 1327 3956
260 (of which farmhouse cons.) 477 295 466 494 521 609
265 (of which farm use) 1927 847 703 1022 2007 5058
270 Total Inputs 30561 21222 8744 13103 26894 82846
275 Intermediate consumption 20507 12491 5621 8722 18433 57269
280 Specific costs 13995 7700 3650 5691 12336 40599
335 Farming overheads 6512 4791 1972 3032 6097 16669
385 current grants and taxes 664 225 318 578 944 1253
410 Gross Farm Income 22270 6241 6290 10869 21343 66606
360 Depreciation 5052 4190 1858 2590 4642 11982
415 Farm Net Value Added 17218 2051 4432 8279 16701 54624
365 External factors 5002 4541 1264 1790 3818 13595
405 Investment grants+ subs. 206 61 27 82 241 615
420 Family Farm Income 12422 -2429 3195 6571 13124 41644
425 Farm Net Value Added/AWU 10946 1568 3425 5735 10228 24979
430 Family Farm lncome/FWU 9301 -2297 2694 4923 8997 25394
435 Total assets 153340 119062 69092 92556 144477 341522
440 Fixed assets 127417 104332 61487 80546 119615 271114
465 Current assets 25923 14730 7605 12010 24863 70408
485 Liabilities 22556 19043 4359 7781 19352 62250
500 Net worth 130784 100019 64732 84775 1-25125 279272
510 Aver. farm cap.(ex.land) 79886 59483 29779 42145 75082 192947
515 Gross Invest. (Deadstock) 4142 2420 817 1413 3550 12508
weighted using the 1987 Farm Structure Survey
classification using < < 1 984 > > standard gross margins
[image:32.573.83.507.162.698.2]Farm Incomes 1990/91 section 3: medium-term trends 23
3. FARM INCOMES: MEDIUM-TERM TRENDS (1986/87- 1990/91).
On the following pages income results per farm are presented in graphs for the nine FADN type of farming groups (see also sections 4.1 and 5.2). In addition there is one graph showing income per person by type of farming and income per person according to (economic) size of farm.
TYPES OF FARMING
The average shares of production enterprises found in each type of farming group are shown in table 5.1 (section 5.2). For instance, "dairying" farms earn an average 66% of their gross margin from dairying and the average "general cropping" farm takes about 29% of its gross margin from cereals.
The output of specialist farms should not be confused with production. The classification according to type of farming was intended to be a proxy for the economic behaviour of the major production systems (for example cereals, wine, milk). However the share of total output of a commodity which is produced on specialist farms alone is very variable. For instance, about two-thirds of milk output comes from dairying farms but less than one third (27%) of cereals output comes from specialist cereal producers (see section 5.2, table 5.3).
INCOME
In all cases income is the FADN .. family farm income .. definition, that is the value of farm production less intermediate consumption, depreciation, cash wages, cash rent and interest payments. No deduction is made for the value of the labour of "unpaid" labour (normally family labour). This indicator is close to the EUROSTAT macroeconomic indicator 3 "Net income from agricultural activity". Details of the income indicators can be found in section 5. 1 .
CURRENCY
All results are given in real terms, in ECU at 1990 values (see table 3.1 ).
24 section 3: medium-term trends Farm Incomes 1990/91
··•GRAPH
3.1··
AVERAGES FOR MEMBER STATES.
The concentration of high farm incomes is evident when looking at Member State averages in this graph, where the Benelux countries stand out a long way ahead. In 1990/91 the average income per farm was almost 11 times as high in the Netherlands than in Portugal.
Over the period 1986/87 - 1990/91 the highest incomes per farm were in the Netherlands and Belgium, followed by Luxembourg and the U.K. The lowest were in Portugal, Denmark, Spain and Greece. The range in 1990/91 was from 37100 ECU in the Netherlands to 3400 ECU in Portugal.
There are several reasons for the differences in average Member State incomes. Size of farm is an important factor contributing to high incomes in the U.K. (with 110 ha) and to low incomes in Greece (with 6,4 ha). In the Netherlands, characterised by intensive farming, it is the value of output per hectare (7700 ECU compared to a EUR 1 2 average of 1900 ECU) which gives rise to high incomes. In Belgium large margins over costs appear to give producers high average incomes (in Belgium, family farm income represented as much as 39% of the value of total output in 1989/90, and 34% in 1990/91 ). Portuguese farms are handicapped by a very low value of output per hectare, and, because of the relatively small average size of farm, output per farm is also low. Danish farms, although having a high value output, suffer a large interest burden. Over the period 1986/87 to 1990/91 average liabilities per farm were equivalent to 57% of total assets. Interest payments accounted for 16% of total farm costs and, on average, were equivalent to more than double the family farm income of the farm.
1990 ECU
50,000
Graph 3.1.
REAL INCOME (FFI) per FARM
MEMBER STATE AVERAGES
1990/91
1
=~:~;~~
990/91
II
:111
1989190
1---···-··-··-·-··--- ---···--·
-·---·-·-·-···-··---·--·-····-·-·-···-···--·----·-~---~
40,000
f-1--- ---·
··30,000
-
···20,000
-
1---10,000
f-1---···- ·-- ~···
0
EUR12
BEL
DAN
C:\8890\b90all. WK3 _ msavef.
*
~----·--·---·-·--- t--· i;:; ~ ....•... -.. -- . --- --- --- --- ---- . -. -- . -. ---- ---- --.
!r~
~
.. 1... ..
I
1.1 .. --- ·--
~:l
l' .r ...:_~;~~-~~:~!:
- - - 1--.II,
m
1
... .
~
di
_!!~
DEU
ELL
ESP
FAA
IRE
ITA
LUX
I'... . ···.
!1!1·
i!ll'
rt~
!i'!!
11-
---1
---·r·---~~
:: lm;~:
: : :1!1NED
POR
UKI
""
Q)
3
5'
(")
0
3
Ctl (I)
(0 (0 0
-w ...
CIJ
CD
(")
...
s·
::;,
w
3
CD
c.
2"
3
,!..
CD
3
...
...
CD
::;,
c.
CIJ
26 section 3: medium-term trends Farm Incomes 1990/91
GRAPH 3 .. 2 - FARM INCOME RESULTS AND TYPE OF FARMING
(EUR 12)
Taking out the exceptional case of pigs/poultry, the average results for the types range from 7950 ECU for cereals (the lowest) to 23100 ECU for horticulture (the highest).
Except for the relatively small group pigs/poultry, the long term absolute differences between types of farming are much more important than year on year changes (both 1989/90 and 1990/91 average results are quite close, and not far from the 1986/7 - 1990/91 averages).
Pigs/poultry farm incomes fluctuate considerably due to production cycles -however they are a small group (see graph 2H later).
The types of farming groups with high average incomes are prevalent in northern Europe. For instance, consider the shares of total output from these types of farming (see table
3):-pigs/poultry:
70o/o
from northern Europe, of which 21o/o
from theNetherlands;
horticulture: 72% from northern Europe, of which 35% from the
Netherlands;
dairying:
7
6o/o
from northern Europe, of which 23% fromGraph
3.2.
REAL INCOME
per
FARM (FFI) by TYPE
of
FARMING
1990 ECU
40,000
>-···
30,000
~average
1986/7 - 1990/91
EUR12
!
ij
1989/90
1990/91
F,.
---.. --.. -. --- - - -- - --. --. ---. -. ----. -~ ~ ~ ~ ----... -. --. ---- - ---. -.. -. ---.. --. --
--..
. :i:
:-:·!!i!
._ ... ..
.... 1
... .
20,000
-_
... ..10,000
f-J
t
....
ji_~!,.:·_,
.. ··.:···· .... ··i!"_:·:_,_._ ... :···'i:l;·.···_:· ... ···'ll ... ··· ... · · .. : ... '· .... ·''.:!·_:· . . . . .1!1
----l....:.~----~~:...___-~
0
~1--- ....
all
(B) gen. cropping
(D) vineyards
(F) dairy
(H) pigs/poultry
(A) cereals
(C) horticulture
(E) oth. perm. crops
(G) drystock
(I) mixed
\bb90\eurtf
"T1
Ill
3
:J
(") 0
3
en
(/)
....
co co
0
-co
....
3
CD
c.
c:·
~
~
CD
3
~ ....
CD
~
c.
28
section 3: medium-term trends Farm Incomes 1990/91GRAPH
3~3-CEREAL FARMS.,
Spain, France and Italy are the important countries for this group, but have very different production structures. France, with
28o/o
of the total output of this farming type, has only11%
of the farms; Spain has only21 %
of the production but33o/o
of the farms; Italy accounts for17%
of the production and has32%
of the farms (see section5.2,
table5.2).
In
1989/90
the average French cereal farm was4.3
times the size of the Spanish counterpart, whilst using only 1 .4 times as much labour: an indicator of very large structural differences. The average economic size (see below) of specialist cereal farm was41.2
ESU in France,12.0
ESU in Italy and10.6
ESU in Spain (see pages49
to69).
A selection of indicators (average values for all farms) for the most important countries for this type of farming is given in the table below.
total total UAA yield total UAA
I
output (soft assets per AWU
wheat) hectare
[1989/901
ECU
HECTARES TONNES/ECU
HECTARESHA
Espana
20499
44.8
2.39
3469
48.2
ltalia
17323
14.6
4.92
8870
13.8
France
82535
65.6
6.61
2629
51.4
U.K.
133696
126.6
6.84
5604
61.2
Graph 3.3.
1990 ECU
20,000
15,000
10,000
5,000
0
(5,000)
EUR12
BEL
C:\8890\b90cer.WK3 cer.ch1
average
1986/7 - 1990/91
1989/90
1990/91
DAN
DEU
REAL INCOME
per
FARM (FFI) by TYPE
of
FARMING
CEREALS
(TF11)
i.:.::.:'J:.··;ll·.···. . ... .
~·
... ...
:; ...
~~f
...
:!'.:.·~:·:.
. .II
.. Ill!
ELL
ESP
FAA
IRE
ITA
LUX
NED
POR
UKI
"T1
Q.l
3
:J (."') 0
3
co
(I)
~
<.o <.o
0
w
3
CD
0.
c:·
~
...
CD
3
...
...
CD
::;, 0.
en
N
30
section 3: medium-term trends Farm Incomes 1990/91GRAPH 3.4 - GENERAL CROPPING FARMS.
The largest group in the Community
(28 °/o
of farms producing21 o/o
of the total output). These farms are most numerous in Italy(38 °/o
of the total) and Greece(17o/o),
and most important in production in France(23°/o)
and Italy(22%).
This group covers a very mixed bag of farms with a wide variety of crops from northern and southern Europe.The differences in income and size are closely related to geography: for instance Belgian "general cropping" farms in the FADN are 4 times as large as their Portuguese counterparts
(38
hectares compared to11
hectares) and have incomes 1 0 times greater."General Cropping" farms in Denmark have exceptionally low incomes due to the very high debt burden in that country. On average these farms owed
3400
ECU per hectare in1990/91
and their debts are equivalent to two-thirds of total farm assets and exceed the value of 2 years' farm output.Some indicators from the main countries for the "general cropping" farm type are given below (averages over all farms in the type).
total Utilised Agricultural Area total UAA
I
output assets per AWU
hectare
cereals other permanent
{1989!901 field crops*
crops
ECU
HA HA HAECU
HAltalia
18524
3.8
1.9
1 . 1
12575
6.1
France
81127
27.8
16.2
1.5
3094
34.8
Elias
13709
3.4
1. 7
0.9
7814
3.5
Espana
23032
11.0
6.3
4.1
5994
17.8
Deutschland
87243
23.4
11.0
0.3
7965
25.2
Portugal
8447
2.9
0.9
2.1
4274
6.0
U.K.
242880
83.0
36.6
0.8
5978
43.5
Graph
3.4.
REAL INCOME
per
FARM (FFI) by TYPE
of
FARMING
1990 ECU
40,000
t-··· ...
30,000
r--··· ...
20,000
-GENERAL CROPPING (TF12+60)
1990/91
-··· ... ... ··· ... ··· ... ··· ..
0
10,000 -
'F.- II
n
----'---L:...
~ ~~ - -- --- -- --- -- --- --- --- --- ~--- _---_---_---....:.o-...
---....;.;.1
~I-- _
.
-\BB90\b90gcrp.WK3 gcrp.ch 1
"'T1
Q)
3
5'(')
0
3
(1)
en
-
CD CD 0-CD ...
...
CDn
...
s·
:I w3
!.
2'
~
...
CD
3
...
..
CD :I
c.
32
section 3: medium-term trends Farm Incomes 1990/91GRAPH
3.5-
HORTICULTURE FARMS.
These are most numerous in Spain
(30o/o
of Community horticulture farms) and most economically important in the Netherlands (with35 o/o
of the total output of these farms). Italy has an important share of the farms(20o/o)
but these have a relatively small output. Spanish farms also make a large contribution to the combined output(18%)
of farms of this type.In
1989/90,
income per farm ranged from6000
ECU in Portugal to51000
ECU in the Netherlands, though Dutch farms have only just over twice the average labour input than their Portuguese counterparts.Size of business is an important factor in determining average incomes in Member States. Because of the heterogeneous nature of horticultural production it is more meaningful to compare the value of output than the area of holding. At the extremes Dutch farms have, on average, a total output or turnover of
273 000
ECU, whilst Portuguese holdings of the same type barely reach a turnover of
12000
ECU (1989/90
figures). In the other Member States average turnover per "horticulture" type holding is about153 000
ECU in Germany,222 000
ECU in the U.K.,55 000
ECU in Spain and38 000
ECU in Italy.Average indicators per holding for selected countries are given below.
total output Annual Work depreciation total assets Units
{1989/901 ECU ECU 000 ECU
Espana
54921
3.46
3481
178
Nederland
272985
4.20
38590
480
ltalia
37880
2.14
4020
102
REAL INCOME per FARM (FFI) by TYPE of FARMING
Graph
3.5.
HORTICULTURE (TF20)
1990 ECU
50,000
f -average
1986/7- 1990/91
lilllll
1989/90
1990/91
>-·--···-··----···-~---~~~---···--···
-·· ~!"-·----···----·-···--40,000
f.-~--····-·----··-··· 11---···-·----···---···-·---···-·-·-·--···---···---···-·---···---····-···---·-··· 11!11
!l!i!
ii!H
--- ;::::---···
11
30,000
~
r-···--··---·-·--·--·--20,000
'----f.---· ...
10,000
f-f---···
0
tftr:l'
!il:l
llii!
Wi:
!ill:
mi·
I!~
---1:~:
u···
EUR12
BEL
DAN
DEU
\8890\b90hort. WK3
··· , ... ··· ... :1,; , ... --···''!_ ..• ---·'!.'1._, .. --···'_ ... --·'1 __ ... ··' ... :;!_···
··· ... 1
":
_,i_.·_,,: ...-.~_
... -'::_,:·:· ___ , ' · · · · · . . . ::lii!:---·-1:!
,,,,,
j;j,;li
~.
·~~
__ ,:,:_:;,_·' ... ·;',:·--·-···---···-····---·
1:
.
J ···
r
I
···I,
a
ELL
ESP
FAA
IRE
ITA
LUX
NED
POR
--.-.---:=:
UKI
"T1
Q)
3
3'C")
0
3
ro
VJ
___.
c.o c.o
0
(0
3
C1)
c.
c:·
~
...
C1)
3
...
...
C1) ::l
c.
en