ESTIMATION OF STATURE
FROM THE BONY MARKERS OF
PROXIMAL END OF ULNA
Dissertation submitted in partial fulfillment of the
Degree of Master of Surgery (Anatomy)
of
The Tamil Nadu Dr. M. G. R. Medical University,
Chennai
by
CERTIFICATION
This is to certify that the dissertation
Titled
“Estimation of stature from the bony markers of
proximal end of ulna”
is based on the results of the
work carried out by
Dr. SUJA R.S.
for the degree of Master of Surgery (Anatomy)
under my supervision. The work reported in this
dissertation has not been submitted to any
other university for the award of a degree.
Dr. Sunil J Holla,
CERTIFICATION
This is to certify that the dissertation
titled
“Estimation of stature from the bony
markers of proximal end of ulna”
is based on the
results of the work carried out by
Dr. SUJA R.S.
for the degree of Master of Surgery (Anatomy)
under the guidance of Dr. Sunil J Holla. The
work reported in this dissertation has not been
submitted to any other university for the award
of a degree.
Dr. Rachel Koshi,
CONTENTS
INTRODUCTION 6
AIMS OF THE STUDY 11
REVIEW OF LITERATURE 12
MATERIALS AND METHODS 21
RESULTS 31
DISCUSSION 49
CONCLUSION 56
BIBLIOGRAPHY 60
ACKNOWLEDGEMENTS
I would like to thank the following people:
Dr. Sunil J. Holla, Professor of the Department of Anatomy, for his expert supervision, guidance and constant encouragement.
Dr. Rachel Koshi, the Head of the Department of Anatomy, for her valuable suggestions and help.
Dr. Rekha Cherian, the Head of the Department of Radiology and Mr. Edwin Simon, Superintendent of the Radiology Department, for their help with my radiological studies.
Dr. K.G. Selvaraj and Ms.Nithya, Department of Biostatistics, for their guidance in statistical analysis.
Dr. J. Suganthy, Senior Lecturer and Ms. Sakunthala Ambikaipakan, Ph.D. student, of the Department of Anatomy, for their encouragement and support.
Dr. Tripti, P.G. student, Department of Anatomy for her help in preparing the references.
Dr. Aswathy, Demonstrator, Department of Anatomy, for her patience in compiling this work.
Mr. V. Gopinath, Secretary, Department of Anatomy, for his timely help.
Teaching and non-teaching staff of Department of Anatomy, for their cooperation and help as and when it was necessary.
The Fluid Research Grant Committee, for funding this work.
TITLE OF THE ABSTRACT :
ESTIMATION OF STATURE FROM
THE BONY MARKERS OF
PROXIMAL END OF ULNA
NAME OF THE CANDIDATE
:
DR. SUJA. R. S
DEGREE AND SUBJECT
:
M.S. ANATOMY
NAME OF THE GUIDE
:
DR. SUNIL J HOLLA
OBJECTIVES:
To measure bony markers at the proximal end of the ulna
and to correlate these markers with its length for formulating
equations to estimate length of the ulna and stature in south Indian
population.
METHODS
The present study deals with the computation of linear regression
formulae for reconstruction of ulnar length and stature from bony fragments of
upper end of the ulna. A total of 110 ulnae (right-63, left-47) were measured for
this purpose.
Fourteen markers at the proximal ends of 110 dry ulnae were
measured with vernier calipers. Length of the ulnae was measured with
osteometric board.
Forty-five (45) radiographs of forearm showing both ends of ulnae of
thirty (30) individuals were taken. Four markers from the proximal end of
radiographs and the length of the ulnae
were measured with a measuring scale.
Statistical method
Independent t-test, Regression analysis, Pearson
correlation test, and stepwise method were used for this study. All
analyses were carried out using SPSS version 11.5.
RESULT
The data revealed non-significant bilateral variation in the
measurements of the ulna. Regression equations were formulated for the
estimation of length of the ulna from bony markers. Multiple linear regression
equations were constructed using the stepwise method. It was
shown that a single dimension for right side, the distance between
the tip of the olecranon process posteriorly and the anterior-most
point on the radial notch can estimate the stature of an unknown
person with great accuracy. Regression equation for finding out
height from the length of the ulna was also derived from radiographs
INTRODUCTION
Anthropometry is the study of the measurements of the human
body in terms of the dimensions of bone, muscle and adipose tissue.
Anthropometric techniques commonly used by anthropologists and
adopted by medical scientists have been employed to estimate body size
for over hundred years. Interest in reconstructing stature from skeletal
remains dates back to the early 1800s. Human limb bones have been
used for the estimation of stature in the field of forensic medicine since
the 19t h century. Stature was reconstructed, using the regression
formulae for long bones, described by Trotter and Gleser, 1952;
Stevenson, 1929; Breitinger, 1938;Telkka, 1950; Dupertuis and Hadden, 1951; Keen, 1953; Genoves, 1967; Trotter and Gleser, 1977.
Populations, on which these equations were based, included
European-Caucasian, American-European-Caucasian, African-American, African,
Meso-American and a heterogeneous group of Mongolians. The determination
of sex and the estimation of stature from bones play an important role in
identifying bodies and skeletal remains. Useful information for the
estimation of stature can be obtained from sources besides the length of
the long bones of the limbs. Other bones, such as metacarpal bones
(Musgrave and Harneja, 1978), fragmented limb bones (Steele et al.,
1969); clavicle (Singh and Sohal, 1952; Jit and Singh, 1956) and scapula
(Olivier and Pineau, 1957) were investigated for the same purpose. Bony
markers are useful in physical and forensic anthropology. If the body of
an individual has been dismembered or if the skeleton is disintegrated,
McKern, 1969; Holla et al., 1996; Steele, 1970; Singh et al., 1974).
Measurements of the Intertubercular sulcus of the humerus were used as
an indicator of handedness and humeral length (Vettivel et al., 1995).
Bony markers of proximal femur such as neck-shaft angle, neck length,
intertrochanteric apical axis length and vertical diameter of the head
were used for reconstructing the length of the femur (Prasad et al.,
1996). It was noted that none of these workers reported the use of
fragmentary remains of the ulna for the estimation of stature. This may
be due to the fact that the length of the ulna contributes a less accurate
estimation of stature than the length of other long bones. However, in the
absence of adequate remains it is worthwhile to have such an estimate
rather than totally ignoring the burnt or broken fragments of the ulna when an estimate is required.
Normal Anatomy of the ulna
The ulna (Fig.1) is medial to the radius in the supinated
forearm. Its proximal end forms a massive hook, which is concave
forwards. The lateral border of the shaft is the sharp interosseous
border. The bone diminishes progressively from its proximal mass throughout almost its whole length, but at its distal end expands into
a small rounded head and styloid process.
Proximal end
The proximal end has large olecranon and coronoid processes
radius respectively. The olecranon process is more proximal and is bent forwards at its summit like a beak, which enters the humeral olecranon
fossa in extension. Its posterior surface (Fig.2) is smooth, triangular
and subcutaneous. In extension the tip of the olecranon process can be
felt near a line joining the humeral epicondyles, but in flexion it
descends, so that the three osseous points form an isosceles triangle.
The anterior part of the olecranon process (Fig.3) has an articular
surface, which forms the proximal area of the trochlear notch. It is
slightly constricted where it joins the shaft and is the narrowest part of
the proximal ulna. The coronoid process projects anteriorly distal to the
olecranon. Its proximal aspect forms the distal part of the trochlear
notch. On the lateral surface (Fig.4), distal to the trochlear notch, there
is a shallow, smooth, oval radial notch that articulates with the radial
head. Distal to the radial notch the surface is hollow to accomodate the
radial tuberosity during pronation and supination. The anterior surface
(Fig.3) of the coronoid process is triangular. Its distal part is the
tuberosity of the ulna. Its medial border (Fig.5) is sharp and bears a
small tubercle proximally.
The trochlear notch (Fig.4) articulates with the trochlea of the
humerus. It is constricted at the junction of the olecranon and coronoid processes, where a narrow rough nonarticular strip may
separate their articular surfaces. A smooth ridge, adapted to the
groove on the humeral trochlea, divides the notch into medial and
lateral parts. The medial part fits into the trochlear flange. The
aspect of the coronoid process, articulates with the periphery of the
radial head, and is separated from the trochlear notch by a smooth
ridge.
Shaft
The shaft (Fig.4) is triangular in section in its proximal
three-fourths, but distally is almost cylindrical. It has anterior, posterior
and medial surfaces and interosseous, posterior and anterior
borders.
Distal end
The distal end is slightly expanded and has a head and styloid
process (Fig.1). The head is visible in pronation on the
postero-medial carpal aspect, and can be gripped when the supinated hand
is flexed. Its lateral convex articular surface fits the radial ulnar
notch. Its smooth distal surface is separated from the carpus by an
articular disc, the apex of which is attached to a rough area between
the articular surface and styloid process. The latter, a short, round,
postero-lateral projection of the distal end of the ulna, is palpable
(most readily in supination), 1 cm proximal to the plane of the radial
styloid. A posterior vertical groove is present between the head and
Ossification
The ulna ossifies from four main centers, one each in the
shaft and in the distal end and two in the olecranon process.
Ossification begins in the mid shaft about the eighth fetal week, and
extends rapidly. In the fifth (female) and sixth (males) years, centers
appear in the distal end, and extend in to the styloid process. The
distal olecranon is ossified as an extension from the shaft, and the
rest from a thin scale-like proximal epiphysis on its summit. The
latter appears in the ninth year in females, and eleventh in males.
The whole proximal epiphysis has joined the shaft by the
fourteenth year in females and sixteenth in males. The distal
epiphysis unites with the shaft in the seventeenth year in females
AIMS OF THE STUDY
1. To measure bony markers at the proximal end of ulna.
2. To study the correlation between the bony markers at the
proximal end of ulna and its length.
3. To formulate equations to estimate length of the ulna from bony
markers on the ulna in the south Indian population.
4. To compare the estimated length of the ulna with the actual
length on a restricted sample.
5. To formulate equations to estimate stature from radiographic
REVIEW OF LITERATURE
Estimation of stature or sex from the long bones plays an
important role in the forensic identification of bodies and skeletal
remains. Telkka (1950) mentioned that the prediction of human stature
on the basis of long bones holds a central position in anthropology.
Orfila (1831) presented the first tables worked out on the basis of
actual bone measurements by means of which the stature could be
predicted. Determination of sex from human skeletal remains plays a
very important role in establishing the identity of an individual. It has
been noted by Krogman and Iscan (1986) that very high prediction
accuracy can be reached if a well-preserved entire skeleton is
available. This chapter deals with the review of several studies on the
use of bones in estimating stature and sex.
ESTIMATION OF STATURE:
Different anthropologists estimated the actual stature of
individuals from exhumed bones, using statural formulae. In 1888,
Rollet published the earliest formal statural tables in France, using the
humerus, radius, ulna, femur, tibia and fibula of 50 male and 50 female
cadavers. The bones were measured first in the ”fresh state” and 10
months later in the “dry state“. During this time they had lost 2mm in
overall length. In 1892 and 1893, Manouvrier re-assessed Rollet’s data
but excluded all subjects over 60 years of age, for he considered that
in old age some 3cm of calculated stature has been lost. There were 2
noted. Manouvrier determined the average stature of individuals who
presented the same length for a given long bone; Rollet determined the
average length of a given long bone from individuals with the same
stature. In 1899, Pearson using Rollet’s data developed regression
formulae based on bones from the right side only.
In 1952, Trotter and Gleser published a definitive study on
stature calculation for American whites and blacks. Data used were
from the dead of World War II and the Terry Collection. All 6 long bones
were measured for maximum length, along with bicondylar length of the
femur and tibial length between upper and lower articular surfaces.
Blacks of both sexes had longer arm and leg bones than whites. They
also have longer forearm and leg bones relative to upper arm and thigh. In 1958, Trotter and Gleser re-evaluated the entire problem of
statural reconstruction from long bones using the skeletal material from
casualties of the Korean War. They mentioned that the relationships of
stature to the length of long bones differ sufficiently among the three
major races (White, Negro, Mongoloid) to require different regression
equations from which to derive the most precise estimates of stature
belonging to each of these groups.
In 1961 Allbrook attempted to develop standards for estimation of
stature from a British sample using percutaneous tibial and ulnar
lengths. Ulnar length was measured from the tip of the olecranon
process to the distal margin of the head of the ulna (palpable on the
dorsum of the wrist) with the forearm flexed and semi-pronated and the
measured fresh, 2mm must be deducted from each bone to get the
length of the dry bone.
Estimation of stature from body parts
:
Cheng (1998) studied arm span and foot length of 3647 Chinese
children and estimated stature with regression equations. Attallah and
Marshall (1986) estimated stature from measurements of some limb
segments (upper limb, upper arm, forearm, leg, hand and foot). Simple
and multiple regression equations were derived for estimation of
stature from these segments. Ozaslan et al. (2003) estimated stature
from trochanteric height, thigh length, lower leg length, leg length, and
foot height, breadth, and length by regression analysis.
Estimation of stature using the whole long bone:
Joshi et al. (1964) studied 50 healthy male medical students in
Gujarat in the age group of 18-22 years. In his study length of the ulna
and length of the tibia were taken into consideration. He concluded that
in determining the total height of an individual, knowledge of both tibia
and ulnar lengths was important even though the height can be
predicted by a regression equation of height on tibia length or on ulnar
length alone.
Athawale (1963) correlated length of radius and ulna with
height. Regression formulae were derived for stature based on the
different measurements. Humphry (1958) prepared tables (in England)
Nat (1931) estimated stature from long bone length by
multiplying it with multiplication factors. He worked on the humerus,
radius, ulna, femur, tibia and fibula.
Estimation of stature from bony fragments
:
If the body of an individual has been dismembered or if the
skeleton is disintegrated, bony markers of the radius can be used to
estimate the length (Steele, 1969) or gender (Singh et al., 1974) of that
bone.
Holla et al. (1996) studied the measurements of the size of bony
markers at the distal end of the radius in 61 left and 64 right dry radii.
It was proposed that the greater distance between the dorsal tubercle
and styloid process and the greater dorso-palmar diameter of the
carpal articular surface opposite to the dorsal tubercle were indicative
of right-handedness. The length of the radius was found to correlate
significantly with bony markers. Regression equations for the length of
the radius were derived. The estimated length of the radius can be
used to estimate the stature of an individual by referring to the
regression equations, tables and multiplication factors that are available (Nat, 1931; Siddique and Shah, 1944; Telkka, 1950; Dupertuis
and Haddon, 1951; Trotter and Gleser, 1952, 1958; Athawale, 1963;
Kolte and Bansal, 1974; Patil et al., 1983).
Vettivel et al. (1999) measured maximum length and twenty other
bony markers on 68 dry unpaired radii of known gender (34 right and 34
fragment of radius and the gender from a single radius. Simple
regression equations were derived to calculate the estimated length of
the radius.
Vettivel et al. (1995) estimated length of the humerus using
measurements of the intertubercular sulcus as markers. Prasad et al.
(1996) estimated the length of the femur using markers at the proximal
end of the femur.
Mysorekar (1982a) studied 277 radii to derive regression
formulae for estimation of the total length of the radius from the upper
and lower segments. The regression formulae that were derived have a
high degree of prediction, and are valuable in establishing the stature
of an individual.
Badkur and Nath (1990) studied 288 ulnae belonging to 82 male
and 62 female skeletons. Their study indicated that the upper shaft
circumference is the best predictor of ulnar length among the
fragmentary measures they described and stature can best be
reconstructed using the breadth of the olecranon. Koshy et al., (2001),
studied 110 calcanei and 70 tali and found that the maximum length of
the calcaneum significantly correlated with maximum transverse width
of the calcanei, depth of the groove on the sustentaculum tali, length,
width and depth of the sulcus calcanei. Maximum length of the talus
significantly correlated with maximum transverse width, length and
width, length and width of articular surface for the lateral malleolus,
length of articular surface for the medial malleolus, vertical and
regression suggested that maximum length of calcaneum regressed
significantly with maximum transverse width, length and depth of the
groove on the sustentaculum tali, length, depth of the sulcus calcanei,
and maximum length of the talus regressed significantly with maximum
transverse width, length and width of the lateral articular surface,
length of the medial articular surface, vertical and transverse diameters
of the head and depth of the sulcus tali.
Mysorekar (1982b) estimated stature from parts of ulna and
tibia. He studied 351 fully ossified human ulnae to derive regression
formulae for the estimation of total length of the ulna from the upper
and lower segments. The line of separation between segments was the
lowest level of the insertion of the brachialis muscle. This study was undertaken to derive regression equations, which would have a high
degree of prediction for the estimation of the total length of the ulna.
Eventually the stature of the deceased could be estimated from various
formulae available for the ulnae. Regression equations were derived to
correlate the length of the upper or lower segment of the ulna to the
total length of the ulna. It was noted that the correlation between the
length of the lower segment to the total length was comparatively much
greater than that of the upper segment to the total length of the bone in
all the right and left ulnae. Hence it is felt that in all these bones the
regression equation for the lower segment should be preferred for
prediction purposes. This would give a difference of barely 1-2mm in
that a regression equation derived by using a longer segment of a bone
is preferable to using a smaller segment.
ESTIMATION OF SEX FROM BONE:
Determination of sex from human skeletal remains plays a very
important role in establishing the identity of an individual. It is said that
very high prediction accuracy can be reached if a well-preserved entire
skeleton is available (Krogman and Iscan, 1986; Jit 1979).
Purkait (2001) advocated use of demarking points of ulna
(olecranon-coronoid angle, length and width of inferior medial trochlear
notch), which helped to identify the sex with 90.6% accuracy. He
measured dry adult ulnae (100 male and 60 female). His study revealed
that the olecranon-coronoid angle was the single best parameter for
sex determination, yielding 85% accuracy.
Badkur and Nath (1990) in their study on 288 ulnae found that
sex differences were highly significant at 1% level. Keeping this in
view, separate regression equations were formulated for both sexes.
Introna (1993) observed that the highest percentage of correct
sex classification of 95% was obtained using the minimum circumference and maximum length of the ulna together. Using four
discriminant functions sex was correctly identified in 93.75% of the
Vettivel et al. (1999) measured maximum length and twenty other
bony markers using osteometric board, sliding caliper, and goniometer
on 68 dry unpaired radii of known gender (34 right and 34 left, 42 male
26 female). Their data was statistically analysed so as to estimate the
maximum length from a fragment of radius and the gender from a single
radius. Simple regression equations were derived to estimate the
length of the radius. Student’s unpaired t-test was used to determine
which markers showed a significant gender difference. Fisher ’s
discriminant function (multivariate) analysis was done on all the 21
markers to differentiate gender from a single radius and included nine
significant markers.
If the body of an individual has been dismembered or if the
skeleton is disintegrated, bony markers of the radius can be used to
estimate the length (Steele, 1969) or gender (Singh et al., 1974) of that
bone. According to Jit (1979) it may not be difficult to predict the
gender of an adult when an almost complete skeleton is available.
Purkait (2001) advocated use of demarking points of ulna
(olecranon-coronoid angle, length and width of inferior medial trochlear
notch), which helped to identify the sex with 90.6% accuracy. He
measured dry adult ulnae (100 male and 60 female) of Madhya
Pradesh. In his study direct analysis using single and multiple variables
revealed the olecranon-coronoid angle as the single best parameter for
Skeleton development is influenced by a number of factors producing
differences in skeletal proportions between different geographical
areas. Racial differences in mean adult heights and limb bone length
between populations have been reported (Trotter, 1958). Length and
width of inferior medial articular notch was measured and when a test
of significance was applied, it yielded highly significant differences, for
sexing the ulna. An advantage of measuring the length and width of
inferior medial articular notch for sex determination is that the
measurements can be taken on fragmentary bone where only the upper
end is available (Purkait, 2001).
MATERIALS AND METHOD
Materials used for this study are,
a. Bones - 110 dry ulnae to derive formula to estimate ulnar length
and 5 dry ulnae to determine the accuracy of the formulae
b. Osteometric board
c. Vernier calipers
d. Glass slide
e. Radiographs of forearm
f. Measuring rod
Collection of the bones
Hundred and ten dry ulnae (right-63, left-47) along with five dry ulnae
(right-3, left-2) obtained from subjects from Tamil Nadu were used for
this study. Though the bones were from cadavers dissected in the
Department of Anatomy, Christian Medical College, Vellore, we could
not identify which bones belonged to the same cadaver. Based on a
similar study on the radius by Holla et al. (1996) the sample size was
taken as 110. Defective bones were not selected for the study. The
exclusion criteria were:
1. Bones having any fracture or any pathology
2. Macerated bones
Osteometric board
An osteometric board (Fig.6) was used for measuring the
whole length of the ulna. The osteometric board consists of a
rectangular wooden board with a graduated scale, graduated in
centimeters. The board is provided with two wooden vertical walls, one
of which is fixed, at the zero end of the scale and the other movable.
The other block is movable and is placed on the board. For measuring
the length of the ulna, the bone is placed between the blocks as shown
in the figure (Fig.7). The least count of this instrument is 1mm .The
length of the ulna was measured in cm.
Vernier calipers.
For taking smaller measurements from parts of the
ulna, vernier calipers (Fig.8) were used. It is a metallic instrument with
two graduated scales. The main scale is graduated in cm and mm and
is attached to a fixed jaw. The Vernier scale is graduated in mm and is
attached to a movable jaw. The jaws are provided with extensions,
which are used in the measurement of inner diameters. The least count of the instrument is 0.1 mm.
Least count of the Vernier = Magnitude of one main scale division/No.
Total reading = M.S.R.+(V.S.R. x L.C.), where
M.S.R. = Main Scale Reading
V.S.R. = Vernier Scale Reading
L.C. = Least Count
The measurements of certain segments were done using
vernier calipers as shown in the figures (Fig. 9,10 and 11).
Glass slide
For taking certain measurements from the bones, a
rectangular glass slide having 0.49 cm thickness was used (Fig.11).
Points and markers
A - anterior-most point on the trochlear notch superiorly (Fig.12)
B - anterior-most point on the trochlear notch inferiorly (Fig.12)
C - superior-most point on the olecranon process (Fig.13)
D - point on the posterior aspect of ulna where the perpendicular
For marking certain points on the posterior aspect of the
ulna, the ulna was placed on a glass sheet of thickness 0.49 cm. The
ulna was viewed from the side and points D, F and J were marked.
E - tip of the olecranon process posteriorly (Fig.13)
F - point on the posterior aspect of the ulna where the
perpendicular to the long axis of the ulna passes through point
B (Fig.14)
G - anterior end of the radial notch (Fig.15)
H - posterior end of the radial notch (Fig.15)
I - posterior most point of the trochlear notch (Fig.12)
J - point on the posterior aspect of ulna where the perpendicular to
the long axis of the ulna passes through point I (Fig.12)
X - thickness of the glass
The following measurements of the ulna were taken using
techniques recommended by Singh and Bhasin (1989). Measurements
4, 5 and 10 were made with the vernier caliper held perpendicular to
Measurements
One hundred and ten ulnae were taken for the study. Fourteen markers
were measured from the proximal end of ulna. The data was shown in
appendix (1). Mean, standard deviation and standard error of these
markers and length of the bones were showed in appendix (2).
1. Distance between the anterior-most point on the trochlear notch
superiorly and inferiorly (AB), (Fig. 13).
2. Distance between the superior-most point on the olecranon and
anterior-most point on the coronoid process of ulna in the trochlear
notch (CB), (Fig. 13).
3. Difference between CB and AB (AC), (Fig. 13).
4. Distance along the perpendicular to the long axis of the ulna from
the anterior-most point on the olecranon process to a point on the
posterior aspect of the ulna + thickness of the glass (AD+X), (Fig.
12, with Marker AD)
5. Distance along the perpendicular to the long axis of the ulna from
the tip of coronoid process of ulna to a point on the posterior aspect
of the ulna+ thickness of the glass (BF+X) (Fig. 12, with Marker BF) 6. Distance between the anterior and posterior ends of the radial notch
(GH)
7. Distance between the tip of the olecranon process posteriorly and
the anterior-most point on the radial notch distally (EG), (Fig 15)
8. Distance between the tip of the olecranon process posteriorly to the
9. Distance between superior-most point on the olecranon process to
a point on the posterior aspect of the ulna where the
perpendicular to the long axis of the ulna passes through on the
coronoid process (CF) (Fig 14)
10. Distance along the perpendicular to the long axis of the ulna from
the posterior most point on the trochlear notch to a point on
posterior aspect of the ulna + thickness of the glass (IJ+X) (Fig 11
and 12)
11. Distance between the tip of the olecranon process posteriorly
to the anterior-most point on the trochlear notch inferiorly
(EB) (Fig 13)
12. Distance between the anterior-most point on the trochlear notch superiorly to a point on the posterior aspect of the ulna where the
perpendicular to the long axis of the ulna passes through the
anterior-most point on the trochlear notch inferiorly (AF) (Fig 14)
13. Distance between the anterior-most point on the trochlear notch
superiorly to the tip of the olecranon process posteriorly (AE) (Fig
13)
14. Distance between the anterior-most point on the trochlear notch
superiorly to a point in the posterior aspect of the ulna where the
perpendicular to the long axis of the ulna passes through the
posterior-most point of the trochlear notch (AJ) (Fig 9)
Measuring rod
The stature of 30 healthy individuals, 16 females and 14
males (Table 1) from South India whose ages ranged from 30-65 years
was measured. Stature was measured with a measuring rod, placing
the person in erect military position, barefoot and looking forwards with
the back against a graduated scale. All measurements were made at
the same time (2.30 pm-4 pm) to take it into account possible
variations in height at different times of the day.
Study of radiographs
From the study of the bony markers it was noted that the correlation coefficient between AD and length of the ulna was 0.485. This was
used for deciding the sample size for the studies of radiographs using
the formula,
(Z1 -α/ z + Z1 -β) 2
N = --- + 3
[FZ (ρ1) - FZ (ρ0)] 2
ρ0 - population correlation coefficient
ρ1 - sample correlation coefficient
Z1 -β - power
For the correlation coefficient 0.485, alpha error of 5%, power of 80%
the required sample size was found to be 31.
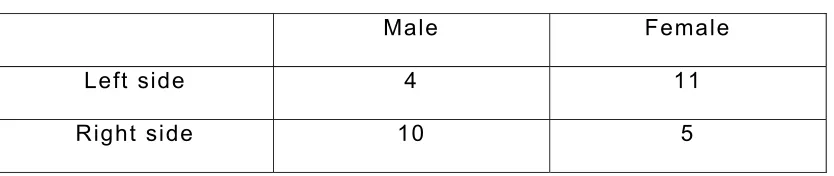
X-rays were taken of the ulna of both sides of 15 individuals (4
male and 11 female). Measurements were taken of the length of the
ulna and of the following parameters in the radiographs of the ulna: AD,
AB, IJ and BF. These measurements were subjected to statistical
analysis to study the bilateral difference. The difference was found to
be insignificant at the 0.05 level. Therefore the measurements of the
X-rays of only the left side of these fifteen subjects were considered for
the estimation of stature. X- rays of the ulna of the right side alone
were taken of another 15 individuals (10 male and 5 female). Thus a
total of 30 X-rays (14 males and 16 females) were used to estimate
stature (Table 1). Names of persons from whom X-rays were taken
[image:30.612.90.507.522.610.2]were shown in appendix (7).
Table 1: Sex – side distribution
Male Female
Left side 4 11
Right side 10 5
The X-rays were taken showing both ends of the ulna and
measuring the maximum length of the ulna on the X-rays a horizontal
line was drawn at the most distal point of the styloid process of the
ulna and a second horizontal line was drawn through the most proximal
point of the ulna (superior-most point of the olecranon process of the
ulna) (Fig. 16). The maximum ulnar length was the distance between
these two points as measured by a scale (Singh, 1973). The following
bony markers: AD, AB, IJ and BF were measured in the radiograph with
the help of a measuring scale and an X-ray lobby, (Fig. 16 and 17). The
radiographic markers taken from 15 individuals (15 right and 15 left)
showed in appendix (8). The radiographic markers taken from 30
individuals (15 right and 15 left) showed in appendix (9). Mean,
standard deviation, standard error of the radiographic markers of individuals showed in appendix (10).
Statistical analysis
Between-group comparison (right and left) was done for all
the bony markers and radiographic markers using independent t- test.
Pearson correlation test was done to assess the correlation of the
markers and length (Appendix 3, 4, 5 and 11). Regression analysis was
carried out to find the markers that correlated with length. Based on the
regression analysis, equations were derived for constructing the length
of the ulna from the significant bony markers (P<0.05 was considered
statistically significant). Multivariate equations were derived after
excluding highly correlated markers using stepwise method. All
After formulating the equations to estimate the length of the ulna
a restricted sample of five bones were selected. These five bones had
not been taken from the set of bones used to derive the formulae. The
length of the ulna was estimated using the multiple regression
equations derived from bony markers. This was compared with the
RESULTS
Study on Bones
Range, mean and standard deviation and standard error were
determined for the measurements of maximum length of ulna and the
markers (Appendix-2)
Independent t-test was applied to find any significant difference in the
means between the left and right ulnae (Table-2).
There was no statistically significant difference in the means of the
Table 2: Independent t-test of bone markers (Right=63, Left=47)
Right Left Right Left
Marker
Mean SD Mean SD SE SE P
value
AB 2.08 0.23 2.10 0.22 0.29 0.32 0.628
CB 2.9 0.31 2.9 0.31 0.04 0.04 0.673
GH 1.38 0.17 1.37 0.22 0.92 0.03 0.679
EG 3.8 0.42 3.63 0.59 0.05 0.08 0.06
EH 3.61 0.58 3.7 0.34 0.07 0.05 0.28
CF 2.90 0.35 3.01 0.37 0.043 0.05 0.13
EB 3.38 3.33 0.39 0.43 0.05 0.06 0.57
AF 2.86 0.44 2.84 0.45 0.05 0.06 0.09
EA 2.10 0.32 2.08 0.25 0.04 0.03 0.70
AJ 2.47 0.30 2.41 0.25 0.38 0.36 0.29
AD 2.32 0.31 2.26 0.30 0.04 0.05 0.261
BF 3.00 0.33 3.09 0.35 0.04 0.05 0.179
IJ 1.69 1.77 1.61 2.0 0.02 0.03 0.071
Length 25.40 2.02 25.59 1.73 0.25 0.26 0.29
The correlation coefficient between the maximum length of the
ulna and each of the markers was determined. The length of the ulna ‘y’
was regressed on each of the markers x and simple regression models
at y = a + bX were derived, where ‘a’ is a constant (baseline) and ‘b’ is
the regression coefficient.
Table 3, 4, 5 shows the markers, and their correlation with
the length of the ulna.
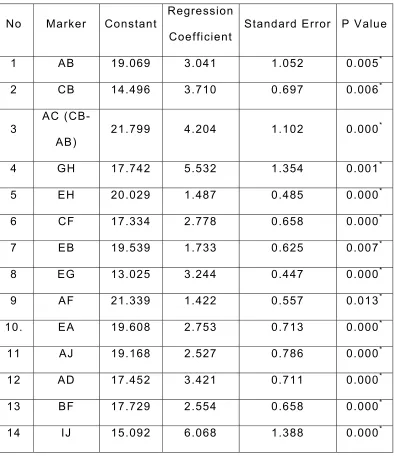
For the ulnae of the right side:(Table-3) all the markers (AB,
CB, AC, BF, EG, EH, EB, AF, EA, AJ, AD, BF, IJ, GH) show significant
correlation with the length of the ulna (p<0.05).
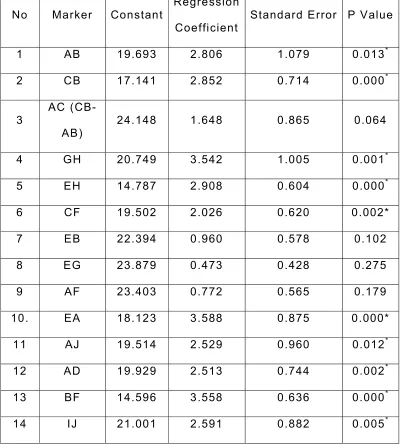
For the ulnae of the left side (Table-4) the markers CB, EH, EA,
AJ, AD, BF, IJ, AB, GH, and CF, show significant correlation with the
length of the ulna (p<0.05).
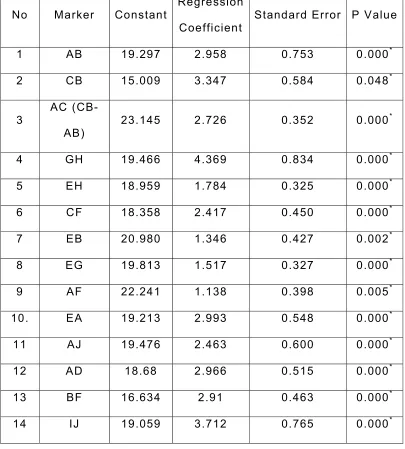
For the ulnae of both side;(Table-5) all the markers (AB, CB,
AC, BF, EG, EH, EB, AF, EA, AJ, AD, BF, IJ, GH) show significant
correlation with the length of the ulna (p<0.05).
By the regression analysis simple regression equations were
Simple regression equations for the right side
Length=19.069+(3.041 AB)
Length=14.496+(3.710 CB)
Length=21.799+(4.204 AC)
Length=17.742+(5.532 GH)
Length=13.025+(3.244EG)
Length= 17.334+(2.778 CF)
Length=19.539+(1.733EB)
Length=21.339+(1.422AF)
Length=19.608+(2.753EA)
Length=19.168+(2.527AJ)
Length=17.452+(2.554BF)
Length=15.095+(6.068IJ)
Length=17.452+(3.421AD)
Length=20.029+(1.487EH)
Simple regression equations for the left side
Length= 19.693+(2.806AB)
Length= 17.141+(2.852CB)
Length= 20.749+(3.542GH)
Length=14.787+(2.908EH)
Length=19.502+(2.026CF)
Length=18.123+3.588EA)
Length=19.514+(2.529AJ)
Length=14.596+(3.558BF)
Length=21.001+(2.591IJ)
Simple regression equations for both sides
Length=19.297+(2.958AB)
Length= 15.009+(3.347CB)
Length=23.145+(0.352AC)
Length=19.466+(0.834GH)
Length=18.959+(1.784FH)
Length=18.358+(2.417CF)
Length=20.980+(1.346EB)
Length=19.813+(1.517EG)
Length=22.241+(1.138AF)
Length=19.213+(2.993EA)
Length=19.47+(2.463AJ)
Length=18.68+(2.91AD)
Length=17.729+(2.55BF)
Table 3: Univariate analysis of bony markers of ulnae of the right side. Here length of the ulna (dependent variable-y) has been correlated w ith the bony markers (independent variables) Right side; Number=63
No Marker Constant Regression
Coefficient Standard Error P Value
1 AB 19.069 3.041 1.052 0.005*
2 CB 14.496 3.710 0.697 0.006*
3
AC
(CB-AB) 21.799 4.204 1.102 0.000
*
4 GH 17.742 5.532 1.354 0.001*
5 EH 20.029 1.487 0.485 0.000*
6 CF 17.334 2.778 0.658 0.000*
7 EB 19.539 1.733 0.625 0.007*
8 EG 13.025 3.244 0.447 0.000*
9 AF 21.339 1.422 0.557 0.013*
10. EA 19.608 2.753 0.713 0.000*
11 AJ 19.168 2.527 0.786 0.000*
12 AD 17.452 3.421 0.711 0.000*
13 BF 17.729 2.554 0.658 0.000*
14 IJ 15.092 6.068 1.388 0.000*
Table 4: Univariate analysis of bony markers of ulnae of the right side. Here length of the ulna (dependent variable-y) has been correlated w ith the bony markers (independent variables) Left side; Number=47
No Marker Constant Regression
Coefficient Standard Error P Value
1 AB 19.693 2.806 1.079 0.013*
2 CB 17.141 2.852 0.714 0.000*
3
AC
(CB-AB) 24.148 1.648 0.865 0.064
4 GH 20.749 3.542 1.005 0.001*
5 EH 14.787 2.908 0.604 0.000*
6 CF 19.502 2.026 0.620 0.002*
7 EB 22.394 0.960 0.578 0.102
8 EG 23.879 0.473 0.428 0.275
9 AF 23.403 0.772 0.565 0.179
10. EA 18.123 3.588 0.875 0.000*
11 AJ 19.514 2.529 0.960 0.012*
12 AD 19.929 2.513 0.744 0.002*
13 BF 14.596 3.558 0.636 0.000*
14 IJ 21.001 2.591 0.882 0.005*
Table 5: Univariate analysis of bony markers of ulnae of both sides. Here length of the ulna (dependent variable-y) has been correlated w ith the bony markers (independent variables) Number= 110
No Marker Constant Regression
Coefficient Standard Error P Value
1 AB 19.297 2.958 0.753 0.000*
2 CB 15.009 3.347 0.584 0.048*
3
AC
(CB-AB) 23.145 2.726 0.352 0.000
*
4 GH 19.466 4.369 0.834 0.000*
5 EH 18.959 1.784 0.325 0.000*
6 CF 18.358 2.417 0.450 0.000*
7 EB 20.980 1.346 0.427 0.002*
8 EG 19.813 1.517 0.327 0.000*
9 AF 22.241 1.138 0.398 0.005*
10. EA 19.213 2.993 0.548 0.000*
11 AJ 19.476 2.463 0.600 0.000*
12 AD 18.68 2.966 0.515 0.000*
13 BF 16.634 2.91 0.463 0.000*
14 IJ 19.059 3.712 0.765 0.000*
The correlation between the markers was analyzed by
correlation tests. This was done for bones of the both sides (Appendix;
3), right side (Appendix 4), and left side (Appendix 5). Pearson’s
correlation coefficient for bony markers of the right side, left side and
both sides are shown below.
Pearson’s correlation coefficient for bony markers of the
right side
CB and AC: 0.724
AB and CB: 0.726
CB and AC: 0.659 CB and EG: 0.745
CB and EA: 0.637
CB and AD: 0.625
EG and AC: 0.622
EA and AC: 0.613
EA and EG: 0.694
AD and EG: 0.621
AJ and AF: 0.701
Pearson’s correlation coefficient for bony markers of the
left side
CB and AC: 0.724
EA and EH: 0.649
AJ and AF: 0.617
BF and EH: 0.665
BF and EA: 0.616
Pearson’s correlation coefficient for bony markers of both
sides
AB and CB: 0.615
CB and EA: 0.607
AF and AJ: 0.663
After excluding the highly correlated bony markers multiple linear
regression equations were constructed using the stepwise method.
Appendix (6) shows stepwise analysis of markers of both side for
finding out multi-variate equation. For ulnae of the right side EG was
the best marker to estimate the ulnar length by multivariate analysis.
For ulnae of the left side BF and GH were the best markers for
predicting ulna length. For ulnae of both sides CB, BF, GH, EH, and
Table 6: Equation for finding length of ulnae of both sides from bony markers by stepw ise analysis
Model Standard
Error
P Value N
CONSTANT 10.668 1.553 0.000 110
CB 1.171 0.584 0.048 110
BF 1.325 0.480 0.007 110
GH 1.614 0.792 0.044 110
EH 0.707 0.313 0.026 110
AD 1.099 0.533 0.042 110
Multivariate equations
Right side: Length=13.025+(3.244EG)
Left side: Length=12.821+(3.08BF)+(2.376GH)
Both sides:
Length=10.668+(1.171CB)+(1.325BF)+(1.614GH)+(0.707EH)
Results of Study of X-Rays and Analysis
Appendix 10 shows the descriptive statistics of the
radiographic markers. Mean, standard error, standard deviation of the
markers and length of 30 ulnae of different individuals
Table 7 shows the independent t-test of 30 radiographs of
15 individuals (15 right, 15 left). There was no significant difference
between the group means on the right and left sides of the same
[image:44.612.89.526.383.573.2]individuals.
Table 7: Independent t-test of radiographic markers of 15 individuals (Right=15, Left=15)
Right Left Right Left
Marker
Mean SD Mean SD SE SE P value
AD 2.06 0.20 2.03 0.19 0.52 0.51 0.72
BF 3.09 0.28 2.98 0.25 0.072 0.06 0.28
IJ 1.57 0.13 1.51 0.12 0.34 0.03 0.21
AB 2.32 0.26 2.32 0.24 0.07 0.06 0.94
Length 25.52 1.96 25.36 2.04 0.51 0.53 0.82
SD-standard deviation, SE-standard error
Table 8 shows the Independent t-test of radiographic
another 15 individuals). Only IJ and length show a significant difference
between the group means.
Table 8: Independent t-tests of radiographic markers of different individuals (Right=15, Left=15)
Right Left Right Left
Marker
Mean SD Mean SD SE SE P
value
AD 2.7 0.21 2.03 0.2 0.53 0.05 0.66
BF 3.17 0.28 2.99 0.25 0.07 0.65 .07
IJ 1.76 0.21 1.51 0.12 0.05 0.05 0.001*
AB 2.5 0.42 2.3 0.25 0.11 0.06 0.218
Length 27.2 2.34 25.47 1.87 0.61 0.48 0.03*
Height 158.6 8.92 164.1 10.87 10.87 2.81 0.23
SD-standard deviation, SE-standard error * denotes P<0.05
(significant)
Table 9 shows the Univariate analysis of radiographic markers. The
length of the ulna (dependent variable y) was analyzed against the
radiographic markers (independent variable). This table shows the
constant, regression coefficient, standard error, and level of
significance of markers on the left side (No.=15). All the markers had a
significant correlation with the length of the ulna except AD. The length
Table 9: Univariate analyses of radiographic markers on radiographs. Here length of the ulna (dependent variable y) analyzed against the markers (independent variable) Number 15, side: left
No. Marker Constant Regression
Coefficient
Standard.
Error
P Value
1 AD 18.847 3.259 2.612 0.206
2 AB 12.67 5.519 1.413 0.002*
3 IJ 13.007 8.277 2.271 0.037*
4 BF 9.355 5.397 2.038 0.002*
* denotes P<0.05 (significant)
Table 10 shows Univariate analysis of bony markers on
radiographs of the right side. The markers AD and IJ had a significant
correlation with the length except AB.
Table 10: Univariate analysis of bony markers on radiographs. Here length of the ulna (dependent variable-y) analysed against the bony markers (independent variable) Number 15, side: right
No. Marker Constant Regression
Coefficient
Standard
Error
P Value
1 AD 14.009 6.399 2.449 0.029*
2 AB 21.967 2.124 1.422 0.159
3 IJ 13.457 7.857 3.569 0.004*
4 BF 14.4 4.049 1.434 0.068
[image:46.612.106.528.510.674.2]Appendix 11 shows Pearson’s correlation coefficients of
radiographic markers of 30 individuals (correlation between IJ and BF
is 0.65).
Table 11 shows values for the multivariate equation for finding length
of ulna of both sides from radiographs after stepwise analysis (No.=30).
A multiple regression equation was derived to find out the length of the
ulna from the radiographic markers after excluding highly correlated
markers by stepwise analysis:
[image:47.612.90.466.431.566.2]Length=3.195+(3.951AD)+(2.331AB)+(3.076BF)
Table 11: Values for the multivariate equation for finding length of ulna of both sides from radiographs after stepw ise analysis
(No.=30)
Model Coefficient Standard
Error
P Value N
AD 3.951 1.507 0.014* 30
AB 2.331 0.913 0.017* 30
BF 3.073 1.213 0.018* 30
Table 12 shows the values for the equation for stature for ulnae from
radiographic markers. Height=63.07+ L x 3.540
Table12: Regression equations for height from radiographic markers of 30 individuals.
Model Coefficient
Standard
error P value
Length 3.540 0.502 0.000*
Constant=63.070 * denotes P<0.05 (significant)
The accuracy of the bone analysis equations was tested
using a restricted sample of five ulnae. The accuracy was found to be +
0.6 –1.5cm for ulnae of both sides (Table 13) for ulnae of the right side
+1.4 to –2.1cm (Table 14) and for ulnae of the left side +0.5 to +1.5cm
Table 13: Comparison of estimated length of the ulna with actual length (Both sides).
GH AD EH CB BF Calculated
Length
Actual
Length
Difference
1.25 2.4 3.96 3.05 3.6 26.47 25.5 0.97
1.29 2.4 3.6 2.95 3.15 25.56 26.6 -1.04
1.3 2.24 3.9 3.2 3.4 26.24 25.6 0.64
1.35 2.1 3.85 2.51 3.14 24.98 26.4 -1.42
1.4 2.45 3.65 3 3.2 25.95 27.5 -1.55
Table 14 Comparison of estimated length of the ulna w ith actual length (Right side)
EG
Calculated
Length
Actual
Length Difference
4.3 26.957 25.6 1.357
3.82 25.4018 27.5 -2.0982
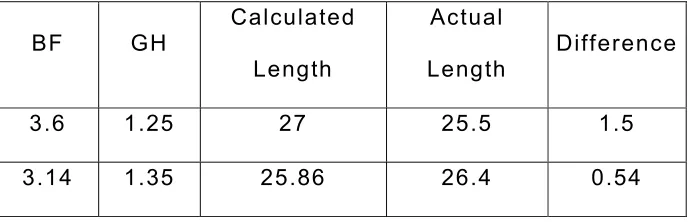
[image:49.612.142.427.487.628.2]Table 15 Comparison of estimated length of the ulna w ith actual length (Left side)
BF GH Calculated
Length
Actual
Length
Difference
3.6 1.25 27 25.5 1.5
DISCUSSION
This is the first study on the estimation of stature from bony
fragments of the proximal end of ulna of unknown sex and stature. The
only other study on fragments of the proximal end of ulna from India
was reported by Badkur and Nath (1990). In our study we measured
fourteen bony markers on the proximal end of 110 ulnae (right-63,
left-47) and four markers on the proximal end of the ulna on 30
radiographs. The proximal end of the ulna is less prone to destruction
with the passage of time and environmental degradation (Purkait,
2001).
There was no significant difference between the means of the markers on right and left bones, in the present study, which is in
accordance with previous studies by Badkur and Nath, 1990; Choi et
al., 1997; and Cheng et al., 1998. Studies on the radius showed that
few markers showed a significant difference between the sides (Holla
et al., 1996; Selvaraj et al., 1998).
a) Estimation of length of the ulna from bony markers
All the fourteen markers of the ulna on the right side (AB, CB,
AC, GH, EH, CF, EB, EG, AF, EA, AJ, AD, BF and IJ) had a significant
correlation with the length of the ulna (p<0.05). On the left side, ten
markers, i.e., AB, CB, GH, EH, CF, EA, AJ, AD, BF and IJ showed
statistically significant correlation with the length of the ulna. From
Badkur and Nath (1990) had studied three markers at the upper
end of the ulna, i.e., height of the radial facet, height of ulnar
tuberosity and breadth of olecranon. A combination of four fragmentary
measurements proved to be the most effective in multiple regression
equation. These four were upper shaft circumference, breadth of distal
epiphysis, height of ulnar tuberosity and sagittal diameter. They derived
stature equations (simple and multiple regressions) from fragment
separately for males and females. The 14 markers taken for this study
were different from Badkur ’s study. In this study sex and stature of the
individuals were not known. But Badkur derived simple and multiple
regression equation for estimation of length and stature for male and
female separately. In this study, simple and multiple regression equations were derived for estimation of length of ulna for right, left
and both sides from bony markers. For ulnae of the right side EG was
the best marker to determine the ulna length using multivariate
analysis. For ulnae of the left side BF and GH were the best markers
for predicting the length of the ulna. For ulnae of both sides CB, BF,
GH, EH, and AD were the best markers in predicting the length of the
ulna. Krogman and Iscan (1986) noted that the reliability of statural
estimation by using fragments depends primarily on correct
determination of defined landmarks, and there is a chance that
interobserver error would cause a problem.
The accuracy of the bone analysis equations was tested using a
–1.5cm for ulnae of both sides; for ulnae of the right side +1.4 to –
2.1cm and for ulnae of the left side +0.5 to +1.5cm.
b) Estimation of stature from the length of the ulna
Telkka (1950) emphasized the importance of the prediction of
human stature on the basis of long bones. People have estimated
stature from body parts like limb segments (Cheng, 1998), entire ulna
(Joshi et al., 1964) and from fragments of the radius (Holla et al.,
1996). Estimation of stature from long bones is based upon the
principle that the length of long bones correlates positively with stature
(Prasad et al., 1996). Trotter and Gleser (1952, 1958) performed
studies on the casualties of World War II and the Korean War and
prepared formulae for the estimation of stature from the postmortem
lengths of long bones. Forensic anthropologists are often confronted
with fragmentary remains. Smaller linear segments exhibit weaker
relationships to stature than larger segments (Mysorekar et al., 1982a).
Deriving stature from bone length versus may be more appropriate than
stature from fragment length. When a small fragment is presented, if it
is only a portion of a linear segment described in literature, bone length or stature cannot be calculated using the available regression
equations. It is worth having regression equations for bone length or
stature that apply to smaller linear and small bony markers which may
be available. The
study of Badkur and Nath (1990) on 288 ulnae (82 males and 62
fragmentary measures of the ulna, while sex differences were highly
significant. They reported that breadth of the olecranon provided the
best estimate of stature in both sexes. Of the two linear measurements
height of radial facet provided a better estimate of stature than the
height of the ulnar tuberosity. Upper shaft circumference provided a
better estimate for males while lower shaft circumference provided a
better estimate for females. They reported that height of the radial
facet and transverse breadth of olecranon provided the best estimate of
stature for both sexes. Male ulnae exhibit greater dimensions for all the
measurements than the female ones. The sexes of the ulnae in the
present study were not known.
The formula derived from one racial group may be unsatisfactory
when applied to another population (Trotter and Gleser, 1952; Keen,
1953). In the present study attempts to establish the age, sex and race
of the individuals from whom these bones originated have not been
done. Although sex and age were not considered in the present study,
the statistically highly significant formulae provide a means for
establishing the stature of an individual with adequate accuracy. If the
age and sex were known the formulae would be more accurate
(Mysorekar et al., 1982b). Vettivel et al. (1995) used the intertubercular
sulcus of the humerus as a marker to indicate the length of the
humerus. Prasad et al. (1996) reconstructed the length of the femur
using the markers at the proximal end of the femur. Holla et al. (1996)
estimated the length of the radius from markers at the distal end of the
In estimating stature various factors should be borne in mind. Age
has particular significance because stature increases until epiphyseal
fusion at 18 to 19 yrs of age Trotter (1958), and diminishes after 30
years of age at the rate of 1.6 mm / year (Galloway, 1988).
According to Munoz (2001) the length of long bones showed
greater correlation with stature in females than in males that probably
reflects the more significant contribution of factors others than limb
length to stature in females, such as the dimensions of the thorax and
head.
Length of the ulna can be used to estimate the stature of an
individual from the regression equations, conversion tables, and
multiplying factors that are used in forensic anthropometry (Trotter and Gleser, 1958).
Telka, 1950 reported that there were increases in stature with
advancing generations. Actual bone measurements were first used to
make a table by means of which the stature could be predicted (Orfila,
1831). Humphry (1858) made the corresponding tables in England.
Estimation of stature is a major forensic anthropological concern
used in the identification of unknown and mingled human remains
(Krogman and Iscan, 1986). The procedure to estimate body height is
to use its components.
It has been shown that a single dimension can estimate the
stature of an unknown person with great accuracy. Dimensions from the
lower extremity have greater correlation with the body height than
stature from fragments of long bones, the length of the long bone
should be estimated initially. This is then employed in the statural
formulae. Muller (1935) carried out the first work on fragmentary long
bones. He worked on fragments of radii, humeri and tibiae. In 1969,
Steele and McKern worked on fragments of femurs, tibiae and humeri.
From these fragments they estimated the length of the individual long
bones. This was later employed in the statural formulae derived by
Trotter and Gleser (1958) and Genoves (1967) for Mongoloids, to
estimate the stature of the individual.
C) Estimation of length of ulna and stature from
radiographic markers
From the radiographs it was noted that there was a significant
correlation between four markers, i.e., AD, BF, IJ and AB and the length
of the ulna. Multilinear regression equations were derived to estimate
the length of the ulna, and the stature of the individuals.
In the present study of radiographic markers all subjects were aged between
30-65 years and the equations derived for the ulna do not necessarily apply to
younger or more elderly groups. There was no significant difference between the
means of the markers of the left and the right sides when these were measured on
the X-rays of the same individuals. This was similar to the findings of Purkait
(2001). Multiple regression equations were derived to determine the length of the
ulna from the radiographic markers. A simple linear regression was derived to
determine the height of the individual form the length of the ulna. Himes et al.
in children and adults. Athawale (1963) studied the length of the ulna from twelve
cadaver forearms and found that the average difference between the skiagram
length and the actual length of the wet bone were statistically insignificant.
Differences in measurement of stature of up to 2-5cm according to the time of the
day have been reported by Genoves (1966). Body posture may also be significant
in deciding stature (Snow and Williams, 1971). Accordingly in the present study all
subjects were measured at the same time of the day and in same position.
In the present study fourteen bony markers on the
proximal end of 110 ulnae (right-63, left-47) and four markers on the
proximal end of the ulna on 30 radiographs were measured.
a) Analysis of bony markers:
Range, mean, standard deviation and standard error were
determined for the measurements of the markers and for the maximum
length of the ulna.
Independent t-test was applied to find any significant
difference in the means between the left and right ulnae (Table-2).
There was no statistically significant difference in the means of the markers.
Univariate regression analysis shows that there was a
significant correlation between 14 markers (AB, CB, AC, GH, EH, CF,
EB, EG, AF, EA, AJ, AD, BF and IJ) on the right side with the length of
the ulna.
Univariate regression analysis shows that there was a
significant correlation between 10 markers (AB, CB, GH, EH, CF, EA,
AJ, AD, BF and IJ) on the left side with the length of the ulna.
Univariate regression analysis shows that there was a
significant correlation between 14 markers (AB, CB, GH, EG, EH, CF,
Univariate equations were derived for estimating length of
the ulna from bony fragments of upper end of ulna.
After excluding the highly correlated bony markers multiple linear regression equations were constructed using the stepwise
method.
Multivariate equations
For Ulnae of the Right side: EG was the best marker to estimate the
ulnar length.
Length=13.025+(3.244EG)
For Ulnae of the Left side: BF and GH were the best markers for
predicting ulna length.
Length=12.821+(3.08BF)+(2.376GH)
For Ulnae of Both sides: CB, BF, GH, EH, and AD were the best
markers to predict the length of the ulna.
Length=10.668+(1.171CB)+(1.325BF)+(1.614GH)+(0.707EH)+(1.099AD)
The accuracy of the multivariate equations of bone analysis
was found to be + 0.6 to –1.5cm for ulnae of both sides; for ulnae of
the right side +1.4 to –2.1cm and for ulnae of the left side +0.5 to
b) Analysis of radiographs
Range, mean, standard deviation and standard error were
determined for the measurements of maximum length of the ulna and
the markers.
Independent t-test was applied to find any significant
difference in the means between the markers of the left and right ulnae
of fifteen individuals. There was no significant difference in mean of the
markers (p<0.05).
Independent t-test was applied to find any significant
difference in the means between the markers of the left (15 subjects)
and right (15 subjects) ulnae of different individuals. Only IJ and length
showed a significant difference between the group means.
Univariate regression analysis of the markers showed that
all the markers show a significant correlation with the length of the ulna
except AD on the left side (15 subjects).
Univariate regression analysis of the markers shows that all
the markers show significant correlation with the length of the ulna
except AB and BFon the right side (15 subjects).
The multivariate equation for determining the length of ulna
from radiographs of both sides of thirty different individuals was
determined by stepwise analysis after excluding the highly correlated
markers:
The regression equation for estimating height from the
length of the ulna was derived from the data from X-rays of 30
individuals: Height = 63.07+ L X 3.540
Estimation of stature from ulnar fragments has potential for
application in physical anthropology and forensic identification of an
individual. The equations, multiplication factors and conversion tables
that are widely used to convert the bone length to stature provide
reasonably accurate stature estimation for forensic anthropometric
purposes.
The regression values derived from the modern population of the
southern part of India to estimate length of ulna can be applicable to
other populations and thereby be a step to predict the stature of an individual. It has been shown that even a single bony marker for right
side, the distance between the tip of the olecranon process posteriorly
and the anterior -most point on the radial notch (EG) can be used to
estimate the length of the ulna with great accuracy, and this can be
BIBLIOGRAPHY
1. Abdel-Malek AK, Ahmed AM, Sharkawi SAEAE, Hamid NAEMAE. Prediction of stature from hand measurements. Forensic Science International 1990; 46:181-7.
2. Allbrook D. The estimation of stature in British and East African males: based on tibial and ulnar bone lengths. Journal of Forensic Medicine 1961; 8:15-28 as quoted by Krogman WM, Iscan MY. The Human Skeleton in Forensic Medicine. Charles C, Thomas, Springfield. 2nd Ed. 1986: 303-49.
3. Athawale MC. Estimation of height from lengths of forearm bones. A study of one hundred Maharashtrian male adults of ages between twenty- five and thirty years. American Journal of Physical Anthropology 1963; 21:105-112. 4. Attallah NL, Marshall WA. The estimation of stature from anthropometric and
photogrammetric measurements of the limbs. Medical Science and the Law 1986; 26(1): 51-59.
5. Badkur P, Nath S. Use of regression analysis in reconstruction of maximum bone length and living stature from fragmentary measures of the Ulna. Forensic Science International 1990; 45:15-25.
6. Breitinger, E Zur Bereechnug der Korperhohe aus den langen Gliedmassenknochen. Anthropol Anzeiger 1937; 14:249-274, as quoted by Krogman WM, Iscan MY. The Human Skeleton in Forensic Medicine. Charles C, Thomas, Springfield. 2nd Ed. 1986: 349.
7. Cheng JCY, Leung SSF, Chiu BSK, Tse PWT, Lee CWY, Chan AKH, Guo Xia MD, Leung AKL, Xu YYY. Can We Predict Body Height from Segmental Bone Length Measurements? A Study of 3,647 Children. Journal of Pediatric Orthopaedics 1998; 18(3): 387-93.