SIMULTANEOUS DETERMINATION OF CODEINE
PHOSPHATE, CHLORPHENIRAMINE MALEATE AND
SODIUM BENZOATE IN COUGH SYRUP FORMULATION
Dissertation work submitted to
The Tamilnadu Dr. M.G.R. Medical University, Chennai in partial fulfillment for the Award of Degree of
MASTER OF PHARMACY (PHARMACEUTICAL ANALYSIS)
Submitted by
N.DEEPIKA
Reg No. 26106421
UNDER THE GUIDANCE OF
INSTITUTIONAL GUIDE INDUSTRIAL GUIDE
Mr. P.R VIJAI ANAND, M. PHARM.,(Ph.D) Dr. M. Usseni Reddy Assistant Professor, Department of Analysis, Manager, A R&D dep. RVS College of Pharmaceutical Sciences, VIVIMED LABS, Sulur,Coimbatore. Hyderabad.
MAY 2012
DEPARTMENT OF PHARMACEUTICAL ANALYSIS R.V.S. COLLEGE OF PHARMACEUTICAL SCIENCES
This is to certify that the dissertation work entitled “RP-HPLC METHOD DEVELOPMENT AND VALIDATION FOR SIMULTANEOUS DETERMINATION OF CODEINE PHOSPHATE, CHLORPHENIRAMINE MALEATE AND SODIUM
BENZOATE IN COUGH SYRUP FORMULATION” is a bonafide work of Ms.
N.DEEPIKA(26106421) carried out in VIVIMED LABS, HYDERABAD under the
supervision of Dr. M. Usseni Reddy, and has completed to my fullest satisfaction for partial fulfilment of the award of degree of Master of Pharmacy in Pharmaceutical Analysis, RVS college of Pharmaceutical Sciences, Sulur, Coimbatore, which is affiliated to The Tamilnadu Dr.M.G.R Medical University, Chennai. It is to certify that the part or whole of the work has not been submitted either to this university or any other university. This work is original and confidential.
INSTITUTIONAL GUIDE
Mr.P.R.VIJAI ANAND, M.Pharm.,(Ph.D)
Date: Assistant Professor,
Place: Department of Pharmaceutical Analysis,
R.V.S College of Pharmaceutical Sciences
This is to certify that the dissertation work entitled “RP-HPLC METHOD DEVELOPMENT AND VALIDATION FOR SIMULTANEOUS DETERMINATION OF CODEINE PHOSPHATE, CHLORPHENIRAMINE MALEATE AND SODIUM
BENZOATE IN COUGH SYRUP FORMULATION” is a bonafide research work done
by Ms. N.DEEPIKA (26106421) carried out in VIVIMED LABS,HYDERABAD, under the
guidance of P.R.VIJAI ANAND, M.Pharm.,(Ph.D.),Assistant Professor, RVS College of pharmaceutical science, Sulur and Mr. Dr. M. Usseni Reddy, Manager, A R&D dep. VIVIMED LABS,HYDERABAD, for partial fulfilment of the requirement for the award of
Master of Pharmacy in Pharmaceutical Analysis, R V S college of Pharmaceutical
Sciences, Sulur, Coimbatore, which is affiliated to The Tamilnadu Dr.M.G.R Medical University, Chennai.
Dr.R.VENKATANARAYANAN.M.Pharm., Ph.D.,
PRINCIPAL,
R.V.S College of Pharmaceutical Sciences
Sulur, Coimbatore-641402.
Date:
CERTIFICATE
This is to certify that the dissertation work entitled “RP-HPLC METHOD DEVELOPMENT AND VALIDATION FOR SIMULTANEOUS DETERMINATION OF CODEINE PHOSPHATE, CHLORPHENIRAMINE MALEATE AND SODIUM
BENZOATE IN COUGH SYRUP FORMULATION” is a bonafide research work done
by Ms. N.DEEPIKA (26106421) carried out in VIVIMED LABS, HYDERABAD, under the
guidance of Mr. P.R VIJAI ANAND, M.Pharm.,(Ph.D.),Assistant Professor, RVS College of pharmaceutical science, Sulur and Mr. Dr. M. Usseni Reddy, for partial fulfilment of the
requirement for the award of Master of Pharmacy in Pharmaceutical Analysis, RVS
college of Pharmaceutical Sciences, Sulur, Coimbatore, which is affiliated to The Tamilnadu Dr.M.G.R Medical University, Chennai.
Dr.W.D.SAMSOLOMON.M.Pharm., Ph.D.,
Professor and Head,
Department of Pharmaceutical Analysis
R.V.S College of Pharmaceutical Sciences
Sulur, Coimbatore-641402.
Date:
CERTIFICATE
This is to certify that the dissertation work entitled “RP-HPLC METHOD DEVELOPMENT AND VALIDATION FOR SIMULTANEOUS DETERMINATION OF CODEINE PHOSPHATE, CHLORPHENIRAMINE MALEATE AND SODIUM
BENZOATE IN COUGH SYRUP FORMULATION” is a bonafide research work done in
VIVIVMED LABS, HYDERABAD by Ms. N.DEEPIKA(26106421) in partial fulfilment of
the requirement for the award of Master of Pharmacy in Pharmaceutical Analysis, RVS college of Pharmaceutical Sciences, Sulur, Coimbatore, under the supervision and guidance of Mr.P.R.VIJAI ANAND. M.Pharm, (Ph.D.), Assistant Professor, Department of Pharmaceutical Analysis, RVS College of pharmaceutical science, Sulur and Mr., Dr. M. Usseni Reddy, Manager, A R&D dep. VIVIMED LABS,HYDERABAD.
INTERNAL EXAMINER EXTERNAL EXAMINER
Place: Place: Date: Date:
ACKNOWLEDGEMENT
This dissertation would not have been possible without the guidance
and the help of several individuals who in one way or another contributed and
extended their valuable assistance in the preparation and completion of this
study.
First and foremost, my utmost gratitude to
Mr. P.R VIJAI ANAND
for his patience and steadfast encouragement to complete this study, whose
sincerity and encouragement I will never forget. Thanks a lot for the advice you
provided in paper publication for an International journal. Your assistance has
been incredible to me during this process.
Dr. R. Venkatanarayanan
, Professor and Principal, RVS College of
Pharmaceutical Sciences, Sulur, Coimbatore had kind concern and
consideration regarding my academic requirements.
Dr. Sam Solomon
,
Mr. P. Kumarnallasivan
,
Mr.Sivakumar
for
their inputs especially in the curriculum part of this study. They have shared
valuable insights in the relevance of the study to basic education.
In my daily work I have been blessed with a friendly and cheerful
group of my department members especially
Mr. BRAMAIH
, Associate
analyst, AR&D, Vivimed Labs, Hyderabad who has taught me the
validation procedures very effectively.
P J NISHA
, for her unselfish and unfailing support as my dissertation adviser.
Last but not the least, my family and the one above all of us, the
omnipresent God, for answering my prayers for giving me the strength, thank
you so much Dear Lord.
Date:
N. DEEPIKA
CONTENTS
CHAPTER-1
INTRODUCTION...1-39
CHAPTER-2
2.1 DRUG PROFILE...40-43
2.2 LITERATURE REVIEW...44-54
2.3 AIM & OBJECTIVE...55
2.4 PLAN OF WORK...56
CHAPTER-3
EXPERIMENTAL DETAILS
3.1 MATERIALS AND METHODS...57-58
3.2 METHOD DEVELOPMENT...59-63
3.3 METHOD VALIDATION...64-75
CHAPTER 4
4.1 RESULTS & DISCUSSION
4.1.1 METHOD DEVELOPMENT...76-79
4.1.2 METHOD VALIDATION...80-111
SUMMARY SHEET...112
4.2 SUMMARY & CONCLUSION...113
CHAPTER 5
LIST OF TABLES
1. LIST OF INSRUMENTAL METHODS...2
2. LIST OF COLUMN CHART SELECTION...14
3. LIST OF CHEMICALS USED...57
4. LIST OF INSRUMENTS USED...58
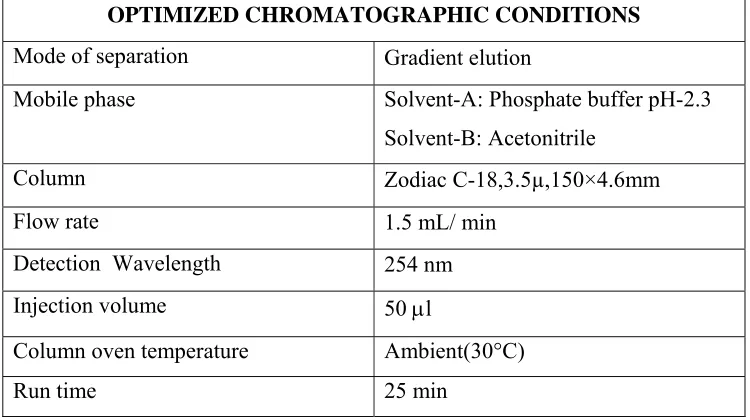
5. OPTIMIZED CHROMATOGRAPHIC PARAMETERS...61
6. GRADIENT PROGRAMME OF ELUTION...61
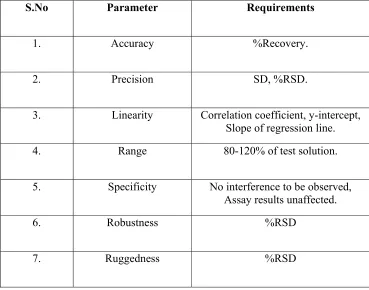
7. VALIDATION PARAMETERS & REQUIREMENTS...65
8. ASSAY RESULTS OF CP,CPM & SB...79
9. SYSTEM SUITABILITY PARAMETERS...80
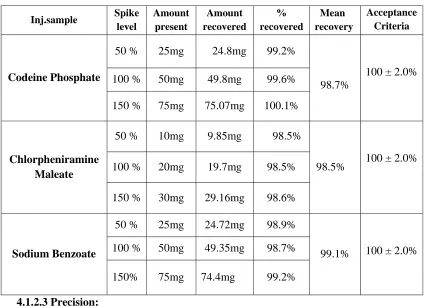
10.% RECOVERY STUDIES OF THE DRUGS...84
11.RESULTS FOR PRECISION...89
12.SPECIFICITY RESULTS OF CP,CPM & SB...93
13.LINEARITY RESULT FOR CODEINE PHOSPHATE...98
14.LINEARITY RESULT FOR CHLORPHENARAMINE MALEATE...99
15.LINEARITY RESULT FOR SODIUM BENZOATE...100
16.ROBUSTNESS RESULT FOR CHANGE IN FLOW RATE & PH ...109
17.RUGUDNESS RESULTS OF ANALYSTS 1&2 ON DAYS 1&2...111
LIST OF FIGURES
1. SYSTEMATIC DIAGRAM-HPLC...12
2. LIST OF VALIDATION PARAMETERS...34
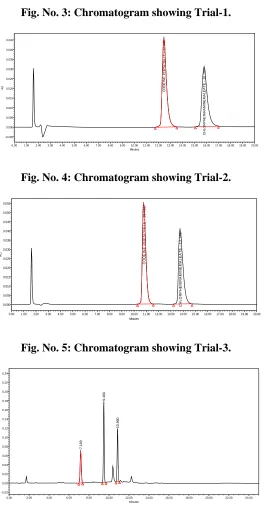
3. METHOD DEVELOPMENT TRAIL-1 CHROMATOGRAM...77
4. METHOD DEVELOPMENT TRAIL-2 CHROMATOGRAM...77
5. METHOD DEVELOPMENT TRAIL-3 CHROMATOGRAM...77
6. CHROMATOGRAM OF STANDARD SOLUTION OF CP, CPM & SB...78
7. CHROMATOGRAM OF TEST SOLUTION OF CP, CPM & SB...78
8. OVERLAY OF STANDARD & TEST SOLUTION OF CP, CPM & SB...79
9. SYSTEM SUITABILITY OF STANDARD SOLUTION OF CP, CPM & SB...81
10.CHROMATOGRAM OF ACCURACY-50% CP, CPM & SB...82
11.CHROMATOGRAM OF ACCURACY-100% CP, CPM & SB...83
12.CHROMATOGRAM OF ACCURACY-150% CP, CPM & SB...83
13.CHROMATOGRAM OF PRECISION-BLANK...85
14.CHROMATOGRAM OF PRECISION OF TEST SAMPLE-1...85
15.CHROMATOGRAM OF PRECISION OF TEST SAMPLE-2...86
16.CHROMATOGRAM OF PRECISION OF TEST SAMPLE-3...86
17.CHROMATOGRAM OF PRECISION OF TEST SAMPLE-4...87
18.CHROMATOGRAM OF PRECISION OF TEST SAMPLE-5...88
19.CHROMATOGRAM OF PRECISION OF TEST SAMPLE-6...88
20.CHROMATOGRAM OF METHOD PRECISION OF DRUGS...89
21.CHROMATOGRAM OF SPECIFICITY-BLANK SOLUTION...90
22.CHROMATOGRAM OF SPECIFICITY-STANDARD-1 SOLUTION...90
23.CHROMATOGRAM OF SPECIFICITY-STANDARD-2 SOLUTION...91
24.CHROMATOGRAM OF SPECIFICITY-STANDARD-3 SOLUTION...91
25.CHROMATOGRAM OF SPECIFICITY-STANDARD-4 SOLUTION...92
29.CHROMATOGRAM OF LINEARITY LEVEL-2(50%)...94
30.CHROMATOGRAM OF LINEARITY LEVEL-3(75%)...95
31.CHROMATOGRAM OF LINEARITY LEVEL-4(100%)...95
32.CHROMATOGRAM OF LINEARITY LEVEL-5(125%)...96
33.CHROMATOGRAM OF LINEARITY LEVEL-6(150%)...96
34.OVERLAY CHROMATOGRAM OF LINEARITY LEVELS OF CP, CPM & SB..97
35.LINEARITY GRAPH OF CODEINE PHOSPHATE...98
36.LINEARITY GRAPH OF CHLORPHENARAMINE MALEATE...99
37.LINEARITY GRAPH OF SODIUM BENZOATE...100
38.LINEARITY GRAPH OF CP, CPM & SB...101
39.CHROMATOGRAM OF ROBUSTNESS-FLOW VARIATION(1.4ml/min)..102-104 40.CHROMATOGRAM OF ROBUSTNESS-FLOW VARIATION(1.6ml/min)..104-106 41.CHROMATOGRAM OF ROBUSTNESS-PH VARIATION(2.2)...107
42.CHROMATOGRAM OF ROBUSTNESS-PH VARIATION(2.4)...108
43.CHROMATOGRAM OF RUGUDNESS-DAY-1,ANALYST-1...110
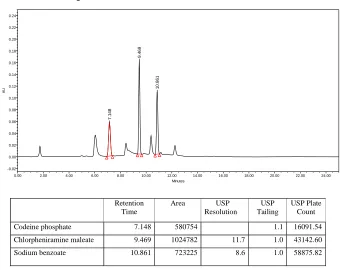
Table no: 18 Table showing Summary of results of method validation for Codeine phosphate, Chlorpheniramine maleate and Sodium Benzoate
S.No Parameter Requirement Results Acceptance
criteria CP CPM SB
1.
System suitability
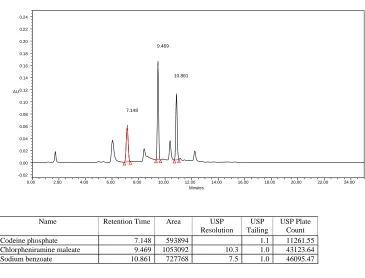
RT 7.148 9.469 10.861
2. Tailing factor 1.1 1.0 1.1 NMT 2
3. Resolution 11.7 8.6 NLT 2
4. Plate count 16091.54 58142.60 63875.82 NLT 3000
5. Assay value 99.2% 101.2% 99.8% 100 ± 2.0%
6. Accuracy % Recovery 98.7% 98.5% 99.1% 100 ± 2.0%
7. Precision %RSD 0.43 0.36 0.39 NMT 2%
8. Specificity No
interference
Pass
Pass Pass No
interference
8. Linearity Correlation
coefficient 0.999991 0.999980 0.999943 NLT 0.999
9. Range Concentration 12.5-75
µg/ml
5-30 µg/ml
12.5-75
µg/ml Nil
10. Robustness %RSD 0.41 0.38 0.39 NMT 1%
A simple, specific, accurate and stability-indicating reversed phase high performance liquid chromatographic method was developed for the simultaneous determination of Codeine phosphate, Chlorpheniramine maleate and Sodium benzoate in cough syrup formulation.By Zodiac C-18, 3.5µ,150×4.6mm column eluted with Solvent-A: Phosphate buffer pH-2.3, Solvent-B: Acetonitrile by gradient elution pattern at a flow rate of
1.5 ml/ min and a detection wavelength of 254 nm with injection volume of 50 μl at
Ambient(30°C) temperature afforded the best separation of these analytes. The retention times of Codeine phosphate, Chlorpheniramine maleate and Sodium benzoate were found to
be 7 . 1 8 min, 9.469 min and 10.86 min respectively. The system precision of this method
was evaluated by calculating the %RSD of the peak areas of six replicate injections of the standard solution, which were found to be 0.41%, 0.35% and 0.37%.Accuracy studies were performed where the % Recovery of three drugs was found to be 98.7%, 98.5% and 99.1% respectively. Linearity was established for Codeine phosphate, Chlorpheniramine maleate
and Sodium benzoate in the range of 12.5-75 μg/ml, 5-30 μg/ml and 12.5-75 μg/ml
respectively. Specificity of the current method was demonstrated by good separation of the three analytes from each other. Furthermore, excipients of the formulation did not interfere with the active ingredients of the drug product. Robustness of the current method was investigated by analyzing samples of the drug product using the same chromatographic conditions set forth in method development but with a small change in the following chromatographic parameters: Flow rate: 1.4 and 1.6 ml/min instead of 1.5 ml/min and pH of the buffer preparation in mobile phase: 2.2 and 2.4 instead of 2.3.The %RSD’s were found to
be within the limits. Ruggedness was demonstrated by analyzing three samples (assay) of
1.
INTRODUCTION
1.1 PHARMACEUTICAL ANALYSIS:
Pharmaceutical Analysis is the branch of science which deals with
identification of substances and determination of amount present in particular sample.
Also pharmaceutical analysis deals with bulk materials, dosage forms and more
recently, biological samples in support of bio-pharmaceutical and pharmacokinetic
studies.
Analysis can be divided into areas called qualitative and quantitative
analysis. Pharmaceutical products synthesized and identified using instrumental
techniques.1
These methods are used extensively in the quality assurance of raw materials,
in process quality assessment, stability of the drugs on storage and monitoring drugs
concentrations in various body fluids or tissues.
The types of analysis can be distinguished in two ways:
A. QUALITATIVE ANALYSIS: To refer identity of product, i.e., it yields useful
clues from which the molecular or atomic species, the structural features, or the
functional groups in the sample can be identified.
B. QUANTITATIVE ANALYSIS: To refer the purity of the product, i.e., the results
TYPES OF ANALYTICAL METHODS
The various methods of analysis 3 can be grouped into two categories. They are:
1. Chemical methods.
2. Instrumental methods.
Chemical Methods:
In these methods, volume and mass are used as means of detection.
1. Titrimetrical methods like acid-base, oxidation-reduction, non-aqueous,
complexometric, precipitation titrations.
2. Gravimetric and thermo gravimetric methods.
3. Volumetric methods.
Instrumental Methods:
These methods are based on the measurement of specific and non-specific physical
properties of a substance as given below:
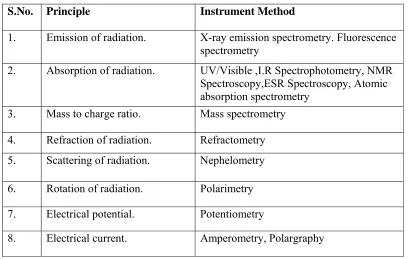
[image:28.612.120.528.449.708.2]Different Instrumental Methods Based On Principles
Table No: 1 Table showing list of instrumental methods.
S.No. Principle Instrument Method
1. Emission of radiation. X-ray emission spectrometry. Fluorescence
spectrometry
2. Absorption of radiation. UV/Visible ,I.R Spectrophotometry, NMR
Spectroscopy,ESR Spectroscopy, Atomic absorption spectrometry
3. Mass to charge ratio. Mass spectrometry
4. Refraction of radiation. Refractometry
5. Scattering of radiation. Nephelometry
6. Rotation of radiation. Polarimetry
7. Electrical potential. Potentiometry
9. Electrical resistance. Conductometry
10. Thermal properties. Differential thermal analysis, Differential
Scanning Calorimetry, Thermogravimetry
11. Partition / Adsorption. Chromatographic Techniques.
1.2 CHROMATOGRAPHY:
Chromatography (from Greek chroma, color and graphein to write) is the
collective term for a set of laboratory techniques for the separation of mixtures. It
involves passing a mixture dissolved in a "mobile phase" through a stationary phase,
which separates the analyte to be measured from other molecules in the mixture based
on differential partitioning between the mobile and stationary phases. Subtle
differences in a compound's partition coefficient result in differential retention on the
stationary phase and thus changing the separation. Chromatography may be
preparative or analytical. The purpose of preparative chromatography is to separate
the components of a mixture for further use (and is thus a form of purification).
Analytical chromatography is done normally with smaller amounts of material and is
for measuring the relative proportions of analytes in a mixture. The two are not
mutually exclusive.
The history of chromatography begins during the mid-19th century.
Chromatography, literally "color writing", was used and named in the first decade of
the 20th century, primarily for the separation of plant pigments such as chlorophyll.
New types of chromatography developed during the 1930s and 1940s made the
technique useful for many types of separation process. Some related techniques were
developed during the 19th century (and even before), but the first true
Chromatography terms
• The analyte is the substance to be separated during chromatography.
• Analytical chromatography is used to determine the existence and possibly
also the concentration of analyte(s) in a sample.
• A bonded phase is a stationary phase that is covalently bonded to the support
particles or to the inside wall of the column tubing.
• A chromatogram is the visual output of the chromatograph. In the case of an
optimal separation, different peaks or patterns on the chromatogram
correspond to different components of the separated mixture.
Plotted on the x-axis is the retention time and plotted on the y-axis a signal (for
example obtained by a spectrophotometer, mass spectrometer or a variety of other
detectors) corresponding to the response created by the analytes exiting the system. In
the case of an optimal system the signal is proportional to the concentration of the
specific analyte separated.
• A chromatograph is equipment that enables a sophisticated separation e.g.
gas chromatographic or liquid chromatographic separation.
• Chromatography is a physical method of separation in which the components
to be separated are distributed between two phases, one of which is stationary
(stationary phase) while the other (the mobile phase) moves in a definite
direction.
• The eluent is the mobile phase leaving the column.
• An eluotropic series is a list of solvents ranked according to their eluting
power.
• An immobilized phase is a stationary phase which is immobilized on the
• The mobile phase is the phase which moves in a definite direction. It may be
a liquid (LC), a gas (GC), or a supercritical fluid (supercritical-fluid
chromatography, SFC). The mobile phase consists of the sample being
separated/analyzed and the solvent that moves the sample through the column.
In the case of HPLC the mobile phase consists of a non-polar solvent(s) such
as hexane in normal phase or polar solvents in reverse phase chromatography
and the sample being separated. The mobile phase moves through the
chromatography column (the stationary phase) where the sample interacts with
the stationary phase and is separated.
• Preparative chromatography is used to purify sufficient quantities of a
substance for further use, rather than analysis.
• The retention time is the characteristic time it takes for a particular analyte to
pass through the system (from the column inlet to the detector) under set
conditions.
• The sample is the matter analyzed in chromatography. It may consist of a
single component or it may be a mixture of components. When the sample is
treated in the course of an analysis, the phase or the phases containing the
analytes of interest is/are referred to as the sample whereas everything out of
interest separated from the sample before or in the course of the analysis is
referred to as waste.
• The solute refers to the sample components in partition chromatography. • The solvent refers to any substance capable of solubilizing other substance,
• The stationary phase is the substance which is fixed in place for the
chromatography procedure. Examples include the silica layer in thin layer
chromatography.
• Techniques by chromatographic bed shape:
o Column chromatography
o Planar chromatography
Paper chromatography
Thin layer chromatography
• Displacement chromatography
• Techniques by physical state of mobile phase:
o Gas chromatography
o Liquid chromatography
• Affinity chromatography
o Supercritical fluid chromatography
• Techniques by separation mechanism:
o Ion exchange chromatography
o Size exclusion chromatography
• Special techniques:
o Reversed-phase chromatography
o Two-dimensional chromatography
o Simulated moving-bed chromatography
o Pyrolysis gas chromatography
o Fast protein liquid chromatography
o Countercurrent chromatography
1.3 HIGH PERFORMANCE LIQUID CHROMATOGRAPHY:
High Pressure Liquid Chromatography (HPLC) 5, sometimes called High
Performance liquid chromatography, is a separation that can be used for the analysis
of organic molecules and ions. HPLC is based on mechanisms of adsorption,
partition, ion exchange or size exclusion, depending on the type of stationary phase
used. HPLC involves a solid stationary phase, normally packed inside a stainless-steel
column, and a liquid mobile phase. Separation of the components of a solution results
from the difference in the relative distribution ratios of the solutes between the two
phases.
The rate of distribution of drugs between stationary and mobile phase
is controlled by diffusion process, if diffusion is minimized, a faster and effective
separation can be achieved. The techniques of HPLC are so called because of its
improved performance when compared to classical column chromatography.
Advances in column technology, high pressure pumping system and sensitive
detectors have transformed liquid column chromatography into high speed, efficient,
accurate and highly resolved method of separation. 6
HPLC is a form of column chromatography used frequently in biochemistry
and analytical chemistry to separate, identify, and quantify compounds. HPLC utilizes
a column that holds chromatographic packing material (stationary phase), a pump that
moves the mobile phase(s) through the column, and a detector that shows the
retention times of the molecules. Retention time varies depending on the interactions
between the stationary phase, the molecules being analyzed and the solvent(s) used. 7
It offers following advantages:
- Speed (many analysis can be accomplished in 20 minutes or less)
- Reusable columns (expensive columns but can be used for many analysis)
- Ideal for the substances of low volatility.
- Easy sample recovery, handling and maintenance.
- Instrumentation leads itself to automation and quantitation.
- Precise and reproducible.
- Calculations are done by integrator itself.
- Suitable for preparative liquid chromatography on a much larger scale.
TYPES OF HPLC 8:
Based on the mode of separation
• Normal phase chromatography
• Reverse phase chromatography
• Partition chromatography
• Displacement chromatography
Based on principle of separation
• Adsorption chromatography
• Ion exchange chromatography
• Size exclusion chromatography
• Affinity chromatography
• Chiral phase chromatography
• Ion pair chromatography
Based on elution technique
• Isocratic separation
• Gradient separation
Based on the scale of operation
• Preparative HPLC
Based on the mode of separation: Normal phase chromatography:
Also known as Normal phase HPLC (NP-HPLC) or Adsorption
chromatography, separate analytes based on adsorption to a stationary surface
chemistry and by polarity. It was one of the first kinds of HPLC that chemists
developed. In this type stationary phase used is polar in nature and the mobile phase
used is non-polar and non aqueous in nature. Depending on the nature of the analyte
and stationary phase. If the affinity between the stationary phase and the analyte
increases the selection time (RT) of the analyte also increases and vice versa. The
interaction strength depends not only on the functional groups in the analyte molecule
but also on steric factors. The effect of sterics on interaction strength allows this
method to resolve (separate) structural isomers.
Reverse phase chromatography
In reverse phase technique, a non-polar stationary phase is used and the mobile
phase is polar in nature. Hence polar components get eluted first and non-polar
compounds are retained for a longer time. Since most of the drugs and
pharmaceuticals are polar in nature, they are not retained for a longer time and eluted
faster, columns used in the mode of chromatogram are ODS (Octadecyl silane) or C18,
C8, C4, etc.
Partition chromatography
Partition chromatography was the first kind of chromatography that chemists
developed. The partition coefficient principle has been applied in paper
chromatography, thin layer chromatography, gas phase and liquid-liquid applications.
or fibers of an "inert" solid supporting matrix as with paper chromatography; or takes
advantage of some additional columbic and/or hydrogen donor interaction with the
solid support. Molecules equilibrate (partition) between a liquid stationary phase and
the eluent separate analytes based on the polar differences is known as Hydrophilic
Interaction Chromatography (HILIC). Partition HPLC has been used historically on
unbonded silica or alumina supports. Each works effectively for separating analytes
by relative polar differences. However, HILIC has the advantage of separating acidic,
basic and neutral solutes in a single chromatogram.
Displacement Chromatography
The basic principle of displacement chromatography is a molecule with a
high affinity for the chromatography matrix (the displacer) will compete effectively
for binding sites and thus displace all molecules with lesser affinities. In elution
mode, substances typically emerge from a column in narrow Gaussian peaks. Wide
separation of peaks, preferably to baseline, is desired in order to achieve maximum
purification. The speed at which any component of a mixture travels down the column
in elution mode depends on many factors. But for two substances to travel at different
speeds and thereby be resolved there must be substantial differences in some
interaction between the bio molecules and the chromatography matrix. Operating
parameters are adjusted to maximize the effect of this difference. In many cases,
baseline separation of the peaks can be achieved only with gradient elution and low
column loadings. Thus, two drawbacks to elution mode chromatography, especially at
the preparative scale, are operational complexity, due to gradient solvent pumping,
and low throughput, due to low column loadings. Displacement chromatography has
advantages4 over elution chromatography in that components are resolved into
Based on principle of separation: Adsorption chromatography:
When a mixture of compounds (adsorbate) dissolved in the mobile phase
(eluent) moves through a column of stationary phase (adsorbent) they travel
according to their relative affinities. The compound which has more affinity towards
stationary phase travels slower, if less affinity towards stationary phase travels faster.
Ion exchange chromatography:
It is the process by which a mixture of similar charged ions can be separated
using ion exchange resin. There is a reversible exchange of ions between the ions
present in the column. And those present in the ion exchange resin. For cations, cation
exchange resin and for anions, an anion exchange resin is used.
1) Cation exchange eg: Sulfonated polystyrenes
2) Anion exchange resin eg: Carboxylic methacrylate
Size exclusion chromatography:
It is the process by which mixture of compounds with molecular sizes are
separated by using gels. The gel used acts as molecular sieve. It can be separated by
steric and diffusion effects of pores in the gels. The compound can separate according
to the molecular sizes and the stationary phase is a porous matrix.
Eg: separation of proteins and polysaccharides.
Chiral phase chromatography:
In this type of chromatography, separation of optical isomers can be done by
using chiral stationary phases i.e., levo and dextro form can be separated by using
Ion pair chromatography:
In this chromatography, a reverse phase column is converted temporarily into
ion exchange column by using ion pairing agents like pentane or hexane.
Based on the scale of operation:
Analytical HPLC: It is used for analysis of samples. But recovery of samples is not
done since the samples used are at very low level. Eg: microgram quantities.
Preparative HPLC: It is used for separation and collection of compound mixture,
where the individual and pure compounds can be collected using fraction collector.
And the collector samples are reused. Eg: separation of few grams of mixtures.
INSTRUMENTATION OF HPLC 9:
The main components of HPLC are:
• Solvent Reservoir
• Pump
• Injection Port
• Column
• Detector
• Data Acquisition System
Solvent Reservoir:
Solvent Reservoirs are used to store Mobile-Phase. Scott Duran bottles are
commonly used as solvent reservoirs. The solvent reservoir must be made of inert
material such as glass and must be smooth so as to avoid growth of microorganisms
on its walls. It can be transparent or can be amber colored. A graduated bottle gives a
rough estimate of mobile-phase volume in the bottle. Solvent reservoirs are placed
above HPLC system (at higher level) in a tray. They should never be kept directly
above the system as any spillage of solvent on the system may damage electronic
parts of HPLC.
HPLC Pump:
The HPLC pump is very important component of the system. The
Pump delivers the constant flow of the Mobile Phase or phases so that the separation
of the components of the mixture occurs in a reasonable time. There are two types of
pumping systems Isocratic and Gradient.The gradient type pumps also classified into
two types, those are:
• High pressure mixing. Eg: Mechanical and Piston pumps.
• Low pressure mixing. Eg: Pneumatic and Quaternary pumps.
Injection Port 10:
The sample introduction device such as injector is to introduce the sample in a
flow of mobile phase at high pressure. The valve injection through fixed or variable
loop is a common way of introducing the sample. The Rheodyne valve is the mostly
used devise.
HPLC Column:
The HPLC Column holds the stationary phase for separating the components
columns, the material of construction of tubing and fittings, plumbing and
connections are also very critical. Apart from resistively to corrosion, connections and
plumbing should have very low dead volume.
Table no: 2 list of column selection chart.
Stationary phases: 11
There are many types of stationary phases employed in liquid chromatography
including:
(1) Silica, alumina or porous graphite is used in normal-phase chromatography
where the separation is based on differences in adsorption and/or mass
distribution.
(2) Resins or polymers with acid or basic groups, used in ion-exchange
chromatography, where separation is based on competition between the ions
to be separated and those in the mobile phase.
(3) Porous silica or polymers, used in size-exclusion chromatography, where
separation is based on differences between the volumes of the molecules,
corresponding to steric exclusion.
(4) A variety of chemically modified supports prepared from polymers, silica or
porous graphite, used in reversed-phase liquid chromatography, where the
separation is based principally on partition of the molecules between the
mobile phase and the stationary phase.
Column selection chart: molecular weight > 2000 g/mol
Water soluble Organic solvent
soluble
LC mode
(packing) bonded RP
(C18,
phenyl,
C4)
aqueous gel filtration
(SEC)
Ion
(5) Special chemically modified stationary phases, for example cellulose or
amylase derivatives, proteins or peptides, cyclodextrins etc., for the
separation of enantiomers (chiral chromatography).
HPLC Detectors: 12
Detectors detect various compounds as they elute out from column. The
detector gives response in terms of a millivolt (mv) signal that is then processed by
the computer (integrator) to obtain you a chromatogram. Basically detector consists of
a flow-cell through which the mobile phase and resolved sample moves optic shine
through the detector cell and variation in optical properties are detected.
The Photo Diode Array Detector (PDA) is the most used detector in LC
today. The PDA gives a three dimensional view of chromatogram (Intensity Vs
Time) and Spectra (Intensity Vs Wavelength) simultaneously. It can be called as
Spectro-chromatogram. The detailed analysis of the data reveals more information on
the complexity of co elution and helps in identifying the merged peaks and gives
information on peak purity.
Various types of HPLC Detectors:
There are several types of detectors available in the market. Those are
• UV-VIS Detector
• Photo-Diode Array Detector (PDA)
• Fluorescence Detector
• Conductometric and colorimetric detector
• Mass detector
• Evaporative Light Scattering detector (ELSD)
Among these detectors Photo Diode Array Detector (PDA) is the most widely
Vs Time) and Spectra (Intensity Vs Wavelength) simultaneously. It can be called as
Spectro-chromatogram. The detailed analysis of the data reveals more information on
the complexity of co elution and helps in identifying the merged peaks and gives
information on peak purity.
Ideal Characteristics of a Detector:
• Either is equally sensitive to all eluted peaks.
• The ideal detector give the response (area) proportional to the amount
injected, irrespective of the size of sample.
• Cheap, reliable and easy to use.
• Should not be affected by change in temperature or mobile phase
composition.
• It should be able to monitor small amounts of compound.
i. Bulk property detector:
These provide a differential measurement of bulk property possessed by
both the solute and mobile phase Ex: Refractive index. It is not suitable for
gradient elution and is less sensitive.
ii. Solute property detector:
This measures physical or chemical property that is specific to the solute
only. Ex: U.V detector, conductivity detector. These can be used for gradient
elution.
The detection of the separated compounds in the elute from the column is based
up on the bulk properties of the elute are the solute property of the individual
components generally, a detector is selected that will respond to a particular property
of the substances being separated, and ideally it should be sensitive to at least 10-8g
Data collection devices:
Signals from the detector may be collected on chart recorders or electronic
integrators that vary in complexity and in their ability to process, store and reprocess
chromatographic data. The data storage capacity of these devices is usually limited.
Modern data stations are computer based and have a large storage capacity to
collect process and store data for possible subsequent reprocessing. Analytical reports
can often be customized to the needs of the analyst.
Integration of peak areas and the setting of threshold levels are not normally
problematic in an assay since the peak of the substance to be analysed should be free
of interference. However, in a test for impurities, the selection of the peak area
integrator parameters becomes very important, particularly when baseline separations
are not always attainable. If baseline separations cannot be obtained, valley-to-valley
integration should be employed.
HPLC allows limits to be set for individual impurities and for the sum of
impurities, but there is a level at which peaks should not be integrated. This
"disregard level" is set in relation to the area of the peak in the chromatogram of the
prescribed reference solution and is usually equivalent to 0.05% of the substance
being examined.
CHROMATOGRAPHY PARAMETERS 13:
System suitability:
The system suitability test represents an integral part of the method and is used
to ensure the adequate performance of the chosen chromatographic system.
Efficiency, capacity factor resolution factor, and symmetry factor are the
parameters that are normally used in assessing the column performance. Factors that
ionic strength, apparent pH, flow rate and column length and stationary phase
characteristics such as porosity, particle size and type, and specific surface area.
Efficiency (N) 14 :
The efficiency of a chromatographic column is defined in terms of the number
of theoretical plates (N) and can be calculated using the following formula:
Where, tR = retention time or the baseline distance between the point of injection
and the perpendicular dropped from the maximum of the peak of interest.
Wh = the width of the peak of interest determined at half peak height, measured in the
same units as tR.
N = The number of theoretical plates per meters.
The column plate number increases with several factors:
1. Well-packed columns (column “quality”)
2. Longer columns
3. Lower flow rates (but not too low)
4. Smaller column-packing particles
5. Lower mobile-phase viscosity and higher temperature
6. Smaller sample molecules.
Capacity factor (mass distribution ratio, Dm):
This factor determines the retention of a solute and can be calculated from
the chromatogram using the following formula:
tM = retention time of an unretained component
A low Dm value indicates that the peak elutes close to the solvent front, which
may compromise selectivity. A minimum Dm value of 1 is recommended for the peak
of interest.
The retention time of the test substance can be varied, if necessary, by
changing the relative proportion or composition of solvents in the mobile phase.
Generally, an increase in the proportion of a more polar solvent will lead to a shorter
retention time on a normal-phase column and a longer retention time on a
reversed-phase column.
Resolution factor (Rs):
It is measure of the extent of separation of two compounds and the baseline
separation is achieved.
The resolution between two peaks of similar height in a chromatogram can be
calculated using the following formula:
Where, tR1 and tR2 = retention times or baseline distances between the point of
injection and the perpendicular dropped from the maximum of each of the two peaks.
Wb1 and Wb2 = the respective peak widths determined at half peak height, measured in
the same units as tR1 and tR2.
The value of Rs for a baseline separation between peaks of similar height should be at
Relative retention:
The relative retention (r) is calculated as an estimate using the following formula:
Where, tR2 = retention time of the peak of interest
tR1 = retention time of the reference peak
tM = retention time of an unretained component
Retention time (Rt):
Retention time is the difference in time between the points of injection and
eluted from a column. Retention time is measured in minutes or seconds. Retention
time is also proportional to the distance moved on a chart paper, which can be
measured in cm or mm.
Retention volume (Vr):
Retention volume is the volume of mobile required to elute 50% of the
component from the column. It is the product of retention time and flow rate.
Retention volume (Vr) = Retention time (Rt) x flow rate
Column Efficiency (N):
It is called as the number of theoretical plates. It measures the band spreading
of a peak. When band spread in smaller, the number of theoretical plates is higher. It
indicates a good column and system performance.
HETP (High Equivalent Theoretical Plates):
A theoretical plate can be of any height, which decides the efficiency of
separation. If HETP is less the column is more efficient. If HETP is more, the
column is less efficient. The height equivalent to a theoretical plate (HETP) is given
by-
HETP=Length of column (L)/N
Where N = plates per meter
RT = retention time of the components.
W = width of the base of the component peak using tangent method.
L = column length in meters
Symmetry factor (As):
The symmetry factor for a peak can be calculated using the following formula:
Where,Wx = width at 5% of peak height measured from the baseline.
d = baseline distance between the perpendicular dropped from the peak
maximum and the leading edge of the peak at 5% of the peak height, measured in the
same units as Wx.
Values of As which are greater than 2 may lead to incorrect integration,
resulting in erroneous quantitation. The main factors that influence peak symmetry
depend upon retention, solvent effects, incompatibility of the solute with the mobile
phase or development of an excessive void at the inlet of the column. In
reversed-phase chromatography, adsorption phenomena due to the presence of residual silanol
Tailing Factor (T):
The Tailing Factor T, a measure of peak symmetry is unity for perfectly
symmetrical peaks and its value increases as tailing becomes more pronounced. In
some cases, values less than 1 may be observed. As peak asymmetry increases
integration and hence precision becomes less reliable.
Where, W0.05 = width of peak at 5% height
f = Distance from the peak maximum to the leading edge of the peak, the distance
being measured at a point 5% of the peak height from the baseline. Limit: ≤ 2 .
1.4 METHOD DEVELOPMENT:
The need to save method development time and improve accuracy is forcing
today’s analytical chemists to look for better, faster ways to develop stability
indicating methods. Starting with HPLC columns that offer excellent reproducibility,
column lifetime and sensitivity this step-by-step protocol can save the method
development chemist time and money required to establish new method. This
approach is consistent with developing process.
PROCEDURE (PROTOCOL) FOR METHOD DEVLOPMENT Literature Survey:
Conduct literature survey and collect information available from the following
references
¾ Chemical abstracts
¾ Analytical abstracts
¾ Journals
¾ National library of medicines etc,
And collect the following literature from survey
Solubility profile: Solubility of drug in different solvents at different pH conditions
which is useful while selecting the diluents for standard solution and extraction
solvents for test solution.
Analytical profile: Physico-chemical and spectroscopic properties, impurity and
degradation profile of drug substance. Spectral profile is useful in the selection of
detector wavelength for analysis, where as degradation profile helps to develop the
method for separation of all possible impurities and degradants from API.
Stability profile: Stability of the drug with storage conditions. This helps to adopt
suitable and adequate precautions while handling drug substances and its solutions.
The various parameters that include to be optimized during method development are:
• Selection of Mode of Separation
• Selection and Optimization of Mobile Phase
• Selection of Detector Wavelength
• Selection of Column
• Selection of Solvent Delivery Systems
• Selection of Flow Rate
• Selection of Column Temperature
• Selection of Diluent and Extraction Procedure
• Selection of test concentration and injection volume
• Establishment of Stability of the Solutions
• Establishment of System Suitability
Selection of Mode of Separation:
In Reverse Phase mode, the mobile phase is comparatively more polar than the
preferred mode is reverse phase. The nature of the analyte is the primary factor in the
selection of the mode of separation. A second factor is the nature of the matrix.
Selection and Optimization of Mobile Phase:
The primary objective in selection and optimization of mobile phase is to
achieve optimum separation of all individual impurities and degradants from analyte
peak. The selection of mobile phase is done always in combination with selection of
column (stationary phase). The following are the parameters, which shall be taken
into consideration during the selection and optimization of mobile phase.
¾ Buffer, if any and its strength
¾ pH of buffer or pH of mobile phase
¾ Mobile phase composition
Buffer if any and its strength:
Buffer and its strength play an important role in deciding the peak symmetries
and separation. Various types of buffers can be employed for achieving the required
separation. The following are some of the most commonly used ones.
¾ Phosphate buffers : KH2PO4, K2HPO4, Na2HPO4, H3PO4
¾ Acetate buffers : Ammonium acetate, Sodium acetate
¾ Amine buffers : Triethyl amine/ Diethyl amine
¾ Buffers with various ion pair reagents like Tetra Butyl ammonium hydrogen
sulphate
¾ Butane sulphonic acid, Hexane sulphonic acid, Heptanes sulphonic acid etc,
It is important to use the buffers with suitable strength to cope up for the
injection load on the column otherwise peak tailing may arise due to changes in ionic
form during chromatography. The retention times also depends on the molar strength
Ideally, the strength of the buffer shall be adopted in-between 0.05M to 0.2M.
The selection of the buffer and its strength is done always in combination with
selection of organic phase composition in mobile phase. The strength of the buffer can
be altered if necessary to achieve the required separation. But it has to be ensured that
the higher strength of the buffer shall not result in precipitation/turbidity either in
mobile phase or in standard and test solution while allowed standing in bench top or
in refrigerator. Experiments shall be conducted using different buffers having
different strength to obtain the required separation.
The buffer having a particular strength, which gives separation of all
individual impurities from API peak, shall be selected. Then strength of the buffer can
be varied by about 10 to 20 % from the selected buffer strength and the effect of
variation shall be studied. After reviewing the results of variation, the buffer and its
strength shall be selected, this is rugged for at least 2% variation in strength.
pH of the buffer or pH of the mobile phase:
pH plays an important role in achieving the chromatographic separation as it
control the elution properties by controlling the ionization characteristics. Depending
on the pKa, drug molecule changes retention.
E.g.: Acids show an increase in retention as pH decreases, while bases show decrease
in retention time.
Experiments shall be conducted using buffers having different pH to obtain
the required separation. It is important the pH of the mobile phase in the range of 2.0
to 8.0 as most of the columns doesn’t withstand to a pH outside this range. This is due
to fact that the siloxane linkages are cleaved below pH 2.0, while at pH values above
If a pH outside this range is found necessary, packing materials, which can
withstand these ranges shall be chosen. pH of the buffer, which gives separation of all
individual impurities from each other and from API, shall be selected. Then pH is
varied by ±0.2 from the selected pH and effect of variation shall be studied. After
reviewing the results, a pH is selected which is rugged at least for ±0.2 of the selected
pH.
Mobile phase composition:
In reverse phase chromatography, the separation is mainly controlled by the
hydrophobic interactions between drug molecule and the alkyl chains on the columns
packing material. Most chromatographic separations can be achieved by choosing the
qualitative and quantitative composition of aqueous and organic portions. Most
widely used solvents in reverse phase chromatography are methanol and Acetonitrile.
Tetra hydro furan is also used but to a lesser extent.
Experiments shall be conducted with mobile phase having buffers with
different pH and organic phases to check for the best separation between the
impurities. A drug solution having all possible known impurities can be used for
checking the extent of separations with different mobile phase ratios. Alternatively
solution of stressed drug substance can be used to check for the separation of
impurities. A mobile phase composition which gives separation of all possible
impurities and degradants from API Peak and which is rugged at least for ± 0.5 in
both aqueous and organic phase shall be selected.
In reverse phase, methods are developed using buffers at the specified mobile
phase pH. Optimum buffering capacity occurs at a pH equal to the pKaof the buffers.
sodium salts. Diammonium hydrogen orthophosphate is used as phosphate buffer pH
2.3 and Acetonitrile.
Selection of Detector Wavelength:
Selection of detector wavelength is a critical step in finalization of the
analytical method. To determine the exact wavelength standard API is injected into
chromatographic system with Photo Diode Array detector and the wave length, which
gives higher response for the compound will be selected. An ideal wavelength is one
that gives good response for the drugs to be detected. In order to ascertain the
optimum wavelength (λmax) of the species formed. A 10µg/ml of sample solution was
prepared and scanned under UV-visible spectrophotometer in the range of 200 to
400nm against diluent as blank. The wave length selected based on the maximum
absorption occurred.
Selection of Column:
Column plays the most important role in achieving the chromatographic
separation. The following parameters should be considered while selecting a column.
¾ Length and diameter of the column
¾ Packing material
¾ Size and shape of particles
¾ Pore size, surface area and end capping
¾ Percentage of carbon loading
Columns with silica as a packing material is used widely in Normal phase
chromatography, where the eluent (mobile phase) is non-polar consisting of various
organic solvents and the stationary phase is polar. The silanol groups on the surface of
In Reverse phase chromatography a wide variety of columns is available
covering a wide range of polarity by cross linking the silanol groups with alkyl chains
like C6, C8, C18 and Nitrile groups (-CN), Phenyl groups (-C6H6) and amino groups
(-NH2).
ORDER OF THE SILICA BASED COLUMNS
I---Non Polar---Moderately Polar---Polar---I
C18 < C8 < C6 < Phenyl < Amino < Cyano < Silica
Experiments are conducted using different columns with different mobile
phase to achieve best separation. A column which separates all the impurities and
degradants from API peak and which is rugged with mobile phase variation is
selected.
Selection of Solvent Delivery Systems:
Chromatographic separations with single eluent i.e., all the constituents of
mobile phase is mixed and pumped as single eluent is called Isocratic Elution and is
always preferable. However Gradient Elution is a powerful tool in achieving
separation between closely eluting compounds having different polarities. The
importance of Gradient Elution is that the polarity and Ionic strength of the mobile
phase can be changed during the run. Gradient elution is of two types
1. Low pressure Gradient and
2. High pressure Gradient Elution
Low pressure Gradient is one in which mobile phases are mixed at pre
determined ratios and in High pressure Gradient mobile phase are pumped at different
flow rates to achieve the required composition and mixed in mixing chamber and then
introduced to the column. Low pressure Gradient is opted when NMT 80% of organic
organic phase has to be pumped. While optimizing the gradient elution it is important
to monitor the following-
¾ The graph is to be monitored so as to ensure that the overall system pressure will
not cross 300 bars at any point during the run.
¾ Flow rate is to be physically cross checked by collecting the output from the
detector during the run at different time intervals. This avoids pumping problems
which may arise due to higher organic phase compositions.
Selection of Flow Rate:
Flow rate is selected based on the following factors
¾ Retention time
¾ Column composition
¾ Separation impurities
¾ Peak symmetry
Preferably flow rate shall not be more than 2.5 mL/Min. A flow rate that gives
least retention times, good peak symmetries, least back pressure and better separation
of impurities from API peak shall be selected.
Selection of Column Temperature:
Ambient temperature is always preferred as column temperature. However if
the peak symmetry could not be achieved then the column temperature can be varied
between 30° to 80°C. If a column temperature above 80°C is found necessary,
packing material which can withstand to that temperature shall be chosen. The
increase in column temperature generally will result in reduction in peak asymmetry
and peak retentions.
For developing a method, the type of column being used and functionality, structure,
mobile phase compositions to achieve best separation. Usually the silica column
temperatures stable up to 60°C, optimized flow rate achieve the shortest analysis and
adequate resolution and efficiency. In Isocratic method performs the analysis at 50°c.
Reduce the amount of organic modifier in the mobile phase is necessary to produce
the good separation. Some column pre heaters are used to preheat the mobile phase
to avoid broad broadening. Also use peltier chip for precise temperature and controls
the column effluent. Silica based stationary phases stable at up to 60°c some instances
up to 90°c.the higher temperature will leads the shorter column life time. At elevated
temperature the solute transfer from mobile phase to the stationary phase is more
efficient.
Selection of Diluent and Extraction Procedure:
Diluent for test preparation is selected initially based on solubility of the drug
substance. It is selected in such a way that the drug substance is soluble in which the
extraction is complete, due to which there won’t be any interference and in which
peak symmetry and resolution between impurities and API Peak is found satisfactory.
General methods followed for extraction are Sonication, Rotatary shaking or both. In
some cases where API is not extracted by above methods then heating is adopted if
substance is stable and it should not precipitate upon cooling to room temperature.
Experiments are conducted to optimize the extraction of API in the presence
of excipients at different test concentrations using the diluents chosen based on
solubility at different time intervals of sonication time or rotary shaking or both and
select the test concentrations at which the extraction is most efficient.
The solubility of Codeine phosphate, Chlorpheniramine maleate and Sodium
benzoate was determined in a variety of solvents. As per Indian Pharmacopoeial
solvents. From the solubility studies water was chosen as solvent for the present
drugs.
Selection of test concentration and injection volume:
The test concentration is generally chosen based upon the response of API
peak at the selected detector wavelength. However test concentration is finalized after
it is proved that API is completely extractable at the selected test concentration.
Generally an injection volume of 10 to 20µL is recommended for estimation of API.
However if the extractions are found to be difficult then the test concentration can be
kept low and the injection volume can be increased up to 50µL. But it is to be ensured
that at the selected volume the column is not overloaded.
Establishment of Stability of the Solutions:
The assessment of stability of the solution is carried out by keeping the test
solution at Room Temperature and at 2o to 8oC and this test solution is injected along
with the freshly prepared standard and %RSD of the standard solution and test
solution is calculated. An acceptance criterion here is that the %RSD should not be
NMT 2%.
Establishment of System Suitability:
System suitability parameter has to be selected based on the Tailing factor,
Plate count, Resolution, and RSD. In general resolution factor for the closely eluting
compounds is selected as a system suitability requirement. If the separation of
impurities from each other and from API peak is found to be satisfactory, there is no
need to keep a resolution factor as system suitability parameter. In such cases only
standard reproducibility and symmetry of standard peak can be adopted as a system
1.5 METHOD VALIDATION
15:
Validation by definition is an act of proving that any procedures, process,
equipment, materials, activity or system performs as expected under a given set of
conditions. Basically validation is proving that the performance is as intended when
extended to an analytical procedure, depending upon the application, it means that a
method works reproducibly, when carried out by some different persons, in same or
different laboratories using different reagents, different equipments etc.
According to U. S. FDA defines the term “Validation is a process of
establishing documented evidence which provides a high degree of assurance that a
specific process will consistently produce meeting, its predetermined specifications
and quality attributes”.
According to USP, “Validation of an analytical method is the process by
which it is established by laboratory studies that the performance characteristic of the
method meets the requirements for the intended in analytical applications”.
Purpose of Validation:
1. Enable the scientists to communicate scientifically and effectively on
technical matter.
2. Setting the standards of evaluation procedures for checking compliance and
taking remedial action.
3. Economic: Reduction in cost associated with process sampling and testing.
4. As quality of the product cannot always be assured by routine quality control
because of testing of statistically insignificant number of samples.
Types of Analytical Procedures to be validated:
The discussion of the validation of analytical procedures is directed to the four
• Identification tests;
• Quantitative tests for impurities' content;
• Limit tests for the control of impurities;
• Quantitative tests of the active moiety in samples of drug substance or
drug product or other selected component(s) in the drug product.
Although there are many other analytical procedures, such as dissolution testing for
drug products or particle size determination for drug substance, these have not been
addressed in the initial text on validation of analytical procedures. Validation of these
additional analytical procedures are equally important to those listed herein and may
be addressed in subsequent documents.
A brief description of the types of tests considered in this document is
provided below.
1. Identification tests are intended to ensure the identity of an analyte in a
sample. This is normally achieved by comparison of a property of the sample
(e.g., spectrum, chromatographic behavior, chemical reactivity, etc) to that of
a reference standard.
2. Assay procedures are intended to measure the analyte present in a given
sample. In the context of this document, the assay represents a quantitative
measurement of the major component(s) in the drug substance. For the drug
product, similar validation characteristics also apply when assaying for the
active or other selected component(s). The same validation characteristics may
also apply to assays associated with other analytical procedures (e.g.,
Typical validation characteristics which should be considered are listed below:
o Accuracy
o Precision
o Repeatability
o Intermediate Precision
o Specificity
o Detection Limit
o Quantitation Limit
o Linearity
o Range
Furthermore revalidation may be necessary in the following circumstances:
• Changes in the synthesis of the drug substance
• Changes in the composition of the finished product
• Changes in the analytical procedure
The degree of revalidation required depends on the nature of the changes. Certain
other changes may require validation as well.
ACCURACY:
Itis the closeness of agreement between the actual value of the drug and
the measured value. Spike and recovery Studies are performed to measure accuracy, a
known sample is added to the excipients and the actual drug value is compared to the
value found by the assay. Accuracy is expressed as the bias or the % error between
the observed value and the true value (assay value/actual value x 100%).
PRECISION:
The precision of an analytical procedure expresses the closeness of agreement
(degree of scatter) between a series of measurements obtained from multiple sampling
of the same homogeneous sample under the prescribed conditions. Precision may be
considered at three levels: repeatability, intermediate precision and reproducibility.
Precision should be investigated using homogeneous, authentic samples. However, if
it is not possible to obtain a homogeneous sample it may be investigated using
artificially prepared samples or a sample solution.
The precision of an analytical procedure is usually expressed as the variance, standard
deviation or coefficient of variation of a series of measurements.
REPEATABILITY:
Repeatability expresses the precision under the same operating conditions over a short
interval of time. Repeatability is also termed intra-assay precision.
INTERMEDIATE PRECISION:
Intermediate precision expresses within-laboratories variations; different days,
different analysts, different equipment, etc.
REPRODUCIBILITY:
Reproducibility expresses the precision between laboratories (collaborative studies,
It is expressed as the coefficient of variation (% CV). CV is the standard deviation of
the assay values divided by the concentration of the analyte. Several types of
precision can be measured: intra-assay precision (repeatability) is the % CV of
multiple determinations of a single sample in a single test run; inter-assay precision
(also called intermediate precision) measures the % CV for multiple determinations of
a single sample, controls and reagents analyzed in several assay runs in the same
laboratory.
LINEARITY:
A linearity study verifies that the sample solutions are in concentrations range
where analyte response is generally performed by preparing standard solutions at five
concentration levels from 50 to 150% of the target analyte concentrations five levels
are required to allow detection of curvature in the plotted data.
Validation over a wide range provides confidence that the routine range
provides confidence that the routine standard levels are well removed from non linear
response concentrations that the method covers a wide enough range to incorporate
the limits of content uniformity testing.
Acceptance of linear data is often judged by examining the correlation
coefficient >0.999 is generally considered as evidence of acceptable fit of the data.
For the evaluation of linearity five different concentrations of standard solutions
were prepared. The concentration ranges that prepared were between 25 to 125 μg/ml
for. A graph is plotted to “area” versus amount found”. The co-relation coefficient
was found to be 0.999. It is the ability of an assay to obtain test results, which are
directly proportional to the concentration of an analyte in the sample. The
be measured as slope of the regression line and its variance or as the coefficient of
determination and correlation coefficient (R).
RANGE:
The range of an analytical method is the interval between the upper and lower
levels (including these levels) that have been demonstrated to be determined with
precision, accuracy and linearity using the method as written. The range is normally
expressed in the same units as the test results (e.g., percentage, parts per million)
obtained by the analytical method.
SPECIFICITY:
Specificity is the ability to assess unequivocally the analyte in the presence of
components which may be expected to be present. Typically these might include
impurities, degradants, matrix, etc. Lack of specificity of an individual analytical
procedure may be compensated by other supporti