International Journal of Innovative Technology and Exploring Engineering (IJITEE) ISSN: 2278-3075, Volume-8 Issue-12, October 2019
Abstract: The subjective quality test of the enhanced speech from different enhancement algorithms for listeners with normal hearing (NH) capability as well as listeners with hearing impairment (HI) is reported. The subjective quality evaluation of speech enhancement methods in the literature survey is mostly done targeting NH listeners and fewer attempts are observed to subjectively evaluate for HI listeners. The algorithms evaluated are from four different classes: spectral subtraction class(SS), statistical model based class (minimum mean square error), subspace class(PKLT) and auditory class (ideal binary mask using STFT, ideal binary mask using gammatone filterbank and ideal binary mask using gammachirp filterbank). The algorithms are evaluated using four types of real world noises recorded in Indian scenarios namely cafeteria, traffic, station and train at -5, 0, 5 and 10 dB SNRs. The evaluation is being done as per ITU-T P.835 standard in terms of three parameters- speech signal alone, background noise and overall quality. The noisy speech database developed in Indian regional language, Marathi, at four SNRs -5, 0, 5 and 10 dB is used for evaluation. Significant improvement is observed in ideal binary mask algorithm in terms of overall quality and signal distortion ratings for NH and HI listeners. The performance of minimum mean square error is also observed comparable with the ideal binary mask algorithm in some cases.
Keywords : hearing impaired, ideal binary mask, mean opinion score, speech enhancement.
I. INTRODUCTION
P
eople with normal hearing (NH) ability are able to perceive one particular sound among several equally loud conversations or loud background music. But hearing impaired (HI) listeners face cocktail party phenomenon [1, 2] more. Even in less noisy situations, HI listeners face speech perception problems [3, 4, 5] and they may stop listening to the conversation. Quality evaluations can be done using subjective listening tests or objective quality measures [6]. Quality and intelligibility are the two main attributes ofRevised Manuscript Received on October 05, 2019.
Hemangi Shinde, Departmrnt of Electronics & Telecommunication Engineering, Research Scholar, College of Engineering Pune, Pune, India, Faculty,AISSMS Institute of Information Technology, Pune, India. Email: hemangi.pune@gmail.com
A.M.Sapkal, Departmrnt of Electronics & Telecommunication Engineering, College of Engineering Pune, Pune, India. Email: ams.extc@coep.ac.in
Aishwarya Phatak, Departmrnt of Electronics & Telecommunication Engineering, AISSMS Institute of Information Technology, Pune, India. Email:
aishwarya.phatak@aissmsioit.org
speech signal. Though the enhanced outputs of two different algorithms may have equal intelligibility scores, but the listeners may perceive the enhanced speech of one of the algorithms more natural. It is observed in the literature survey
that the speech enhancement algorithms for noisy and reverberant methods have been evaluated objectively using signal processing distortion methods. But they are evaluated subjectively mostly for normal listeners. A subjective quality evaluation of thirteen speech enhancement algorithms was done for NH listeners [6]. Heleen Luts et. al. [7] have evaluated five speech enhancement algorithms subjectively for both NH and HI listeners. The motivation behind quality evaluation experimentation is to check the performance of the algorithms from each class for HI listeners. The algorithms chosen for evaluations are spectral subtraction algorithm (SS), minimum mean square error (MMSE), perceptually motivated subspace algorithm (PKLT), ideal binary mask using short-time Fourier transform (IBM_STFT), ideal binary mask using gammatone filterbank (IBM_GT) and ideal binary mask using gammachirp filterbank (IBM_GC). This paper is divided into following sections: section II is concerned with speech enhancement algorithms; section III explains the database and experiments. Section IV discusses the results of the experiments.Finally the paper is concluded in section V.
II. SPEECHENHANCEMENTALGORITHMS
The most standard method in speech enhancement is spectral subtraction. In spectral subtraction, the noise which is additive to the clean speech is considered. The modeling of this noise from the noisy speech signal is done for suppressing it to recover the enhanced speech signal [6]. But these spectral subtraction methods overestimate the noise spectrum which gives rise to distortions in the enhanced speech. These distortions result in musical noise in the output. A number of methods were proposed in the literature to reduce this musical noise [8, 9]. The human auditory perceptual methods which use the masking properties of human auditory system were proposed to improve the spectral subtraction methods [10, 11]. More recent methods are combined temporal and spectral processing [12], ideal binary mask [13] and independent component analysis [14].
Quality Evaluation of Speech Enhancement
Algorithms for Normal and Hearing Loss
Listeners
Binary time-frequency masks perfectly separate the speech signals from mixture if the time-frequency representations of the speech sources do not overlap [15]. However, the quality of the enhanced speech is highly dependent on the type of noise, SNR and time-frequency resolution. It is observed in the literature survey that the researchers have used different methods to generate binary mask. Different transforms were used to apply binary masks to the mixture of sounds [16, 17, 18] while gammatone filterbank is used along with binary mask [13]. In this paper the speech enhancement algorithms from different classes are selected for subjective quality evaluations namely- spectral subtraction (spectral subtractive class), MMSE (statistical model based class), PKLT
(subspace), IBM_STFT, IBM_GT and IBM_GC
(Auditory).The three algorithms from auditory class are chosen to study the effect of STFT, gammatone and gammachirp filterbank along with ideal binary mask. The MATLAB implementations given in [6] and in [19] are used for subjective evaluation. Ideal binary mask algorithm is implemented with LC (Local criteria) 0 dB for NH and -6 dB for HI [13].
A. Spectral subtraction algorithm
In spectral subtraction algorithm, [20] the noise spectrum average magnitude is calculated. This average magnitude is subtracted from the magnitude spectrum of the noisy speech signal to evaluate the magnitude spectrum of the enhanced speech. To estimate the noise, it is assumed that the additive noise is stationary during the analysis interval. The enhanced speech spectrum is estimated as
^ ^
1
X k Y k N k
where the noise spectrum average magnitude isN k^
, the magnitude spectrum of noisy speech is Y(k). But in this method, errors occur while calculating the noise spectrum and hence some negative values in the enhanced spectrum are observed. These negative peaks are half wave rectified to get positive magnitude spectrum. These peaks give rise to musical noise when converted to time domain. Berouti et.al.[21] proposed a method in which the noise spectrum is overestimated. This overestimated spectrum of noise is subtracted from the noisy spectrum. Thus the output spectrum is ensured above a preset minimum value. This method reduced musical noise. Thus the enhanced speech spectrum is ^ ^ ^ ^ ^, if -a >b
2 , otherwise
Y k a N k Y k N k N k X k
b N k
where b is spectral floor parameter , a is over subtraction factor and it is a function of signal to noise ratio (SNR) in each frame of noisy speech.[6]
0
3
-5 dB SNR 20dB
20
aa SNR (3)
where a0 is the required value ofa at 0 dB SNR. SNR is a
posterior estimate based on the ratio of power of noisy speech to the power of estimated noise. Each speech analysis frame is of 160 samples with 50% overlap. The speech signal is windowed using Hamming window before DFT analysis.
The enhanced signal in each frame is synthesized using overlap add method.
B. Minimum mean square error (MMSE) algorithm
This method [22] enhances the speech by minimizing the mean square error between the short time magnitude spectrum of the clean and the enhanced speech signal. MMSE estimator is expressed as
0 1
ˆ exp 1 (4)
2 2 2 2
k k k k
k k k k
k
S I I Y
where I0(.) and I1(.) are the modified Bessel functions of zero
and first order respectively. In equation 4, υk is defined as
2 2 2 2 1 where k k k k k k k k k k E X E N E Y E N C. Perceptually motivated subspace algorithm
Signal and noise subspace form each vector of degraded speech signal. Singular value decomposition (SVD) and Karhunen-Loeve Transform (KLT) methods are used to break down the degraded speech signal into speech signal and noise subspace. The noisy speech signal covariance matrix Ry is computed using a relatively large frame length
K(256, 32 msec), which is divided into smaller P-dimensional frames (32, 4 msec) with 50% overlap. The samples in K dimensional frame are used to construct P x P Toeplitz covariance matrix. The eigenvector matrix is derived from Toeplitz covariance matrix Ry [23]
Ry=UɅyUT where Ʌy is the diagonal matrix containing
eigen values. The signal subspace M is estimated. The noisy signal in each P sub frame is enhanced using eigenvector matrix Ʌy and the estimation matrix M. The output vectors
are windowed using Hamming window and synthesized using overlap add method.
D. Ideal binary mask algorithm
The three algorithms from auditory class are chosen to study the effect of STFT, gammatone and gammachirp filterbank along with ideal binary mask. Spectral resolution is the main difference between the gammatone filterbank and STFT. Gammatone filterbank featuresthe processing in the human auditory system. Hence it is frequently used for speech processing. STFT requires more frequency channels to obtain the same spectral resolution at low frequencies than the gammatone filter bank [13]. The binary mask is generated using the equation
,
1 if s
,
,
0 otherwise
t f n t f
IBM t f
(5)
International Journal of Innovative Technology and Exploring Engineering (IJITEE) ISSN: 2278-3075, Volume-8 Issue-12, October 2019
III. DATABASEANDEXPERIMENTS
Subjective evaluation of speech enhancement algorithms consists of quality and intelligibility judgments of the listeners. The judgments of the listeners will be more accurate if the listening test is conducted using vernacular language. Hence developing Marathi language database at different SNR levels has been elusive due to lack of databases recorded at different SNR levels.
Hundred phonetically rich sentences in Marathi language with less word text repetition were recorded in a recording room. Two male and two female speakers spoke the sentences. The sentences were selected to include almost all phonemes in spoken Marathi language. The sentences were sampled at 8 kHz, 16-bit PCM, mono format. The database was degraded by four different real-world noises at different SNRs. The noise includes cafeteria, traffic, train, station which is recorded in Indian scenarios (Pune city). The speech and noise signals were calibrated to 65dB as per ITU-T standard.
Equipments used for calibration were Brüel and Kjaer, Denmark make sound Pressure Level Meter Type 2250, Sound Level Calibrator Type 4231, Professional Microphone Type 4144 and Artificial Ear Type 4152. Calibrated noise signal of the same length as the speech signal was cut randomly from the noise recording, scaled appropriately as per the required SNR level and added to the calibrated speech signal using method B of ITU-T P.56. The noise signals were added to speech signals at -5dB, 0dB, 5dB, 10dB SNRs. All the noisy speech signals were saved in Windows wav format. Adobe Audition software was used for editing speech and noise files.
A. Experiments
The subjective evaluation is carried using three parameters: the speech signal alone (SIG), the background noise alone (BAK) and the overall quality (OVL) of the enhanced speech signal. The noisy speech files at four different SNRs 10 dB, 5 dB, 0 dB and -5 dB in four different noise environments- cafeteria, traffic, train, station and the enhanced speech files were presented to 13 different subjects in random order similar to [6]. The listeners with peculiar Marathi language accent were chosen which comprise 6 male and 7 female listeners. 7 listeners have normal hearing abilities and 6 are having mild sensorineural hearing loss. The average age group of NH subjects is between 18 to 25 and 2 of them are expert listeners. The age of HI listeners range from 23 to 73 with the average age of 55. For HI listeners, the listening test was performed with hearing aid taken off. Amplification was provided as per the individual HI listener’s audiogram. The amplification level was adjusted once before the beginning of test and was not disturbed throughout the test. The listening test is carried out in a quiet room with ordinary headphones usually used with personal computer.
The subjects were trained by playing a set of speech files so as to get accustomed with the test procedure. Each set includes eight files – six enhanced speech files of different algorithms namely spectral subtraction, MMSE, subspace, ideal binary mask using STFT (IBM_STFT), ideal binary mask using gammatone filterbank (IBM_GT), ideal binary mask using gammachirp filterbank (IBM_GC), clean speech file and
degraded signal file (noisy). Sixteen sets, each consisting of eight files are created and are presented to the listeners in random order. The listeners are given short span to relax after about 20 minutes of uninterrupted listening. The subjects were instructed to rate the enhanced speech signal on each of the parameters [6]:
1.The speech signal alone (SIG) with scale of signal distortion [1-very unnatural, very downgraded, 2- fairly unnatural, fairly downgraded, 3- somewhat natural, somewhat downgraded, 4- fairly natural, little down gradation, 5- very natural, no down gradation]
2.The background noise alone (BAK) with scale of background disturbance[1- very noticeable, very interrupting, 2- fairly noticeable, somewhat interrupting, 3- noticeable but not interrupting, 4- somewhat noticeable, somewhat interrupting, 5- not noticeable]
3.The overall signal in terms of decreased background noise, lesser distortion with scale of Mean opinion score (OVL) [1-bad, 2- poor, 3- fair, 4- good, 5- excellent].
The ITU-T P.835 standard was used to evaluate and compare the performance of speech enhancement algorithms. [24]
IV. DISCUSSION
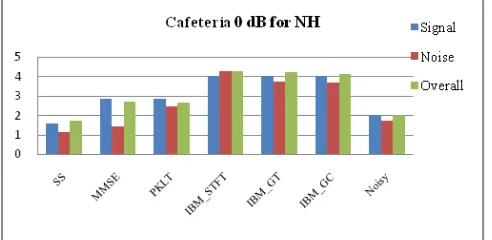
Figure 1 and Figure 2 show sample bar graph plots of subjective evaluation in terms of MOS scores for cafeteria noise at 0 dB SNR for NH and HI subjects respectively using degraded speech and the enhanced speech obtained with different methods. The SIG, BAK and OVL scores of degraded speech is the reference score to evaluate different methods so that which algorithm improved the quality of noisy speech is known. Table I, Table II and Table III show mean opinion scores (MOS) for overall quality (OVL), signal distortion (SIG) and background noise distortion (BAK) ratings obtained from the different algorithms for both NH as well as HI listeners. In the table, abbreviations noisy, SS, MMSE, PKLT, IBM_STFT, IBM_GT and IBM_GC refer to degraded speech, spectral subtraction, MMSE estimator, perceptually motivated subspace, ideal binary mask using STFT, ideal binary mask using gammatone filterbank and ideal binary mask using gammachirp filterbank respectively.
[image:3.595.305.551.551.671.2]Figure 2: The OVL mean scores for cafeteria noise at 0 dB SNR for HI listeners
The asterisks (*) indicate improvement in the ratings, # represents no significant improvement and blank indicates poor performance in the ratings of enhanced speech output. It is observed that HI listeners have also given higher overall quality rating to the enhanced files from all types of ideal binary mask algorithm. The same trend is observed for all four types of noises for NH listeners. The ratings for ideal binary mask algorithms are almost
[image:4.595.48.549.204.794.2]Table-I: Mean opinion scores (MOS) for overall quality rating (OVL)
Table-II: Mean opinion scores (MOS) for signal distortion (SIG) rating
International Journal of Innovative Technology and Exploring Engineering (IJITEE) ISSN: 2278-3075, Volume-8 Issue-12, October 2019
same for OVL, SIG and BAK ratings irrespective of the signal processing technique and these ratings are considered as an
ideal case for comparison. In some conditions the algorithms SS, MMSE and PKLT performed good.
For signal distortion comparison (SIG), the asterisks indicate no notable speech distortion. For background noise distortion (BAK), the algorithms marked with asterisks lowered the noise distortion and with # as well as blank did not lower the noise distortion. MMSE algorithm performed the best among SS, MMSE and PKLT in terms of overall quality (OVL) and no notable speech distortion (SIG) ratings. In terms of background noise distortion (BAK) ratings, it is observed that MMSE and PKLT performed equally. Multiple regression analysis for overall quality, speech and noise distortion ratings was performed. The overall quality score is the dependent variable and the speech and noise distortion scores are independent variables. The relationship among these three ratings for NH listeners is,
0.025 0.706 0.305 (6)
OVL SIG BAK
R R R
and for HI listeners is,
0.029 0.593 0.333 (7)
OVL SIG BAK
R R R
where ROVL is the predicted overall (OVL), RSIG is the SIG
rating and RBAK is the BAK rating. The correlation
coefficient is 0.98 for NH, 0.968 for HI and the standard deviation of the
error is 0.21 for NH, 0.238 for HI listeners. Figure 3 and Figure 4 show the regression plot for NH and HI listeners respectively.
[image:5.595.44.284.427.735.2]Figure 3: Regression plot for NH listeners
Figure 4: Regression plot for HI listeners
In some cases at 5 and 10 dB , no significant improvement is observed as the noisy signal rating is increased. The spectral
subtraction (SS) algorithm performed poorly for almost all conditions for NH and HI listeners.
V.CONCLUSION
In this paper, the subjective evaluation of six speech enhancement algorithms namely- spectral subtraction (SS), minimum mean square error (MMSE), perceptually motivated subspace (PKLT), ideal binary mask using STFT (IBM_STFT), ideal binary mask using gammatone filter (IBM_GT),ideal binary mask using gammachirp filter (IBM_GC) is done. In terms of overall quality, significant improvement is observed in ideal binary mask algorithm for both NH and for HI listeners. The spectral subtraction (SS) algorithm performed poorly for almost all conditions for NH and HI listeners. It is observed that the algorithms giving significant improvement in overall quality also showed the lowest speech distortion. Ideal binary mask algorithm showed good performance in almost all conditions and is used as ideal case for comparison. MMSE performed better among SS, MMSE and PKLT algorithms. The ratings given by HI listeners follow the same trend as the ratings given by NH listeners.It is also verified from the results of regression analysis that the listeners have given emphasis on signal distortion (SIG) than the background noise distortion (BAK) while giving MOS ratings.
ACKNOWLEDGMENT
The present work was supported by grant from Board of College and University Development (BCUD), Savitribai Phule Pune University, Pune, India.
REFERENCES
1. A. W. Bronkhorst, “The cocktail party phenomenon: A review of research on speech intelligibility in multiple-talker conditions,” Acta Acustica united with Acustica, vol. 86, no. 1, pp. 117–128, 2000.
2. S. Haykin and Z. Chen, “The cocktail party problem,” Neural Computation, vol. 17, pp. 1875–1902, 2005.
3. J. M. Festen and R. Plomp, “Effects of fluctuating noise and interfering speech on the speech-reception threshold for impaired and normal hearing,” Journal of the Acoustical Society of America, vol. 88, no. 4, pp. 1725–1736, 1990.
4. R. W. Peters, B. C. J. Moore, and T. Baer, “Speech reception thresholds in noise with and without spectral and temporal dips for hearing-impaired and normally hearing people,” Journal of the Acoustical Society of America, vol. 103, no. 1, pp. 577–587, January 1998.
5. J. G. W. Bernstein and K. W. Grant, “Auditory and auditory-visual intelligibility of speech in fluctuating maskers for normal-hearing and hearing-impaired listeners,” Journal of the Acoustical Society of America, vol. 125, no. 5, pp. 3358–3372, 2009.
6. P. C. Loizou, Speech enhancement: theory and practice, 1st ed. CRC Press, 2007.
7. Heleen Luts, Eneman K. et. al., “ Multicenter evaluation of signal enhancement algorithms for hearing aids”, Journal of the Acoustical Society of America, vol. 127, no. 3, pp. 1491–1505, March 2010. 8. R.Martin, “Noise power spectral density estimation based on optimal
smoothing and minimum statistics,” IEEE Transaction Speech Audio Processing,vol.9,no.5,pp.504-512,July 2001
9. T.Gerkmann, R.C.Hendriks, “Unbiased mmse-based noise power estimation with low complexity and low tracking delay ,” IEEE Transaction Audio ,Speech , Language Processing,vol.20, no.4, pp.1383-1393, May 2011
11. Y.Hu, P.C.Loizou,” Aperceptually motivated approach for speech enhancement,” IEEE Transaction on Speech, Audio Processing,vol.11, no.5,pp.457-465, September 2003
12. P.Krishnamoorthy, S.R.M.Prasanna,“ Enhancement of noisy speech by temporal and spectral processing ,” Speech Communication , vol.53, pp. 154– 174,Feb2011.
13. D.Wang, Ulrik Kjems, S.Pedersen,J.Boldt, “Speech intelligibility in background noise with ideal time-frequency masking” , Journal of the Acoustical Society of America,vol.125,no.4,pp2336-2347, 2009 14. A. Hyvärinen, J. Karhunen, and E. Oja, Independent component
analysis. Wiley,2001.
15. O. Yilmaz and S. Rickard, “Blind separation of speech mixtures via time-frequency masking,” IEEE Transactions on Signal Processing, vol. 52, no. 7, pp. 1830–1847, 2004.
16. Q. Li, “An auditory-based transform for audio signal processing,” in
Proceedings of IEEE Workshop on Applications of Signal Processing to Audio and Acoustics, 2009.
17. M. K. I. Molla, K. Hirose, and N. Minematsu, “Separation of mixed audio signals by source localization and binary masking with hilbert spectrum,” in Independent Component Analysis and Blind Signal Separation,
Springer, 2006, vol. 3889, pp. 641–648.
18. S.Araki,H.Sawada, R.Mukai, S. Makino., “Underdetermined blind sparse source separation for arbitrarily arranged multiple sensors,” Signal Processing,vol.87,no.8,pp1833–1847,2007.
19.D.Wang, “MATLAB toolbox for cochleagram analysis and synthesis,” [Online]. Available: web.cse.ohio-state.edu/pn1/shareware/cochleagram /README.txt.
20. S.Boll, “Suppression of acoustic noise in speech using spectral subtraction ,” IEEE Transaction of Acoustics, Speech Signal Processing,
Vol.ASSP-27no.2,pp.113-120,April 1979
21. M.Beruti, R.Schwartz, J.Makhoul, “Enhancement of speech corrupted by acoustic noise”,Proceeding IEEE International conference Acoustics, Speech ,Signal Processing, April 1979, pp 208-211
22. Y.Ephraim,D.Malah, “Speech Enhancement using a minimum-mean square error short-time spectral amplitude estimation,” IEEE Transaction of Acoustics, Speech Signal Processing,vol.ASSP-32,no.6,pp.1109-1121, Dec.1984.
23. Y.Hu, P.C.Loizou, “A perceptually motivated approach for speech enhancement,” IEEE Transaction on Speech, Audio Processing,vol.11, no.5,pp.457-465, September 2003
24. ITU-T, “Subjective test methodology for evaluating speech communication systems that include noise suppression algorithm”, ITU-T Recommendation P.835,2003
AUTHORSPROFILE
Hemangi Shinde obtained her Bachelors and Masters Degree in Electronics & Telecommunication Engineering from Pune University in 1987 and 2003 respectively. She is PhD research Scholar at Department of Electronics & Telecommunication Engineering at College of Engineering, Pune, India and Assistant Professor at AISSMS Institute of Information Technology, Pune, India.
Prof. Dr. Ashok M.Sapkal obtainedhis Bachelors and Masters Degree in Electronics & Telecommunication Engineering from College of Engineering Pune, Pune University, India in 1987 and 1993 respectively. He received his Ph.D degree from College of Engineering Pune, Pune University, India in 2008. He has published more than 22 Journals and 45 papers in both national and international conferences. His research areas include image processing, signal processing, communication electronics.