Big Data Based Diabetes and Heart Disease
Prediction System by Employing Supervised
Learning Algorithm
J. Agnes Beula Christy, S. Appavu alias Balamurugan
Abstract: Healthcare systems generate bytes and bytes of data and the data growth is exponential. The voluminous data can be analysed effectively, only when the data organization is efficient. Additionally, data retrieval must also be made simpler, such that the healthcare professional can compare and contrast the test sample with the database of health records. This makes it possible to achieve better disease prediction and this work presents a big data based disease prediction system with the help of supervised learning. The proposed approach clusters the related health records, based on every medical attribute followed by which the disease is predicted by SVM classifier. The performance of the proposed disease prediction system is observed to be satisfactory in terms of accuracy, precision, recall, F-measure, while consuming reasonable period of time.
Keywords: Big data, disease prediction, supervised learning, database server.
I. INTRODUCTION
Cancer Data is an inevitable source of any action and today’s commercial world completely relies on data. Data being collected from the customers or end-clients are treasured, in order to maintain good rapport and to promote business. As time progresses, the growth of data is escalating indefinitely and this makes the process of data management crucial. When the collected data are properly saved, then it is easy to analyse and retrieve the data whenever needed. Realizing the benefits of data storage, most of the domains tend to digitize the data for database storage right from healthcare, finance, retail, marketing, education and so on.Healthcare domain is the most sensitive among the rest of the domains, as it deals with the medical data of the patient. The medical information of the patient is considered as private and confidential. Hence, the medical database must be maintained with better security policy. The authorized healthcare professionals must be able to manipulate the medical data, which can be extraction, analysis, comparison, matching and so on. The healthcare professional can easily access the medical history of the patient and can compare the data with the other. This kind of analysis is beneficial for diagnosis, while ensuring time conservation.When the operation of data analysis or
Revised Manuscript Received on December 05, 2019.
J. Agnes Beula Christy, 1Research Scholar, Sathyabama Institute of Science and Technology, Chennai, Tamilnadu
S. Appavu alias Balamurugan, 2Professor, Department of Computer Science and Engineering, E.G.S. Pillay Engineering College,
Nagapattinam, Tamilnadu
comparison is needed to be done manually, it is difficult to locate the record and hence, extracting the desired record is time consuming and requires more human effort. On the other hand, the desired digital medical record can be extracted within a matter of seconds from the database and record can easily be analysed. The centralized database is maintained, such that the medical record of the patient can be accessed from anywhere. As the volume of data is ever-increasing, the concept of ‘Big Data’ comes into picture. The big data is based on five important V’s, which are volume, velocity, veracity, variety and value [1]. The volume of data increases with respect to time and velocity deals with the flow of data. Veracity is based on the trustworthiness of the data, variety stands for multiple formats or representations of data. Value focuses on the interrelationship with the data. As far as big data is considered in healthcare domain, the data growth is uncontrollable and the format of medical data is different. Irrespective of the volume of data, the healthcare professional must be able to retrieve and analyse the medical records without any hassle.Understanding the volume and varied formats of medical records, this article intends to present an automated big data based healthcare analytical system for predicting diabetes and heart related ailments based on machine learning algorithm. The goal of this work is achieved by segregating the work into four phases and they are data collection, pre-processing, medical data clustering and disease prediction. As this work deals with healthcare, medical data is acquired in different forms and formats from different sources. Hence, the data must be standardized for the upcoming processes and is performed by data pre-processing. Medical data clustering groups the related records under a single class, such that it is easy to handle voluminous data. Finally, the disease prediction phase attempts to predict the likeliness of the disease to occur. The contributions of this work are as follows.
This work predicts the heart related ailments and diabetes with better sensitivity and specificity rates. The incorporation of medical data clustering results in time conservation and thereby improves the overall performance.
II. REVIEW OF LITERATURE
This section reviews the related review of literature by considering the role of big data in healthcare domain.
In [2], a big data analytical scheme for cloud computing model is presented on the basis of fuzzy rules for providing healthcare-as-a-service. This work involves three important phases such as cluster formation, data retrieval and big data processing. A fuzzy rule based classifier is then applied over the data and the performance of the work is tested.
A healthcare cyber-physical system assisted by cloud and big data in presented in [3]. This work is based on three important layers such as data collection, data management and data-oriented service layers. The performance of this work is then analysed and the results are discussed. An emotion aware connected healthcare big data towards 5G is presented in [4]. The image and speech signals of the patients are captured from the Internet of Things (IoT) and are passed as input to the emotion detection module. Both the speech and image signals are processed independently and the final results are fused together to make decision.
In [5], big data visualization in cardiology domain is reviewed and the future research directions are discussed. A security model to preserve the medical big data privacy in healthcare cloud is presented on the basis of pairing based cryptography is presented in [6]. The bilinear pairing cryptography is utilized to present a tri-party one-round authenticated key agreement protocol. The private healthcare data are stored and accessed with the help of decoy technique.
A big medical data integration solution is surveyed in [7], which studies different data integration technologies, tools and applications with respect to healthcare domain. Future research ideas with respect to big healthcare data are also presented. In [8], a big data analytical scheme for healthcare industry that focuses on impact, applications and tools, is presented. The conceptual architecture of big data analytics for healthcare data is presented, which considers the genome database, Electronic Health Records (EHR) and so on.
A big data governance framework for Regional Health Information Networks (RHIN) is presented with a case study for china in [9]. The medical big data under hierarchical medical system and patients’ medical treatment decisions is discussed in [10]. This work is based on information asymmetry theory and the game model. The initial model is meant for predicting three conditions such as disguising cost, diagnosis and treatment. The second model builds a hierarchical model for allotting the available medical resources.
A survey with respect to big data healthcare is reviewed in [11]. This work focuses on the effect of big data over medical stakeholders, patients, healthcare professionals, insurers and so on. In [12], mobile cloud based big healthcare data processing in smart cities is presented. This work utilizes ant colony optimization algorithm for Virtual Machine (VM) migration model to support smart healthcare system. This work considers both the movement pattern of the users and provisioned VM resources.
In [13], a health big data analytics technology is surveyed with respect to challenges, data sources, tools and technologies. A context aware monitoring framework is
presented in [14] for big data framework. This work is based on knowledge discovery, which mines the health data of every single patient and the pattern is formed. The attained knowledge is then applied for making decisions about the patient.
A big data visualization scheme meant for telemedicine is presented in [15]. This work presents a graphical tool for visualizing the health data of patients and the health status can be monitored by the physicians effortlessly. Different coloured circles are employed for easy discrimination and is adopted by the geoJSON standard. In [16], a big health application system based on the Health Internet of Things (HIoT) and big data is presented. This work is based on perception, transport and cloud service layers. The big health cloud layer is again divided into two sub-layers, which are cloud service support and cloud service application layers.
In [17], a disease prediction scheme for big data is presented on the basis of machine learning algorithm. This work formulates a Convolutional Neural Network (CNN) based disease prediction algorithm and the missing data is handled by the latent factor model. A patient centric cellular networks optimization scheme based on big data analytics is presented in [18]. This work collects the out patients’ health records in addition to the live health readings collected by medical IoT sensors for predicting the health status of the patient. In case of any abnormality, the health data is forwarded to the healthcare provider with the help of optimized cellular network.
An incomplete data detection scheme for big data is presented on the basis of mapreduce framework in [19]. This work presents an algorithm namely Mapreduce Enhanced Bitmap Index Guided Algorithm (MRBIG), which applies top k queries on the big incomplete datasets. In [20], a personalized ubiquitous cloud and edge enabled networked healthcare system is presented, which works on the basis of deep learning, cloud computing, big data, Internet of Things (IoT) and so on. This work is based on three components and four layers.
In [21], a semantic inference scheme is presented for clinical documents by combining machine learning algorithms to achieve better diagnosis and treatment. This work follows a standard clinical terminology and document syntax for all clinical data. The proposed model dynamically gains knowledge from the system. In [22], a system to present smart home based on big data care application is presented. This work considers the activity patterns of humans and employs frequent pattern mining, clustering and decision making.
Motivated by the existing big data based healthcare systems, this article intends to present disease prediction system that can predict heart related diseases and diabetes by utilizing simple attributes. The proposed work is elaborated in the following section.
III.PROPOSED BIG DATA BASED DISEASE PREDICTION SYSTEM BY EMPLOYING SUPERVISED LEARNING APPROACH
This section describes the complete working principle of the proposed work along with the overview of the work.
3.1 Outline of the Proposed Model
The growth of healthcare data is inevitable and hence, a proper data management is
for better data analysis that leads to better decision making. Healthcare data involves different formats of data such as image, text and numerals.
The data processing algorithm must be able to handle and the system must be scalable to support growing data.
Recognizing the current requirements, the proposed work presents a disease prediction system based on supervised learning approach. The overall flow of the proposed work is depicted in figure 1.
Fig.1. Overall flow of the proposed disease prediction system
The supervised learning approach relies on two different phases, which are train and test. The train phase provides knowledge to the classifier, such that it becomes suitable for data sample classification under different classes. The knowledge is given to the classifier by passing different data samples along with their respective classes. On the other hand, the test phase predicts the disease with the help of the so acquired knowledge. This work focuses on the healthcare data, as big data based solutions are quite limited for the healthcare domain.
The medical data being collected from the patients are stored in a centralized database server and the data replica is stored in two more servers available in different locations. This idea is to avoid the issue of single-point-of-failure. Besides, the centralized database server is private and the possibility of security issues is minimal, yet it is not the scope of this work. The healthcare professionals under a specific healthcare community can access the healthcare data from anywhere and at anytime.
The proposed work is based on four significant phases such as medical data collection, pre-processing, medical data clustering and disease prediction. Initially, this work collects the medical data from medical laboratories, hospitals and standard datasets to form a bulky dataset. As the data is collected from multiple sources, the data organization is different and all the collected data are standardized in the data pre-processing phase. Besides this, the pre-processing phase eliminates the duplicate records and the missing attributes are filled up. The pre-processed dataset is suitable for processing and the performance of classifier can further be enhanced, when the dataset is refined.
The process of medical data clustering attempts to group the related medical records together. In this case, the clusters are formed by considering several attributes individually. For instance, cluster A represents the age, cluster B indicates Haemoglobin level, cluster C represents blood pressure and so on. The main advantage of this approach is that the healthcare professional can easily analyse the data with respect to the medical attributes, as the records are grouped with respect to individual attributes.
This way of clustering helps in easy data retrieval also. For instance, the patients within the age group of 10 to 14 with symptoms cough, head ache, platelet count can be extracted and analysed further, in order to predict Dengue fever. Similarly, several similar combinations of symptoms can be framed for predicting a specific disease. Finally, the Support Vector Machine (SVM) classifier is employed to make final decision with respect to disease prediction. All the involved phases are explained in the following sub-sections.
3.2 Medical Data Collection
The medical data is collected from different medical laboratories, hospitals and standard datasets located in Tamilnadu. The medical data are collected on weekly basis for the past six months and the dataset is formed. This work processes about 10,000 medical records being stored in the database server and the replica is maintained in two other servers, in order to deal with unexpected server failure. The
following section discusses about the medical data pre-processing.
3.3 Medical Data Pre-processing
The medical data pre-processing is the most important phase, which prepares the data to
suit the upcoming data
processing activities. The pre-Medical
Lab
Hospital
Standard Database
Health Records Pre-processing
Health Record Clustering by
FCM+LO
Train SVM
Test Health Record Health Record Pre-processing
Apply SVM for disease prediction
Normal
Heart Disease
Diabetes Training
Testing Medical Records
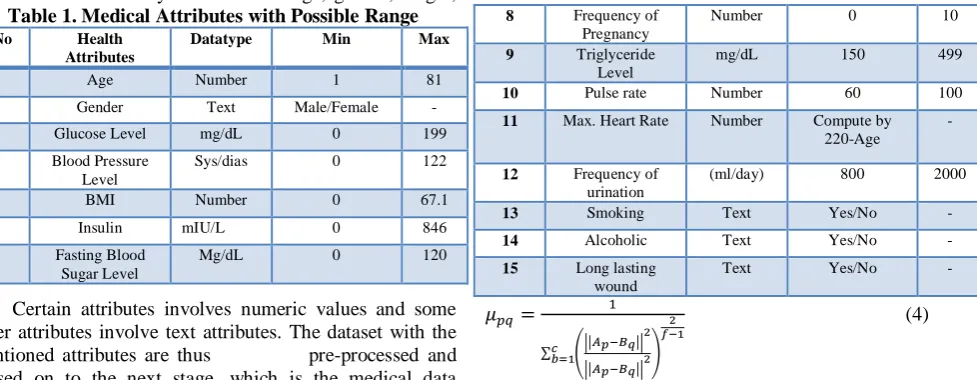
processing phase removes the duplicate records. In some cases, certain attributes are returned as null and the system may not be able to handle the situation. Hence, the attribute is filled with the value 0, as and when required. The medical attributes considered by this work are age, gender, height,
[image:4.595.62.551.106.296.2] [image:4.595.299.553.511.836.2]weight, pulse rate, ECG, Blood Pressure (BP), blood sugar, cholesterol, maximum heart rate, urea, smoke, alcoholic, pregnancy count, insulin level, Body Mass Index (BMI), which are tabulated in the following Table 1.
Table 1. Medical Attributes with Possible Range
Sl.No Health
Attributes
Datatype Min Max
1 Age Number 1 81
2 Gender Text Male/Female -
3 Glucose Level mg/dL 0 199
4 Blood Pressure Level
Sys/dias 0 122
5 BMI Number 0 67.1
6 Insulin mIU/L 0 846
7 Fasting Blood Sugar Level
Mg/dL 0 120
8 Frequency of Pregnancy
Number 0 10
9 Triglyceride Level
mg/dL 150 499
10 Pulse rate Number 60 100
11 Max. Heart Rate Number Compute by 220-Age
-
12 Frequency of urination
(ml/day) 800 2000
13 Smoking Text Yes/No -
14 Alcoholic Text Yes/No -
15 Long lasting wound
Text Yes/No -
Certain attributes involves numeric values and some other attributes involve text attributes. The dataset with the mentioned attributes are thus pre-processed and passed on to the next stage, which is the medical data clustering, as presented below.
3.4 Medical Data Clustering
The medical data clustering intends to group related entities together, with respect to the attribute. The clusters are formed for every single attribute, such that data retrieval is made easier with retrieval constraints. For example, when the healthcare professional intends to extract the records with patients of a specific age group being suffered from specific symptoms, then it can be processed easier with the help of clustering.
This work clusters the data with the help of standard Fuzzy C Means (FCM) clustering and the Lion Optimization (LO) algorithm. The reason for the choice of FCM algorithm is that the values of the attributes are straight-forward and simple clustering algorithm can perform better. FCM is one of the most popular clustering algorithms, which allows the data entity to be present in more than a single cluster. The relationship between the data samples is computed by a membership function. However, the FCM finds it difficult to choose the initial centre point for a cluster and this issue is solved by LO algorithm. The objective function of the FCM algorithm is presented as follows.
𝑂𝐵𝐹 = ∑ ∑ 𝜇𝑝𝑞
𝑓 𝑐
𝑞=1 ||𝐴𝑝− 𝐵𝑞||
2 𝑟
𝑝=1 (1)
In equation (1), 𝑂𝐹 is the objective function, 𝑟 and 𝑐 represent the total number of entities and clusters respectively. 𝜇 indicates the fuzzy membership value and the fuzzy factor is denoted by 𝑓. 𝐴𝑝 is the 𝑝𝑡ℎ record and 𝐵𝑞
is the centre point of the 𝑞𝑡ℎ
cluster. ||𝐴𝑝− 𝐵𝑞|| 2
is the squared Euclidean distance between 𝐴𝑝 𝑎𝑛𝑑 𝐵𝑞, which is
calculated by eqn.2.
𝐹𝑁 = ||𝐴𝑝− 𝐵𝑞|| 2
= √∑ ((𝐴𝑝− 𝐵𝑞) 2
)2
𝑟
𝑝=1 (2)
The centre point of the 𝑞𝑡ℎ cluster is computed by
𝐵𝑞=
∑𝑟𝑝=1𝜇𝑝𝑞𝑓 𝑥𝑝
∑𝑟𝑝=1𝜇𝑝𝑞𝑓 (3)
The computation of fuzzy membership is performed by the following equation.
𝜇𝑝𝑞=
1
∑ (||𝐴𝑝−𝐵𝑞||
2
||𝐴𝑝−𝐵𝑞||2
)
2 𝑓−1 𝑐
𝑏=1
(4)
The initial centre point alone is selected by LOA, where LO algorithm works on the basis of the original behaviour of lions. The lions behave socially and hence, they live in groups called pride. However, it is not necessary that all the lions must live in pride. Some lions live independently and do not live in pride. These lions are called as roving lions and the lions in pride are called dwelling lions.Usually, a pride consists of about six lions, which consists of lions, lionesses and cubs. When the cubs grow up, then again they can live under pride or may rove. The young roving lions may feel to enter the pride and it can be achieved by defeating any of the dwelling lions. The roving lions can enter the pride at any point of time. Basically, the roving lions target the older lions to get into the pride and hence, the pride accommodates the fitter lions alone. When a lion is fitter than the other, the weaker lion is replaced by the fitter lion.
Proposed FCM-LO algorithm
Input: Health records (𝑑), termination condition Output: Clustered health records
Begin For all 𝑑
For all attributes Do
Pre-process the data;
Initialize the lion population and other parameters; Scatter the prey;
For every pride of lions
Choose a lioness for hunting in a random mode; Calculate the fitness of the lions by eqn.2; Calculate the success probability by eqn.5; Sort the fitness in ascending order; Ignore the lions with greater value; Apply FCM;
End for;
For all nomadic lions
Do the same as in pride of lion; Calculate fitness value;
Match the fitness of roving lion and the lions in pride; If (fitness(roving lion) < fitness(lion in pride) Move the roving lion to pride; Eliminate the roving lions with greater value; Apply FCM;
Match and swap the lions when better value is attained; Store the best solution;
End if; End for; End;
This idea is imposed for choosing the cluster centre point, and the proposed clustering algorithm is presented as follows. The success probability is computed by equation (5), which is as follows.
𝑠𝑝𝑟 = 𝐹𝑁𝑝
∑𝑛𝑝=1𝐹𝑁𝑛 (5) The success probability is calculated by considering
the fitness values of the 𝑝𝑡ℎ record and 𝑛 represents the total
count of cluster centre points. By this, the health records are clustered to improve the data analytics, as the clusters are performed for single attribute. The time consumption for clustering is relatively minimal, as the cluster centre point is chosen by LO algorithm. Hence, the related records are grouped together and the following section discusses about disease prediction.
3.5 Disease Prediction by SVM classifier
SVM is one of the most promising classifier [23,24], which is based on the hyperplane. The SVM classifier attempts to differentiate the data samples by fixing a boundary line called hyperplane. This work aims to predict the probable disease to the patient, when provided with the symptoms. Based on the symptoms, the SVM can predict the heart based disease and diabetes. This work involves multiple classes such as normal, possibility of heart disease, diabetes and so on. Hence, multiclass SVM is employed.
This work differentiates between the classes by including 𝑛(𝑛−1)
2 classifiers and the final outcomes of all
these classifiers are considered. At last, the disease prediction is performed by the max-voting policy [25]. Hence, all the classes are manipulated simultaneously by means of the following equation.
𝑚𝑖𝑛𝑛ℎ,𝑏,𝑠𝑣 1
2∑ 𝑛ℎ𝑦
𝑝
𝑛ℎ𝑦+ 𝑐 ∑𝑟𝑖=1∑𝑦≠𝑠𝑖𝑠𝑣𝑖,𝑦 𝑞
𝑦=1 (6)
Here, 𝑛ℎ appears normal to the hyperplane, b is the bias, 𝑠𝑣 is the slack variable, 𝑖 = 1,2, … 𝑟 are training samples and 𝑦
is the count of classes. The final decision is made by the equation (7).
𝐹𝐷 = 𝑚𝑎𝑥𝑦(𝑤𝑦 𝑝
𝛽(𝑥𝑖) + 𝑏𝑦) (7)
In this case, all the classifiers deal with every single pair of class. Let a health record ℎ𝑟 wants to be classified, such that to fall under three classes such as A, B, C. This process is accomplished by applying all the classifiers over an image.
Whenever a classifier wants the health record to be in class 𝐴, the value of class A is increased by 1 and so do for the rest. The final classification decision is made by considering the maximum votes obtained for every class. This kind of classification results in better accuracy rates, while achieving time consumption. The overall algorithm of the proposed disease prediction system is presented as follows.
Disease Prediction System based on Supervised Learning Input : Health records of patients;
Output: Disease prediction; //Training
Begin
Pre-process the health records; For every attribute
Cluster the data by FCM+LO; Save health clusters; End for;
Train SVM with health clusters; End;
// Testing
Input: Test health record Output: Disease prediction Begin
For every attribute
Match the attribute value with the clusters; Predict the disease and return;
End for; END;
In the training phase, the SVM is given knowledge with the formed health clusters. When the test health sample is passed, the SVM compares the record with the clusters and is easy to predict the disease. Additionally, whenever the physician intends to extract similar records with respect to the test record, it can easily be achieved. The heart related disease can be predicted by the following rule.
𝑃𝑜𝑠𝑠𝑖𝑏𝑖𝑙𝑖𝑡𝑦 𝑜𝑓 ℎ𝑒𝑎𝑟𝑡 𝑟𝑒𝑙𝑎𝑡𝑒𝑑 𝑑𝑖𝑠𝑒𝑎𝑠𝑒 ∶ {𝐴𝑔𝑒 > 35 𝐴𝑁𝐷 𝐵𝑀𝐼 > 30 𝐴𝑁𝐷 𝐵𝑃 =
𝐻𝐼𝐺𝐻 𝐴𝑁𝐷 𝑀𝑎𝑥 𝐻𝑒𝑎𝑟𝑡𝑅𝑎𝑡𝑒 = 𝐻𝐼𝐺𝐻 𝐴𝑁𝐷 𝐶ℎ𝑜𝑙𝑒𝑠𝑡𝑟𝑜𝑙 = 𝐻𝐼𝐺𝐻}
𝑃𝑜𝑠𝑠𝑖𝑏𝑖𝑙𝑖𝑡𝑦 𝑜𝑓 𝐷𝑖𝑎𝑏𝑒𝑡𝑒𝑠: {𝐵𝑙𝑜𝑜𝑑 𝑆𝑢𝑔𝑎𝑟 =
𝐻𝐼𝐺𝐻 𝐴𝑁𝐷 𝐵𝑀𝐼 = 𝐻𝐼𝐺𝐻 𝐴𝑁𝐷 𝐶𝑜𝑢𝑛𝑡 𝑜𝑓 𝑃𝑟𝑒𝑔𝑛𝑎𝑛𝑐𝑦 = 𝐻𝐼𝐺𝐻 𝐴𝑁𝐷 𝐼𝑛𝑠𝑢𝑙𝑖𝑛 =
𝐻𝐼𝐺𝐻 𝐴𝑁𝐷 𝐹𝑅𝐸𝑄𝑈𝐸𝑁𝐶𝑌 𝑂𝐹 𝑈𝑅𝐼𝑁𝐴𝑇𝐼𝑂𝑁 =
𝐻𝐼𝐺𝐻 𝐴𝑁𝐷 𝑆𝐿𝑂𝑊 𝐻𝐸𝐴𝐿𝐼𝑁𝐺 𝑊𝑂𝑈𝑁𝐷 = 𝑌𝐸𝑆}
In the above cases, the terms high and low are presented and the possible range values are presented in table 1. The performance of the proposed approach is analyzed in the following section.
IV. RESULTS AND DISCUSSION
The performance of the proposed work is evaluated in terms of prediction accuracy, precision, recall, F-measure rates and time consumption. The proposed work is simulated in Matlab 2016B framework over three connected computers with the storage capacity of 500 GB data and RAM of 24 GB. The performance of the proposed work is analyzed in three aspects with respect to clustering,
classification and comparison with existing works. The following equations present the performance metrics with its corresponding formula.
The accuracy rate is the most basic metric of any data analytical algorithm, as the perfection of the algorithm is decided by this metric and is computed by
𝐴 = 𝑇𝑃+𝑇𝑁
𝑇𝑃+𝑇𝑁+𝐹𝑃+𝐹𝑁× 100 (8)
The precision and recall rates of any algorithm should be as great as possible, such that the algorithm can be proven as reliable. Both the metrics are computed by the following equations.
𝑃𝑅 = 𝑇𝑃
𝑇𝑃+𝐹𝑁× 100 (9)
𝑅𝐶 = 𝑇𝑁
𝐹𝑃+𝑇𝑁× 100 (10)
The F-measure rate is computed by considering both the precision and recall rates. Hence, the F-measure rate is directly proportional to the precision and recall rates and is computed by the following equation.
𝐹𝑀 =2×𝑃𝑅×𝑅𝐶
𝑃𝑅+𝑅𝐶 (11)
In the equations from (8 to 11), TP, TN, FP, FN indicate true positive, true negative, false positive and false negative rates. Reduction of false positive and false negative rates is the main objective of this work and this objective can be fulfilled with better precision and recall rates.
This work presents a hybrid clustering algorithm by combining the FCM and LO algorithms. Though FCM is a standard clustering algorithm, it consumes more time to choose the centroid point of a cluster. The performance of FCM can be made better, when it is supported by another algorithm.
Hence, the FCM algorithm is combined with LO, which is a bio-inspired optimization algorithm. The initial cluster centre point is chosen by the LO algorithm and the FCM algorithm is then applied for performing clustering operation. This idea improves the clustering performance and the experimental results attained by the proposed clustering algorithm is compared with the individual performance of FCM and LO algorithms. The experimental results are presented in the following table 2.
[image:6.595.47.295.309.446.2]In order to prove the efficiency of the proposed hybrid clustering algorithm, this work compares the performances of the individual clustering algorithms such as FCM and LO. From the experimental results, it is observed that the performance of the proposed hybrid clustering algorithm is better than the individual clustering algorithms.
Table 2. Performance analysis w.r.t clustering techniques
Performance Measures / Clustering algorithm
FCM LO FCM+LO
Accuracy (%) 79.8 84.6 96.8
Precision (%) 73.9 81.8 94.9
Recall (%) 70.4 78.6 91.4
F-measure (%) 72.1 80.16 93.11
Time consumption (s)
11.3 9.2 4.2
The accuracy of the proposed clustering algorithm is 96.8 percent, which is far better than the comparative algorithms. The F-measure rate of the proposed algorithm is also better, as the FCM is complemented by the LO algorithm, which helps in attaining better clustering performance. The following section compares the performance of the classification algorithms.
4.2 Performance Analysis with respect to Classification
[image:6.595.304.555.473.583.2]Classification is the final decisive phase of any application and its main objective is to differentiate the data sample with respect to a specific class. The efficiency of a classification algorithm depends on the effectiveness of the knowledge gaining process. Based on the acquired knowledge, the classifier distinguishes the data samples. The proposed approach employs SVM classifier and the performance of SVM is evaluated against the well-known classifiers such as k-Nearest Neighbour (k-NN), Relevance Vector Machine (RVM). This analysis is carried out with the proposed clustering algorithm and by varying the classification techniques alone. The experimental results attained by the proposed work are as follows.
Table 3. Performance analysis w.r.t classification techniques
Performance Measures /
Clustering algorithm
k-NN RVM SVM
Accuracy (%) 79 84.6 96.8
Precision (%) 74.2 80.3 94.9
Recall (%) 69.1 77.4 91.4
F-measure (%) 71.55 78.82 93.11
Time consumption (s)
14.4 9.8 4.2
From the experimental results, it is proven that the performance of SVM classifier is better than the k-NN and RVM classifiers for the utilized dataset. Hence, the performance of the clustering algorithm is observed to be better with SVM classifier. The following sub-section compares the performance of the proposed work with the existing approaches.
4.3 Performance Comparison with Existing Approaches
The experimental results attained by the proposed work are compared against the existing approaches such as knowledge discovery based [14], machine learning based [17], patient centric system [18]. In [14], the big data analytics is carried out in the cloud environment. This work mines the patterns of data by considering every single patient and the knowledge is gained for predicting the abnormality. However, this work deals with basic health attributes and the decision making is done by context aware classification with minimal accuracy rates.
In [17], machine learning algorithms are presented to predict the chronic diseases and the missing data are dealt with the latent factor model. The classification is performed by Convolutional Neural Networks (CNN). This work suffers from time and computational complexities.
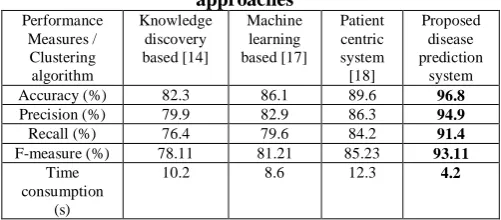
The patient centric system presented in [18], which collects the medical records of out-patients with the help of IoT sensors. The collected records are forwarded to the medical professionals via the cellular network. Though the working principles of the comparative approaches are different, all these works take the symptoms undergone by the patient into account. The experimental results attained by the works are presented in table 4.
Table 4. Performance comparison with existing approaches
Performance Measures / Clustering algorithm
Knowledge discovery based [14]
Machine learning based [17]
Patient centric system [18]
Proposed disease prediction
system
Accuracy (%) 82.3 86.1 89.6 96.8
Precision (%) 79.9 82.9 86.3 94.9
Recall (%) 76.4 79.6 84.2 91.4
F-measure (%) 78.11 81.21 85.23 93.11
Time consumption
(s)
10.2 8.6 12.3 4.2
From the experimental analysis, it is proven that the proposed disease prediction system effectively predicts the heart disease, diabetes and normal health condition, by showing greater accuracy, precision, recall and F-measure rates. The average results attained by the proposed disease prediction system are graphically shown in figure 2.
[image:6.595.49.297.705.782.2](a)
(b)
(c)
Fig.2. Experimental results by varying (a) clustering algorithms (b) classification algorithms (c) existing
techniques
As far as time consumption is considered, the proposed work involves minimal time consumption than the comparative approaches. This is because of effective data clustering, where the cluster centre point is chosen by LO algorithm and it supports FCM to execute faster. Finally, the SVM classifier matches the test health record with a cluster of related health records and not against a single record. This again improves the performance of the proposed disease prediction system with minimal time consumption. Hence, the proposed work can effectively predict the heart related ailments and diabetes as well.
V. CONCLUSIONS
This article presents a big data based disease prediction system, which is based on supervised learning approach. The proposed work collects data from different laboratories, hospitals and standard datasets to frame a medical database. The data available in the database are standardized in the data pre-processing phase. The related health records are
clustered together with respect to every single attribute by means of the combination of FCM and LO algorithms.
Finally, SVM classifier is employed to distinguish between the classes. The performance of the proposed disease prediction algorithm is tested in terms of precision, recall, F-measure, accuracy and time consumption. The proposed work performs better than the comparative approaches, as shown in the experimental results. This work is performed on a private centralized database server with limited data storage. Hence in future, this work is planned to be extended by utilizing cloud computing platform, such that any authorized healthcare specialist can access the record and provide personalized treatment to the patient.
REFERENCES
1. Uddin, M. F., & Gupta, N. (2014, April). Seven V's of Big Data understanding Big Data to extract value. In Proceedings of the 2014 zone 1 conference of the American Society for Engineering Education (pp. 1-5). IEEE.
2. Jindal, A., Dua, A., Kumar, N., Das, A. K., Vasilakos, A. V., & Rodrigues, J. J. (2018). Providing healthcare-as-a-service using fuzzy rule based big data analytics in cloud computing. IEEE journal of biomedical and health informatics, 22(5), 1605-1618.
3. Zhang, Y., Qiu, M., Tsai, C. W., Hassan, M. M., & Alamri, A. (2015). Health-CPS: Healthcare cyber-physical system assisted by cloud and big data. IEEE Systems Journal, 11(1), 88-95.
4. Hossain, M. S., & Muhammad, G. (2017). Emotion-aware connected healthcare big data towards 5G. IEEE Internet of Things Journal, 5(4), 2399-2406.
5. Nazir, S., Khan, M. N., Anwar, S., Adnan, A., Asadi, S., Shahzad, S., & Ali, S. (2019). Big Data Visualization in Cardiology—A Systematic Review and Future Directions. IEEE Access, 7, 115945-115958.
6. Al Hamid, H. A., Rahman, S. M. M., Hossain, M. S., Almogren, A., & Alamri, A. (2017). A security model for preserving the privacy of medical big data in a healthcare cloud using a fog computing facility with pairing-based cryptography. IEEE Access, 5, 22313-22328. 7. Dhayne, H., Haque, R., Kilany, R., & Taher, Y. (2019). In Search of
Big Medical Data Integration Solutions-A Comprehensive Survey. IEEE Access, 7, 91265-91290.
8. Kumar, S., & Singh, M. (2018). Big data analytics for healthcare industry: impact, applications, and tools. Big Data Mining and Analytics, 2(1), 48-57.
9. Li, Q., Lan, L., Zeng, N., You, L., Yin, J., Zhou, X., & Meng, Q. (2019). A Framework for Big Data Governance to Advance RHINs: A Case Study of China. IEEE Access, 7, 50330-50338.
10. Niu, W., Huang, J., Xing, Z., & Chen, J. (2019). Knowledge Spillovers of Medical Big Data Under Hierarchical Medical System and Patients’ Medical Treatment Decisions. IEEE Access, 7, 55770-55779.
11. Bahri, S., Zoghlami, N., Abed, M., & Tavares, J. M. R. (2018). BIG DATA for Healthcare: A Survey. IEEE Access, 7, 7397-7408. 12. Islam, M. M., Razzaque, M. A., Hassan, M. M., Ismail, W. N., &
Song, B. (2017). Mobile cloud-based big healthcare data processing in smart cities. IEEE Access, 5, 11887-11899.
13. Harerimana, G., Jang, B., Kim, J. W., & Park, H. K. (2018). Health big data analytics: A technology survey. IEEE Access, 6, 65661-65678.
14. Forkan, A. R. M., Khalil, I., Ibaida, A., & Tari, Z. (2015). BDCaM: Big data for context-aware monitoring—A personalized knowledge discovery framework for assisted healthcare. IEEE transactions on cloud computing, 5(4), 628-641.
15. Galletta, A., Carnevale, L., Bramanti, A., & Fazio, M. (2018). An innovative methodology for big data visualization for telemedicine. IEEE Transactions on Industrial Informatics, 15(1), 490-497. 16. Ma, Y., Wang, Y., Yang, J., Miao, Y., & Li, W. (2016). Big health
application system based on health internet of things and big data. IEEE Access, 5, 7885-7897.
17. Chen, M., Hao, Y., Hwang, K., Wang, L., & Wang, L. (2017). Disease prediction by machine learning over big data from healthcare communities. Ieee Access, 5, 8869-8879.
18. Hadi, M. S., Lawey, A. Q., El-Gorashi, T. E., & Elmirghani, J. M. (2019). Patient-Centric Cellular
Networks Optimization using Big
0 10 20 30 40 50 60 70 80 90 100
Accuracy Sensitivity Specificity F-measure Time consumption (s)
V
al
u
e
s
Performance Measures
FCM LO FCM+LO
0 10 20 30 40 50 60 70 80 90 100
Accuracy Sensitivity Specificity F-measure Time consumption (s)
V
al
u
e
s
Performance Metrics
k-NN RVM SVM
0 10 20 30 40 50 60 70 80 90 100
Accuracy (%) Precision (%) Recall (%) F-measure (%) Time
consumption (s)
V
al
u
e
s
Performance Measures
Data Analytics. IEEE Access, 7, 49279-49296.
19. Ezatpoor, P., Zhan, J., Wu, J. M. T., & Chiu, C. (2018). Finding Top-$ k Top-$ Dominance on Incomplete Big Data Using MapReduce Framework. IEEE Access, 6, 7872-7887.
20. Muhammed, T., Mehmood, R., Albeshri, A., & Katib, I. (2018). UbeHealth: a personalized ubiquitous cloud and edge-enabled networked healthcare system for smart cities. IEEE Access, 6, 32258-32285.
21. Yang, S., Wei, R., Guo, J., & Xu, L. (2017). Semantic inference on clinical documents: combining machine learning algorithms with an inference engine for effective clinical diagnosis and treatment. IEEE Access, 5, 3529-3546.
22. Yassine, A., Singh, S., & Alamri, A. (2017). Mining human activity patterns from smart home big data for health care applications. IEEE Access, 5, 13131-13141.
23. Madzarov, G., Gjorgjevikj, D., & Chorbev, I. (2009). A multi-class SVM classifier utilizing binary decision tree. Informatica, 33(2). 24. Bruzzone, L., & Persello, C. (2009). A novel context-sensitive
semisupervised SVM classifier robust to mislabeled training samples. IEEE Transactions on Geoscience and Remote Sensing, 47(7), 2142-2154.
25. Hsu, CW. and Lin, C.J., ―A comparison of methods for multiclass support vector machines,‖ IEEE Trans. Neural Networks, vol. 13, pp. 415-425, 2002.
26. Islam, M. J., Wu, Q. J., Ahmadi, M., & Sid-Ahmed, M. A. (2007, November). Investigating the performance of naive-bayes classifiers and k-nearest neighbor classifiers. In 2007 International Conference on Convergence Information Technology (ICCIT 2007) (pp. 1541-1546). IEEE.