Abstract— In this challenging era of technology where cloud computing has expanded its application wings in almost all areas. From individual end-users, small scale business to large organizations. All of them are now free from the maintenance, updating the software and taking the advantage of low-cost investments just by hiring the services and required applications from the cloud rather than building and maintaining the same. Though these advantages are creating much demand for cloud services with more required features at the same time, a challenge comes on the other side from attacks on client's data in the cloud. It becomes more difficult for the investigator to carry out the investigation during cyber-attacks on the cloud. During the attacks, there is a need for a quick response when certain anti-forensics is carried out to mislead the investigators. They may lead to waste of time, efforts, and spent cost. This paper presents a unique methodology to mitigate anti-forensics in a cloud with the effective usage of the relevant graphs. With the effective usage of graphs by the generation of attack, evidence and anti-forensic graphs helpful for the investigator to understand the cause and to carry out relatively countermeasures right way without being deviated by the anti-forensics.
Keywords: attack graph, evidence graph, anti-forensic graph.
I. INTRODUCTION
Attack and evidence graphs play a vital role during the security analysis. Intruders search for various ways in order to misguide and mislead cloud investigators. One of the major issues in cloud forensic is anti-forensics [1-3]. These investigators trace out the right cause for the attack and its initiation. With the help of various anti-forensic techniques, intruders want to have their upper hand on investigators. Below are some of the popular obfuscation techniques which are used by the intruders in order to compromise investigator during their investigation on client's data which has undergone cyber attacks.
Revised Version Manuscript Received on 05 August, 2019.
Shaik Khaja Mohiddin, Research Scholar, Dept. of CSE, Acharya Nagarjuna University, Guntur, Andhra Pradesh,India.(e-mail: [email protected])
Dr. Y Suresh Babu, Associate Professor, Asso.Prof., Dept. Of CSE. VVIT, Dept. Of CSE, JKC College, Chennai, Guntur, Andhra Pradesh,India
(e-mail: [email protected])
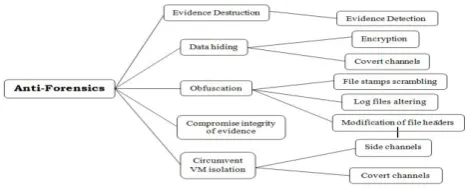
Fig 1: Classification of anti-forensics.
The entire paper is divided into four sections where the First section deals with the introduction of anti-forensics. The motivation behind the carried work is explained in the second section. Section three deals with a detail explanation about the attack, evidence and anti-forensic graphs. Section Four includes the conclusion and future work.
Classification of anti-forensics:
The above figure shows in detail classification of anti-forensics in cloud computing which is classified in the categories such as data hiding, obfuscation, circumvent of VM isolation, compromise the integrity of evidence, evidence destruction. All these methods are used by the intruders to mislead the investigators which can be explained as follows.
Evidence destruction: Intruders after successful completion of their task they destroy the evidence as not to give any lead for the investigator by detecting any kind of evidence.
Data hiding: After doing mischief with client's data in the cloud. Intruders try to hide the original data. In order to achieve this, they may choose various ways either encryption of data or covert channels. Various encryption methods are used for data hiding, for hidden and unauthorized access of data intruders prefer to use covert channels, this also referred to as data ex-filtration. In covert channels by violating security policies in unintended style with the help of medium information is sent in a un-authorized manner. Depending on the situation they may use either timing or storage-related covert channels. Where in storage covert channels hidden reading and writing of data is carried out un-authorizing manner. In covert channel related to timing information is passed from one system to another in a un-authorizing manner.
UNIQUE METHODOLOGY TO MITIGATE
ANTI-FORENSICS IN CLOUD USING
ATTACK- GRAPHS
[image:1.595.317.551.220.317.2] Obfuscation: It is the process which is related to disturbing the data stored in the cloud by the intruder and thereby making the available data difficult to understand by the investigator. Obfuscation can be reached with either log files alteration where the entire information related to the files i.e. log in time and logout time with respect to each file is changed which can misleads investigator, modification of file headers though an intruder changes the file type or any relevant content in the file the entire information is available in file headers. If file header is investigated properly they may give a proper lead but are hidden by intruders by obfuscation.
Compromise integrity of evidence: During the attack by the intruder on the client's data stored in the cloud. Intruders after successfully carrying out their task they simply make the data as before as a part of preserving the integrity of data. This definitely does not give a leading clue to an investigator who keeps on trying to find a lead for the attack.
Circumvent VM isolation: Intruders used the concept of SCA, covert channels with the help of which they come to know how the virtual machines are working during the cryptographic process and they latter change them according to their wish. Investigator fails to recognize how and what steps were carried out by the intruder in order to change the data and became successful even not leaving a single clue.
II. MOTIVATION FOR THE WORK
As there were not much progress for the usage of attack graphs in the field of cloud forensic with respect to a newly developed graph database “Neo4j”. The features of Neo4j with respect to the existing graph databases were found better in many aspects such as intuitive, reliable, massive elastic scaling, having high availability, simple, embeddable, fast and durable. According to Liu, C., in the paper [4] where attack graphs were implemented on networks forensics. The present work with necessary modifications was extended on clouds in the forensic field. This helped a lot in order to mitigate anti-forensics and take the lead in investigations by the investigator. The concept of attack graph in the cloud which was confined to only networks forensics was extended to even cloud forensics with our approach. As attack graphs worked well with network forensics with the existing database these accurate results in network forensics initiated in order to work in the field of forensic in a cloud with the help of Neo4j and which worked well. This new graph database has many advantages over the previously existing as discussed above. It is most effective in obtaining the required results in a clear cut way and easily understandable to the viewer. Even colour notations are very useful in order to indicate the important aspects of the graph.
III. GENERATION OF AEA GRAPHS HELPFUL FOR MITIGATING ANTI FORENSICS & RESULTS
Attack Graphs Generation:
As the graph gives a complete knowledge about the concept. Make familiar the proper paths which are followed, information related to each and every node are shown..i.e. the
has affected the node, the kind of anti-forensic associated with each node.
The graph shows vulnerabilities which are having a definite name with the definite CVE like evidence graph. It has Host ID which is defined as the IP address, States represents various vulnerabilities and Value represents definite CVE realization. When every node is observed carefully one can observe that a full string name for the vulnerabilities is traced out.
Fig2: Algorithm1 for Attack Graph
Description of algorithm:
[image:2.595.317.555.469.716.2]Empty array for the port set, a temporary port set along with the server node is created. Entry port and protocol are combined together to form a tuple. Such created tuples are normalized with MD5 in order to remove the duplicate elements among them. These obtained elements which are unique in nature are attached to the graph nodes along with the server node. With respect to the port entry and port set, a connection is established.
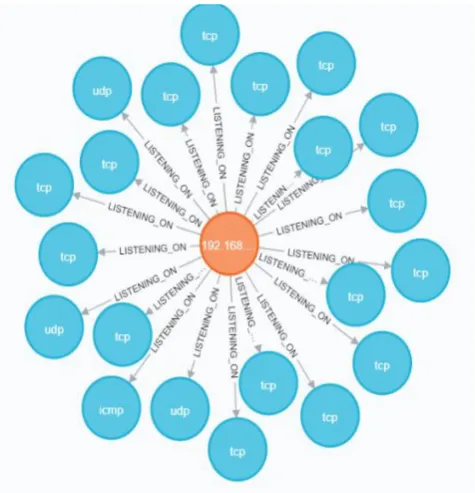
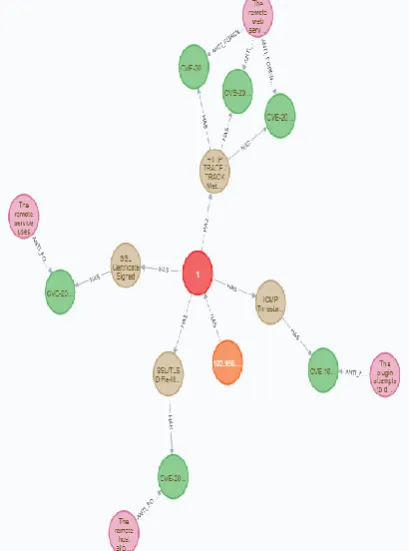
Results obtained from attack graph:
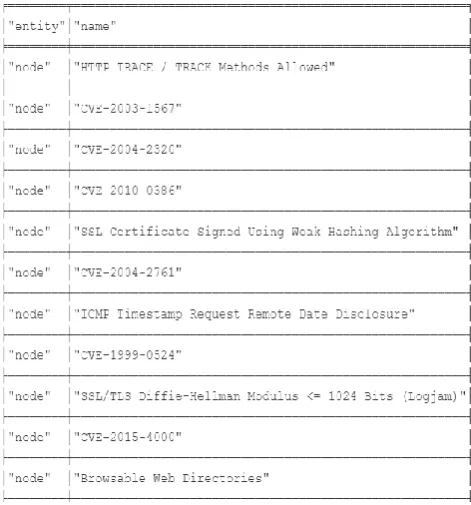
[image:3.595.322.543.56.104.2]The above attack graph is generated from the results obtained in the form of CSV file by our proposed framework [5] and the results were obtained in [6] where we have performed simulation of attacks on the framework. From the above graph it is very clear that from the source to the target how many attacks are being carried out and their relevant protocols, CVE associated with every attack can be observed once we move on the graph. The graph gives the complete information about the attacks which were observed in the cloud environment. The colour notations are helpful to trace out the different kinds of attacks. With respect to the various nodes in the graph the relevant CVE associated with them are obtained which gives complete information about the depth of the threat with which attacks are performed. The below table which is obtained after the successful running of the algorithm shows the associated list of CVE with each node in the graph. This information quite helpful for the investigator in order to overcome the anti-forensics used by an intruder.
Fig 4: Sample of associated CVE with each node
Evidence graph generation:
In order to trace out the shreds of evidence for the attack graph evidence graphs are generated for them. These generated evidence graphs are associated with the hypothesis. Sometimes the relationship between the hypothesis and shreds of evidence may be either weak or strong, it depends on the situation and kind of evidence which is associated with the hypothesis [7-8].
Usage of Bayesian Network for computing probability
For a given DAG let X1, X2, X3,...Xn are n variable which are randomly connected to DAG. With the help of Bayesian formula the probability distribution joint for the given variable can be achieved with the formula P (X1, X2, X3,...Xn) = Π n j=1[P(Xj)|Parent(Xj)].
Where Parent (Xj) = { Xi|arc (i->j) for the graph.
Fig 5: View showing the relation between H, E Hypothesis (H) is our guess or imagination and evidence (E) collected may be either supporting or opposing the hypothesis. The combination depends on the kind of hypothesis and the type of relevant evidence collected with respect to that. According to [9] the relation between hypothesis and evidence can be given in the below equation which is defined as
P (H|E) = ( ) ( ) ( ) =
( ) ( )
[image:3.595.313.562.205.487.2]( | ) ( ) ( | ) ( ) - (1)
Fig 6: Generated evidence graph
Where P (H|E) is obtained from the knowledge of experts. It represents investigators posterior probability which is obtained from both evidence E and hypothesis H. P(H) is the before probability of H even when the shreds of evidence were not discovered. P(E) is evidence probability without knowing about H by the expert, it is also referred to as constant normalization. This evidence graph contains nodes where the elements are associated with either hypothesis or evidence for every vulnerability. These P(H/E) values obtained from our work were considered to show that our hypothesis has matched to maximum shreds of evidence.
Results obtained from evidence graph:
A clear relation between the attack graph and evidence graph was successfully attached with the help of the Bayesian network. In this evidence graph, we took the help of even hypothesis which is helpful in order to predict whether our assumption with respect to the considered evidence is correct or not.
H (Hypothesis
)
[image:3.595.57.293.290.543.2]Anti-Forensic Graph Generation
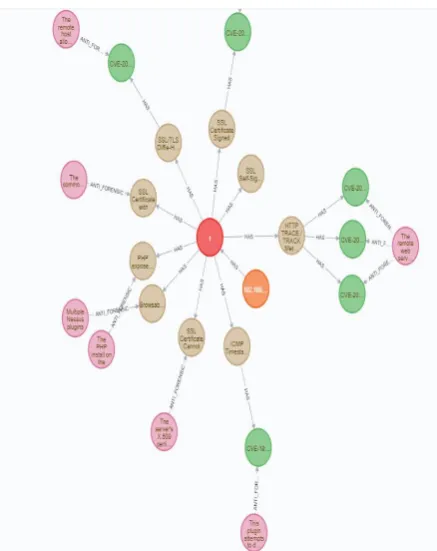
[image:4.595.319.547.126.628.2]Intruders after successful completion of their task as a part of misleading the investigator they use certain anti-forensics things such as erasing the particular IP address of the attacker, deleting the file name, making the modification of various modes of the file are among the few things which are popularly used by them. When an anti-forensic graph is generated it shows the maximum probabilities of the areas where the intruder can show his expertness in order to mislead the investigators. All such kind of things can be traced out with the help of this generated anti-forensic graph.
Fig 7: Algorithm 2 For evidence graph generation
Fig 8: Generated evidence graph for the obtained report
Description of the algorithm:
In this algorithm, the considered hypotheses are checked with respect to the pieces of evidence, the value of the probability was also high. With respect to each node, the corresponding evidence and hypothesis which are obtained are shown in the below diagram.
Fig 9: obtained co-relation between the evidence and hypothesis obtained from the evidence graph
Results obtained from the evidence graph:
[image:4.595.64.283.446.722.2]Fig 10: Algorithm3 For the anti-forensic generation
Fig 11: Generated Anti-forensic generated graph
Description of the algorithm:
In this algorithm, the output of algorithm 2 is taken as input with respect to each node of the graph the generated CVE for them are created. The evidence matched with the corresponding hypothesis is collected and from them, anti-forensics used by the intruders are traced out. The particular anti-forensic which is used is generated from the cipher query are shown in the below table.
Fig 12: Results obtained from the anti-forensic graph From the anti-forensic graph, one can obtain various anti-forensic methods an intruder has used in order to mislead the investigator. This may include some times the hiding of IP address, hiding the file data, providing wrong security certificate associated with a particular attack which has been carried out. All such kind of things can be traced out with the help of these anti-forensic graphs, afterward, these anti-forensic graphs are being compared and connected with the evidence graphs.
Fig13: showing the available shortest path for the graph
Results of shortest path:
reached. In this graph with respect to the vulnerability how it was created i.e. by which attack and from how many paths the attack was carried out and also what is the shorted path to reach the intruder is traced out in a good manner in our approach.
IV. CONCLUSION AND FUTURE WORK
Though there are various counter measures to give security and protection to the client's data in the cloud. But they fail to lead a way to the investigator during the investigations to be carried out on the cloud with respect to the cyber attack. In our approach we have successfully shown the way how the attacks are being carried out, how can one relate the attack graph with the evidence and also the role of anti-forensics with the effective usage required graphs. Beside these things we have also achieved that the shortest path out of all available paths can give a lead in a short time. We have successfully used the Bayesian Network in order to compute the probability of how the pieces of evidence can be connected to the hypothesis and vice –versa. With respect to the present scenario, these graph concepts can be used effectively but in the future, there will be a strong requirement to enhance these graphs with required updates.
REFERENCES
1. Draft NISTIR 8006 “NIST Cloud Computing Forensic Science Challenges,” http://csrc.nist.gov / publications / drafts/nistir-8006/draft_nistir_8006.pdf, June 2014. 2. Cnet, “Cybercrime moves to the cloud,”
http://www.cnet.com/news/cybercrime-moves-to-the-clo ud/ [Accessed January 21st, 2016].
3. Al Fahdi, M., Nathan L. Clarke, and Steven M. Furnell. "Challenges to digital forensics: A survey of researchers & practitioners attitudes and opinions."Information Security for South Africa, 2013. IEEE, 2013.
4. Liu, C., Singhal, A., & Wijesekera, D. (2012). Mapping evidence graphs to attack graphs. 2012 IEEE International Workshop on Information Forensics and Security (WIFS), from PP 121-127.
5. Shaik Khaja Mohiddin & Dr.Y Suresh Babu (2019). A Technical Framework for Reducing and Analyzing Vulnerable Cyber Attacks on the Cloud with the Inclusion of Snort based IDS Suitable to Carryout Forensic Analysis Further. JARDCS, ISSN: 1943-023X, Vol.10.Issue.10, from PP 323-333.
6. Shaik Khaja Mohiddin & Dr. Y Suresh Babu (2019). A Relevance Technical Approach for Screening the Significance of IDS in Cloud Forensics. (IJITEE) ISSN: 2278-3075, Volume-8 Issue-4S2 March, 2019, from PP 425-430.
7. M Kwan, K P Chow, F Law and P Lai. Reasoning About Evidence using Bayesian Network, Advances in Digital Forensics IV, International Federation for Information Processing (IFIP) January 2008, Tokyo, pp.141-155. 8. F. Taroni, A. Biedermann, P. Garbolino, C.G. Aitken, A
general approach to Bayesian networks for the interpretation of evidence Forensic Sci. Int., 139 (2004), pp. 5– 16.