Abstract: The dynamic response of reinforced concrete (RC) panels without and with different configuration of opening under blast load scenario is investigated in the present study. The numerical simulations were carried out using finite element method with ABAQUS application. The concrete behavior under blast loading was modelled using Concrete damaged plasticity model. The material parameters for concrete damaged plasticity model were determined using methodology proposed by [14]. The parametric study was carried out using variation in blast load due to different charge weight. It was observed that the peak displacement increases with increase in blast load. It was also observed that at lower blast load, failure of reinforced concrete panel was initiated by cracking at rear face of panel but as the blast load increases the RC panel was failed by combination of crushing of front face of panel along with cracking of rear face. It was observed that for the given blast load, the RC panel without opening is less affected by crushing failure as compared to RC panel with opening configuration studied. It was also observed that the RC panel with circular opening at center is stiffer than other opening configuration and observed to have stable structural performance against the blast load studied.
Keywords:blast phenomenon, numerical simulation, concrete damaged plasticity model, damage variables
I. INTRODUCTION
It is observed that majority of terrorist attacks are targeted to civilians, military buildings or commercial structures. Hence, it is necessary to have proper design guidelines for blast resistant design of such critical infrastructure facilities. Such structures may be designed for conventional loading i.e. dead loads, wind load, earthquake load, but may not be designed for blast loading. In term of sequence of response, the blast first impinges the exterior walls of the building and may cause wall failure. The RC walls or column type elements may be provided with openings for architectural requirement or other functional requirement. It is observed that most of the experimental works [1, 2] use solid concrete panels but experiments on the reinforced concrete panels with different configuration of the openings are not studied extensively. The present study highlights the behaviour of RC panel with and without opening configuration, under blast loading.
Revised Manuscript Received on June 15, 2019.
Palak J Shukla, Applied Mechanics Department, Shri K J Polytechnic, Bharuch,India.
Atul K Desai, Applied Mechanics Department, Sardar Vallabhbhai
National Institute of Technology, Surat, India.
Chetankumar D Modhera, Applied Mechanics Department, Sardar
Vallabhbhai National Institute of Technology, Surat, India.
Most of the researchers [3-5] used field test for experimental study of dynamic response of reinforced concrete panel subjected to blast loading.[6] and [7] used shock tube for laboratory test for experimental study of blast effects on reinforced concrete panel. Both methods of experimental study are expensive and sometimes beyond affordability, so numerical simulation are convenient tool to study the behaviour of reinforced concrete panel under blast load action.
In present study dynamic response of RC panel with and without opening were studied by finite element method using Abaqus application. The experimental work carried out by [8] was first validated by Abaqus to demonstrate its suitability. The results of response of reinforced concrete panel subjected to blast loading were represented in form of central deflection δ and normalized peak deflection δ/h. The thicknesses h of the slabs are 30 mm, 40 mm and 50 mm.The behaviour of concrete was simulated using concrete damaged plasticity model while plastic kinematic model used for simulation of steel. Subsequently, a parametric study on RC panel, with and without openings, are studied for the typical blast load scenarios. The response under the action of applied blast load were presented in form of displacement time history, distribution of compressive damage variable and distribution of tensile damage variable
II. VALIDATIONEXERCISE
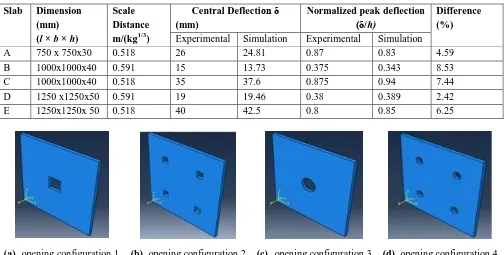
[8] has carried out experiments to study the behavior of three similar slabs having different scale down factors subjected to blast loading. The dimensions and the experimental setup is shown in Fig. 1. The details of experimental cases used for the validation and the results of the numerical simulations (using ABAQUS) carried out in the present study are compared with the results observed by [8] are presented in Table 1. It can be seen from the validation exercise that the blast load scenario can be reasonably simulated using CONWEP model in ABAQUS.
III. NUMERICALMODELINGOFRCPANEL A. Model Geometry
The details of the model used for the numerical modeling is presented Table 2 and Fig. 2. The reinforcements were modelled considering 6 mm diameter bar meshing at a distance of 75 mm both ways. The parametric studies were carried out for the reinforced concrete panel with the different configuration of openings for the same percentage of the opening area (2.56
percent of the total area i.e 200mmx 200 mm; Fig. 3a) as
Dynamic Response of RC Panel with and
Without Openings Subjected To Blast Loading
Dynamic Response of RC Panel with and Without Openings Subjected To Blast Loading
shown in Fig. 3. The parametric studies were also conducted for effect of different charge weight i.e. 0.13 kg of TNT, 0.39 kg of TNT, 0.52 kg of TNT at 500 mm standoff distance from
[image:2.595.58.503.77.416.2]the center of the wall. The RC panel was considered to be supported on the steel frame on two opposite sides.
Fig. 1 Geometry of slab [8]
[image:2.595.355.508.87.238.2]Fig. 2 Typical Reinforced Concrete Panel Subjected To Blast Loading
Table I Comparison Of The Results: Experimental With Numerical Modelling Slab Dimension
(mm) (l × b × h)
Scale Distance m/(kg1/3)
Central Deflection δ (mm)
Normalized peak deflection (δ/h)
Difference (%)
Experimental Simulation Experimental Simulation
A 750 x 750x30 0.518 26 24.81 0.87 0.83 4.59
B 1000x1000x40 0.591 15 13.73 0.375 0.343 8.53
C 1000x1000x40 0.518 35 37.6 0.875 0.94 7.44
D 1250 x1250x50 0.591 19 19.46 0.38 0.389 2.42
E 1250x1250x 50 0.518 40 42.5 0.8 0.85 6.25
[image:2.595.43.547.484.739.2]Fig. 3 RC Panel With The Different Configuration Of Opening Table II Geometric Details Of The Model Used For
Numerical Simulations Sr.
No.
Description Detail
1 Width of model (mm) 1250
2 Length of model (mm) 1250
3 Thickness (mm) 50
4 Charge weight (blast
load) kg of TNT (parametric study)
0.13, 0.39 and 0.52
5 Standoff distance (mm) 500
6 Grade of Concrete M40 ( 40 N/mm2)
7 Reinforcements 6mm diameter rebar
(600 MPa)
8 Material Model Concrete Damage
Plasticity Model
9 Opening details 2.56 % (refer Fig. 3)
10 Opening variation Square and circular
opening
B. Modeling Blast load
During an explosion, air forms a highly compressed gas mass which interacts with the surrounding air. This will further generate shock wave propagating outward. The equivalent load effects due to explosion can be defined either by air blast or by surface blast using empirical data provided by the CONWEP model. Fig. 4 highlights a typical pressure history of such blast wave. Based on the distance of loading surface from the source of explosion, CONWEP model uses a scaled distance and the amount of explosive detonated for characterizing the blast load.
For a given scaled distance, model provides the following empirical data the maximum overpressure, the arrival time, the positive phase duration and the exponential decay coefficient for both the incident pressure and reflected pressure
Total pressure P(t) is defined as :
P(t) = Pincident (t) [1+cos θ – 2cos 2θ] + Preflect (t) cos 2θ for cos θ ≥0;
(1)
P(t) = Pincident (t) for cosθ <0 (2)
Where Pincident (t) is incident pressure, Preflect (t) is the reflected pressure and the θ is angle of incidence which is defined as the angle between the normal of the loading surface and the vector that points from the surface to the explosion source
Fig. 4 Pressure History Of Blast Wave C. Material modeling for concrete
Many researchers has studied blast loading scenarios using many computer applications such as LS-DYNA [1, 3, 9], AUTODYNA [2], ABAQUS [10] or using single degree of freedom method of analysis [7,11]. It is observed that for numerical simulations of blast loading studies, the concrete behaviour can be better described with damage models whereas the steel behaviour can be represented by plasticity models. The concrete damaged plasticity model provides general capability for modelling concrete subjected to monotonic, cyclic and dynamic loading [12]. [13] proposed a plastic damage model for concrete which is based on an internal variable-formulation of plasticity theory for the non-linear analysis of concrete.
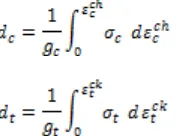
1) Details about concrete damaged plasticity model The concrete damaged plasticity model in ABAQUS assumes main two failure mechanisms i.e. the tensile cracking and compressive crushing of the concrete material [12]. Various parameters used to model the concrete using concrete damaged plasticity model, are calculated using the methodology proposed by [14] which considers the compressive and tensile damage variable (dc and dt respectively) as the portion of normalized energy dissipated by damage
[image:3.595.365.454.593.661.2]Dynamic Response of RC Panel with and Without Openings Subjected To Blast Loading
(Equation 3) and (Equation 4) shows that dc and dt ranges between 0 and 1.
The energies per unit area and per unit volume are related by gc = Gch / leq and gt = GF / leq ; Gch and GF are material parameters defined as crushing and fracture energies and leq is characteristic length of element.
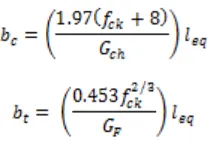
Relation between compressive and tensile stress and respectively crushing and cracking strain is established according to [13] as (5) and (6)
The proposed compressive and tensile damage functions are defined by (7) and (8)
Where the dimensionless coefficients ac , at, bc nd bt can be determined using (9) to (11)
In (9 and 10) and are the compressive and tensile stresses that correspond to zero crushing and to commencement of cracking respectively while and are maximum compressive and tensile stress respectively.
The model uses the the yield function of [13], along with the modification proposed by [15] to consider different evolution of strength under tension and compression (12).
With
Here is the hydrostatic pressure stress, is the Von Mises-equivalent effective stress , is the ratio of the initial biaxial compressive yield stress to initial uniaxial compressive yield stress the default value is 1.16 , is the ratio of the second stress invariant on the tensile meridian q(TM) to that on compressive meridian q(CM) at initial yield for any given value of the invariant p such that the maximum principal stress is negative it must satisfy the condition , is the effective compressive cohesion stress, is the effective tensile cohesion stress.
The model considers flow potential G, the Drucker-Prager hyperbolic function as per (13)
[image:4.595.111.184.62.121.2] [image:4.595.65.275.521.595.2]In (13) is the uniaxial tensile stress at failure, is the eccentricity of plastic potential surface and is the dilatancy angle measured in p-q deviatory plan at high confining pressure. Table III describes values of these parameters used in present study.
Table III Parameters of Concrete Damage Plasticity Model
Kc Ψ (˚) fb0/fc0 ϵ
0.7 31 1.16 0.1
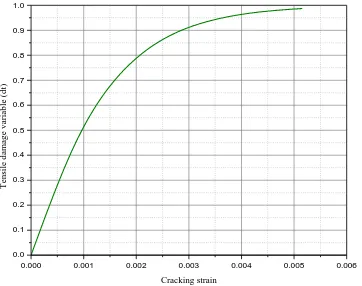
Fig. 5 indicates the concrete uniaxial stress-strain relationship used in the present study. Fig. 5 (a) and 5(b) represents the uniaxial behavior of concrete in compression and tension respectively. Fig. 6 and Fig. 7 represent the plots that constitute major inputs for the concrete damaged plasticity model in ABAQUS calculated as per above describe methodology. Fig. 6(a) represents the plot of compressive stress vs. crushing strain while Fig. 6 (b) represents the plot of tensile stress vs. cracking strain. Fig. 7 (a) represents the plot of compressive damage variable vs. crushing strain while Fig. 7 (b)
[image:4.595.97.201.667.738.2]damage variable vs. cracking strain
D. Modeling reinforcement
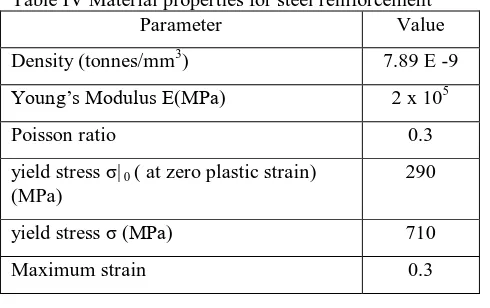
The reinforcement properties was model using ABAQUS Plastic Kinematic hardening keywords as indicated in Table 4. The linear kinematic model approximates the hardening behaviour with constant rate of hardening. Two data pairs are required to define the behaviour: the yield stress σ| 0 , at zero plastic strain and a yield stress σ at a finite plastic stain value εpl
. The linear kinematic hardening modulus C, is determined form the relation
Under dynamic loading, the strength properties of rebars are known to increase by up to 60% for strain rate for up to 10 s-1, and up to 100% for strain rates around 225 s-1. The ratio of the dynamic to static value generally known as Dynamic Increase Factor, is normally described as function of strain rate. For the design and analysis of the structures for explosive safety, knowledge of the DIF is of significant importance. The dynamic increase factor (DIF) for steel can be expressed as follow [16]
Where for the yield stress, α is expressed as follows:
[image:5.595.41.286.494.648.2]Where the strain rate is in s-1 and σy is the yield stress in MPa. (16) is valid with the yield stress between 290 and 710 MPa and for stain rates between 10-4 s-1 and 225 s-1. Table IV Material properties for steel reinforcement
Parameter Value
Density (tonnes/mm3) 7.89 E -9
Young’s Modulus E(MPa) 2 x 10⁵
Poisson ratio 0.3
yield stress σ| 0 ( at zero plastic strain) (MPa)
290
yield stress σ (MPa) 710
Maximum strain 0.3
IV. RESULTSANDOBSERVATIONS
The center node of the RC panel was selected to monitor the displacement time history for the RC panel without opening, the RC panel with opening configuration 2 and 4. For other
cases with configuration 1 and 3, the suitable node at the periphery of the opening was selected to monitor the displacement time history.
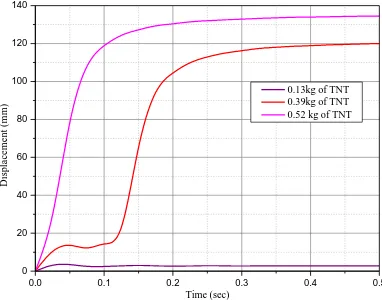
A. Displacement time history
Fig. 8 indicates the displacement time history for the RC panel without opening. It can be observed from the graph that the maximum displacement 94.91 mm was observed in case of the blast load with 0.52 kg charge weight while minimum displacement 3.7 mm was observed in case of blast load due to 0.13 kg charge weight. The displacement time histories for the RC panel with opening Configuration 1 are indicated in Fig. 9 for different blast load. It can be observed from the graph that the maximum displacement 156.37 mm was observed in case of blast load due to 0.52 kg charge weight while minimum displacement 3.02 mm was observed in case of blast load of 0.13 kg charge weight. The displacement time histories for RC panel with opening configuration 2 are indicated in Fig. 10 for different blast load. It can be observed from the graph that the blast load due to 0.52 kg of TNT charge weight gives maximum displacement i.e. 135.56 mm while the blast load due to 0.13 kg of TNT charge weight gives minimum displacement i.e. 3.46 mm. Fig. 11 indicates the displacement time history for RC panel with opening configuration 3. It can be observed from the graph that the maximum displacement 161.19 mm was observed in case of blast load due to 0.52 kg charge weight while minimum displacement 3.34 mm was observed in case of blast load due to 0.13 kg charge weight. The displacement time histories for RC panel with opening configuration 4 are indicated in Fig. 12 for different blast load. It can be observed from the graph that the maximum displacement 134.5 mm was observed in case of blast load due to 0.52 kg charge weight while minimum displacement 3.43 mm was observed in case of blast load due to 0.13 kg charge weight
B. Results of damage prediction
Dynamic Response of RC Panel with and Without Openings Subjected To Blast Loading
0.00 0.01 0.02 0.03 0.04 0.05 0.06
0 10 20 30 40 50 C o m p re ss iv e s tr es s ( M P a)
Total strain 0.000 0.001 0.002 0.003 0.004 0.005 0.006
0 1 2 3 4 T e n si le s tr e ss ( M P a )
Total tensile strain
[image:6.595.93.508.59.405.2](a)Compression (b)Tension
Fig. 5 Uniaxial Model Of Concrete Behavior
0.00 0.01 0.02 0.03 0.04 0.05 0.06
0 10 20 30 40 50 C o m p re ss iv e s tr es s ( M P a) Crushing strain
0.000 0.001 0.002 0.003 0.004 0.005
0 1 2 3 4 T e n si le s tr e ss ( M P a )
Cracking strain
(a)Compressive stress vs. crushing strain (b)Tensile stress vs. cracking strain
Fig. 6 Stress-Strain Parameters For Concrete Damaged Plasticity Model In ABAQUS
0.00 0.01 0.02 0.03 0.04 0.05 0.06
0.0 0.2 0.4 0.6 0.8 1.0 C o m p re ss io n d a m a g e v a ri a b le ( d c ) Crushing strain
0.000 0.001 0.002 0.003 0.004 0.005 0.006
0.0 0.1 0.2 0.3 0.4 0.5 0.6 0.7 0.8 0.9 1.0 T en si le d am ag e v ar ia b le ( d t) Cracking strain
(a)Compressive damage variable vs. crushing strain
[image:6.595.324.505.487.630.2](b)Tensile damage variable vs. cracking strain
[image:6.595.103.281.487.631.2]0.0 0.1 0.2 0.3 0.4 0.5 0 10 20 30 40 50 60 70 80 90 100 110 D is p la c e m e n t (m m ) Time (sec)
0.13kg of TNT 0.39kg of TNT 0.52 kg of TNT
0.0 0.1 0.2 0.3 0.4 0.5
0 20 40 60 80 100 120 140 160 D is p la c e m e n t ( m m ) Time (sec)
[image:7.595.82.254.54.192.2]0.13kg of TNT 0.39kg of TNT 0.52 kg of TNT
[image:7.595.325.492.56.197.2]Fig. 8 Displacement Time History For The RC Panel Without Opening
Fig. 9 Displacement Time History For The A RC Panel With Opening Configuration 1
0.0 0.1 0.2 0.3 0.4 0.5
0 20 40 60 80 100 120 140 D is p la c e m e n t ( m m ) Time (sec)
0.13kg of TNT 0.39kg of TNT 0.52 kg of TNT
0.0 0.1 0.2 0.3 0.4 0.5
0 20 40 60 80 100 120 140 160 D is p la c e m e n t (m m ) Time (sec)
0.13kg of TNT 0.39kg of TNT 0.52 kg of TNT
[image:7.595.330.510.271.428.2]Fig. 10 Displacement Time History For The RC Panel With Opening Configuration 2
Fig. 11 Displacement Time History For The RC Panel With Opening Configuration 3
0.0 0.1 0.2 0.3 0.4 0.5
0 20 40 60 80 100 120 140 D is p la c e m e n t (m m ) Time (sec)
[image:7.595.71.262.504.654.2]0.13kg of TNT 0.39kg of TNT 0.52 kg of TNT
Fig. 12 Displacement Time History For The RC Panel With Opening Configuration 4
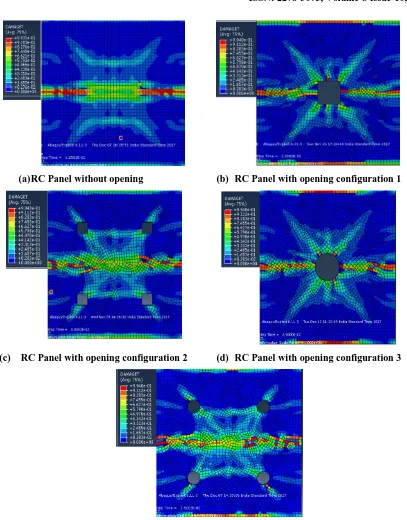
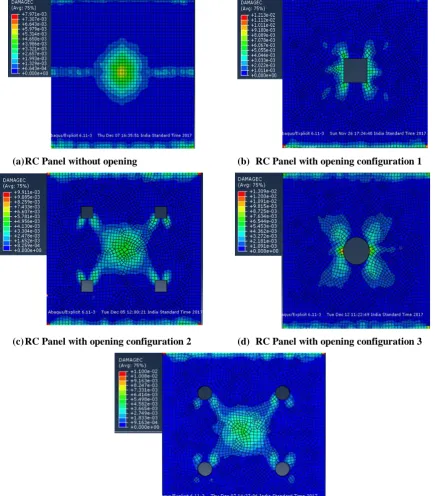
Fig. 13 indicates the distribution of tensile damage variable on back side of RC panel with different configuration of opening subjected to blast load with 0.13 kg of TNT. The red cells indicate maximum value of tensile damage variable. It can be observed from distribution of tensile damage variable (Fig. 13 (a)) for RC panel without opening that the damage of the RC panel was localized along the strip parallel to support
but less affect the center of RC panel. The distribution of tensile damage variable for RC panel with opening configuration 1 and 3 indicates (Fig. 13 (b) and (d)), the localized damage along the strip parallel to support at center of RC panel and near the support. Fig. 13(c) and (e) indicates the localized failure along the strip parallel to support at centre of panel and the area covered between four openings is also affected. As the RC panel is acting as wall and supported on two sides the compression failure occurs on the front face of panel. Fig. 14 indicates the distribution of compressive damage variable on front side of RC panel with different opening configuration subjected to blast load due to 0.13 kg of TNT charge weight. The red cells indicate maximum value of compressive damage variables but it does not reach nearer to one which means that the RC panel is not fail by crushing. It can be observed that the distribution of compressive damage variable is concentrated around center of the RC panel in all cases.
The distribution of tensile damage variable on back side of RC panel with different configuration subjected to blast load with0.39 kg of TNT charge
weight is shown in Fig. 15. It
can be observed from
Dynamic Response of RC Panel with and Without Openings Subjected To Blast Loading
variable (Fig. 15 (a)) for RC panel without opening that the damage of the RC panel was localized along the strip parallel to support and more concentrated near center of the RC panel. The distribution of tensile damage variable for RC panel with opening configuration 1 and 3 indicates (Fig. 15 (b) and 15 (d)), the localized damage along the strip parallel to support at center of RC panel and around the opening. Fig. 15 (c) and (e) indicates the localized damage of RC panel with opening configuration 2 and 3 along the strip parallel to support at center of panel. Fig. 16 indicates the distribution of compressive damage variable on front side of RC panel with different opening configuration subjected to blast load due to 0.39 kg of TNT. The red cells indicate maximum value of compressive damage variables. The distribution of tensile damage variable on the back side of the RC panel, with different configuration subjected to blast load with 0.52 kg of TNT charge weight is shown in Fig. 17(a) to Fig. 17(e). The
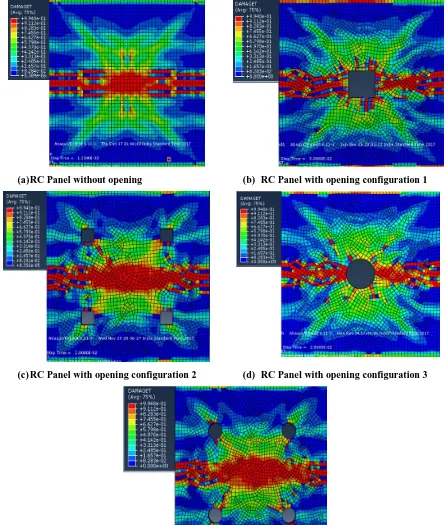
[image:8.595.62.550.266.801.2]red cells indicate maximum value of tensile damage variable. It can be observed from the distribution of tensile damage variable, the RC panel without any opening indicates the localized damage along the strip parallel to support but the RC panel with opening configuration 2 and 4 indicate the large damage area for the same blast load case. It is also observed that the RC panel with opening configuration 1 and 3 indicate the localized damage along the strip parallel to support at the center of the panel and near the support. Fig. 18(a) to Fig. 18 (e) indicates the distribution of compressive damage variable on the front side of the RC panel i.e. acting as the wall with different configuration. The red cells indicate maximum value of compressive damage variables. It can be observed that the distribution of compressive damage variable is concentrated around the center of the RC panel in all cases.
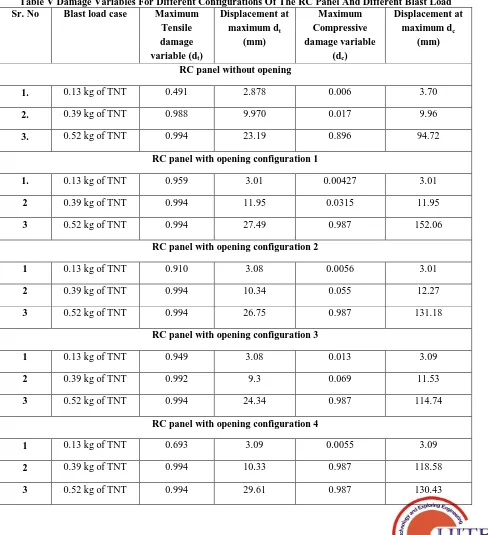
Table VDamage Variables For Different Configurations Of The RC Panel And Different Blast Load Sr. No Blast load case Maximum
Tensile damage variable (dt)
Displacement at maximum dt
(mm)
Maximum Compressive damage variable
(dc)
Displacement at maximum dc
(mm)
RC panel without opening
1. 0.13 kg of TNT 0.491 2.878 0.006 3.70
2. 0.39 kg of TNT 0.988 9.970 0.017 9.96
3. 0.52 kg of TNT 0.994 23.19 0.896 94.72
RC panel with opening configuration 1
1. 0.13 kg of TNT 0.959 3.01 0.00427 3.01
2 0.39 kg of TNT 0.994 11.95 0.0315 11.95
3 0.52 kg of TNT 0.994 27.49 0.987 152.06
RC panel with opening configuration 2
1 0.13 kg of TNT 0.910 3.08 0.0056 3.01
2 0.39 kg of TNT 0.994 10.34 0.055 12.27
3 0.52 kg of TNT 0.994 26.75 0.987 131.18
RC panel with opening configuration 3
1 0.13 kg of TNT 0.949 3.08 0.013 3.09
2 0.39 kg of TNT 0.992 9.3 0.069 11.53
3 0.52 kg of TNT 0.994 24.34 0.987 114.74
RC panel with opening configuration 4
1 0.13 kg of TNT 0.693 3.09 0.0055 3.09
2 0.39 kg of TNT 0.994 10.33 0.987 118.58
(a) RC Panel without opening (b) RC Panel with opening configuration 1
(c) RC Panel with opening configuration 2 (d) RC Panel with opening configuration 3
[image:9.595.88.495.30.550.2](e) RC Panel with opening configuration 4
Dynamic Response of RC Panel with and Without Openings Subjected To Blast Loading
(a) RC Panel without opening (b) RC Panel with opening configuration 1
(c) RC Panel with opening configuration 2 (d) RC Panel with opening configuration 3
[image:10.595.77.513.58.555.2](e) RC Panel with opening configuration 4
(a) RC Panel without opening (b) RC Panel with opening configuration 1
(c) RC Panel with opening configuration 2 (d) RC Panel with opening configuration 3
[image:11.595.72.518.52.577.2](e) RC Panel with opening configuration 4
Dynamic Response of RC Panel with and Without Openings Subjected To Blast Loading
(a) RC Panel Without Opening (b) RC Panel with opening configuration 1
(c) RC Panel with opening configuration 2 (d) RC Panel with opening configuration 3
[image:12.595.77.512.39.585.2](e) RC Panel with opening configuration 4
(a) RC Panel without opening (b) RC Panel with opening configuration 1
(c) RC Panel with opening configuration 2 (d) RC Panel with opening configuration 3
[image:13.595.84.515.41.602.2](e) RC Panel with opening configuration 4
Dynamic Response of RC Panel with and Without Openings Subjected To Blast Loading
(a) RC Panel without opening (b) RC Panel with opening configuration 1
(c) RC Panel with opening configuration 2 (d) RC Panel with opening configuration 3
[image:14.595.74.512.54.596.2](e) RC Panel with opening configuration 4
V. CONCLUSIONS
The RC panel was subjected to different charge weights as blast loading scenarios at 500 mm standoff distance. The parametric study was carried out considering different charge weight i.e. 0.13 kg of TNT, 0.39 kg of TNT, 0.52 kg of TNT blast load and with different configuration of openings for the same percentage area of opening (2.56 percentage of total area of RC panel). The concrete was modeled using concrete damaged plasticity model. The transient response of RC panel was monitored in terms of displacement, tensile damage variable, compressive damage variables etc.
Based on the present study it was observed that the displacement of RC panel subjected to blast load increases with increase in charge weight for same standoff distance. It is also observed that The failure of panel is governed by cracking at rear face (i.e. tension face) of panel for blast load due to 0.39 kg of TNT but as the blast load increases, the failure of RC panel is governed by cracking at the rear face of panel mainly due to tension accumulation and crushing at front face of panel due to compressive force mobilization. For the typical blast load case the RC panel without opening is less affected by crushing failure as compared to RC panel with other opening configuration. For single opening in center (square/ circular opening) the damage distribution is lower and largely concentrated to strip parallel to support where as for the RC panel with distributed opening (i.e. four opening of square/circular shape) the damage is distributed in almost entire area. On the close observation of tensile damage distribution for RC panel with square opening at center and RC panel with circular opening at center, it is observed that RC panel with circular opening has comparatively less damage distribution. Based on these observations, it is observed that RC panels with openings perform weaker as compared to solid panels under the blast loading. However, RC panel with single circular opening is structurally more stable & stiff compared to square opening in center and distribute openings are not preferred for blast resistance performances.
REFERENCES
1. J Li, C. Wu, H. Hao, Z. Wang, Y. Su , “Experimental investigation of
ultra-high performance concrete slabs under contact explosions”, International Journal of Impact Engineering, 2016, vol. 93, pp. 62-75
2. W. Wang, D. Zhang, F. Lu, S. Wang & F. Tang,(2013) Experimental
study and numerical simulation of the damage mode of a square reinforced concrete slab under close-in explosion., ,Engineering Failure Analysis, 2013, vol 27, pp. 41-51
3. Z. Syed, S. Raman, T. Ngo, P. Mendis & T. Pham, “The failure behavior
of reinforced concrete panel under far-field and near-field blast effects”.Structures,2018, vol. 14, pp. 220-229
4. J. Li, C. Wu & H. Hao , “Investigation of ultra-high performance concrete
slab and normal strength concrete slab under contact explosion”, Engineering Structures,2015,vol. 102, pp. 395-408
5. D Kakogiannis , F. Pascualena ,B. Reymen , L. Pyl, J. M Ndambi ,E.
Segers, D. Lecompte, J. Vantomme & T. Kramuthammer ,“Blast performance of reinforced concrete hollow core slabs in combination with fire: Numerical and experimental assessment”, Fire Safety Journal, 2013, vol. 57, pp 69-82
6. G. Thiagarajan, A. Kadambi, S. Robert & C. Johnson, “Experimental
and finite element analysis of doubly reinforced concrete slabs subjected to blast loads”, International Journal of Impact Engineering,2015, vol 78:162-173
7. A. Stolz, K. Fischer, C. Roller & S. Hauser (2014), “Dynamic bearing
capacity of ductile concrete plates under blast loading”. International Journal of Impact Engineering,2014, vol. 69, pp. 25-38
8. W. Wang, D. Zhang, F. Lu, S. Wang & F. Tang (2012) Experimental
study on scaling the explosion resistance of a one way square reinforced concrete slab under a close-in blast loading, International Journal of Impact Engineering,2012, vol. 49, pp. 158-164
9. S. Yao, S. Zhang, X. Chen, F. Lu & W. Wang, (2016) “Experimental and
numerical study on the dynamic response of RC slabs under blast loading”, Engineering Failure Analysis, 2016, vol. 66, pp 120-129
10. Yi Huan, Q. Fang, Li Chen & Y. Zhang (2008) Evaluation of
blast-resistant performance predicted by damaged plasticity model for concrete, Transactions of Tianjin University and Springer-Verlag,2008), vol. 14(6), pp. 414-421
11. Y. Xia, C. Wu & Z. Li, Optimized design of foam cladding for protection
of reinforced concrete members under blast loading, Journal of Structural Engineering, 2014, pp 06014010-1-7
12. ABAQUS/CAE User’s Manual, Dassault Systems Simulia Corporation,
Providence, Rhode Island, USA, Version 6.11.
13. J Lubnier , J Oliver, S Oller & E. Onate, “ A plastic damage model for
concrete” , Solid Structure, 1989, vol. 23(5),pp -299-326
14. B. Alfarah, F. Almansa-Lopez & S. Oller, “New methodology for
calculating damage”, variables evolution in plastic damage model for RC structures Engineering Structures, 2017, vol. 132, pp.- 70-86
15. J. Lee & GL Fenves” Plastic-damage for cyclic loading of concrete
structures”. Journal of Engineering Mechanics,1998, vol. 124:892-900
16. L J Malvar & J E Crawford (1998) , “Dynamic increase factors for steel
reinforcing bars”, Twenty-Eighths DDESB Seminar, 1998, Orlando, 1-17
AUTHORSPROFILE
Palak J Shukla has done her graduation in 2001 and masters in stuctural engineering from Sardar Vallabhbhai National Institute of Technology (SVNIT) Suart in 2012. She is persuring PhD from SVNIT, Surat. She is working as Lecturer in Applied Mechanics Department at Shri K J Polytechanic, Bharuch, Gujarat, India. She has teaching experience of 14 years. She has published 8 research papers in national and international conference and journals.
Dr. Atul K Desai has done his graduation in 1983 and masters in structural engineering in 1985 from Sardar Vallabhbhai National Institute of Technology (SVNIT) Surat. He has done PhD in 2008 SVNIT, Surat. He is woring as professor in Applied Mechanics Department at SVNIT, Surat. He has teaching experience of 34 years and guided 11 PhD students and 70 post graduate students in structural engineering field. He has published more than 100 research papers in reputed international journals.
Dr. Chetankumar D. Modhera has done his graduation
in 1989 and masters in structural engineering in 1992. He