Int. J. Electrochem. Sci., 10 (2015) 5086 - 5100
International Journal of
ELECTROCHEMICAL
SCIENCE
www.electrochemsci.org
Effects of Catalyst Layer and Gas Diffusion Layer Thickness on
the Performance of Activated Carbon Air-cathode for Microbial
Fuel Cells
Xiaojing Li1,2, Xin Wang1,*, Yueyong Zhang1, Ningshengjie Gao1, Desheng Li2, Qixing Zhou1,* 1
MOE Key Laboratory of Pollution Processes and Environmental Criteria / Tianjin Key Laboratory of Environmental Remediation and Pollution Control / College of Environmental Science and
Engineering, Nankai University, Tianjin 300071, China 2
School of Environmental Science and Safety Engineering, Tianjin University of Technology, Tianjin 300384, China
*
E-mail: [email protected]; [email protected]
Received: 22 February 2015 / Accepted: 19 March 2015 / Published: 28 April 2015
There are three key species to transport in AC air-cathodes, including O2, H2O and OH-. The thickness of GDL could be an apparent and easy-controlled parameter to optimize the O2 transport while the thickness of CLs is important to the transport of not only O2 but also H2O and OH-. In terms of maximum power density, the optimal thickness of CL was 0.2 mm with the highest power density of 2348 80 mW·m-2 obtained using 0.3 mm of GDL. According to the correlation analysis, the thickness of CL (Pearson correlation coefficient of 0.709) played a more important role than that of GDL (Pearson correlation coefficient of 0.542) on the exchange current density and the maximum power density. The thickness of GDL was mainly related to the charge transfer resistance which accounted for 49–87% of the total internal resistance. The correlation analysis also showed that the total thickness of air-cathode had a significant correlation to the exchange current density. The thickness of CL was more significant than GDL on the exchange current density and maximum power density with the optimal thickness of 0.2 mm. The thickness of GDL was mainly related to the charge transfer resistance.
Keywords: microbial fuel cells; gas diffusion layer; catalysis layer; internal resistance; correlation analysis
1. INTRODUCTION
point of energy is to reduce the energy needed through the decrease of both energy consumption and the production of secondary sludge [3]. To improve the power output of MFCs for the future application, the performance of the cathode has been considered as one of the largest bottlenecks which need to be improved [4].
The air-cathode is one of the most widely-used cathodes with one side directly exposed to the air. It is usually consisted of a gas diffusion layer (GDL), a current collector and a catalyst layer (CL). Polytetrafluoroethene (PTFE) was usually used in the GDL to avoid leaking and transfer oxygen. Metal meshes are the most widely used as the current collector, such as stainless steel mesh due to its low cost and anticorrosion [5, 6]. The CL is studied intensively from compound substances [7, 8] to elementary [9], from metals [10] to nonmetal materials [11]. However, the air-cathode is not economically applicable until the expensive catalyst made of precious metals was substituted by low-cost materials such as activated carbon (AC) [12, 13].
Compared to the method of brushing, the rolling-press has advantages of good reproducibility, simple operation and labor-saving [14]. There are three key species to transport in AC air-cathodes, including O2, H2O and OH-. The thickness of GDL could be an apparent and easy-controlled parameter to optimize the O2 transport. Similarly, the thickness of CLs is important to the transport of not only O2 but also H2O and OH-.
In order to investigate the effect of GDL or CL thickness on the cathodic performance, GDLs and CLs with different thickness were assembled to nine AC air-cathodes. The performances were tested in terms of power output, current density and internal resistance.
2. MATERIALS AND METHODS 2.1 Fabrication of Air-cathodes
All cathodes consisted of a stainless steel mesh (4040 mesh, type 304, Detiannuo Commercial Trade Co. Ltd., Tianjin, China) with a CL rolled on the water facing side and a GDL rolled on the air facing side. Cathodes were made by rolling-press method according to previous description [14, 15] with a slight change. Firstly, the time of ultrasonic agitation before and after dripping PTFE emulsion (60 wt%, Hesen, Shanghai, China) was reduced to 10 min to avoid destroying the fine mixture of PTFE and carbon. Secondly, water or ethanol was not used during the rolling-press process in order to make the bond the GDL and CL to the stainless steel mesh stronger. The GDL was made of carbon black (Jinqiushi Chemical Co. Ltd., Tianjin, China) and PTFE emulsion with a mass ratio of 3:7. The GDL film was rolled on a stainless steel mesh and followed by heating at 340 °C for 20 min [6]. The CL was made of activated carbon (Xinsen Carbon Co. Ltd., Fujian, China) and PTFE emulsion with a mass ratio of 6:1. AC air-cathodes were dried at room temperature for at least 24 h before installed in MFCs.
cathodes were marked as: 0.3G0.1C, 0.3G0.2C, 0.3G0.3C, 0.5G0.1C, 0.5G0.2C, 0.5G0.3C, 0.7G0.1C, 0.7G0.2C, 0.7G0.3C.
2.2 MFC Construction and Operation
MFCs were single chambered cubic-shaped reactors as described previously (4 cm long and 3 cm in diameter) [9]. All anodes were carbon fiber brushes soaked overnight by acetone [16]. MFCs were inoculated with the effluent from three MFCs operated for over one year. The medium contained a phosphate buffer nutrient solution (50 mM PBS; Na2HPO4·12H2O 10.317 g∙L−1; NaH2PHO4·2H2O 3.321 g∙L−1; NH4Cl 0.31 g∙L−1; KCl 0.13 g∙L−1), a trace mineral solution (12.5 mL∙L−1), a vitamin solution (5 mL∙L−1) and sodium acetate (1.0 g∙L−1) [17]. All reactors were refilled each time when the voltage decreased to less than 50 mV, forming a complete cycle at 30 °C in constant temperature incubator.
2.3 Calculations and Measurements
Polarization and power density curves were measured by varying the external resistance from 1000 to 30 Ω with a time interval of 25 min to ensure a stable voltage at the 3rd cycle of MFCs where the anodes were well pre-acclimated. Coulombic efficiencies (CEs) were calculated as CE = Ch/Ct, where Ch is the amount of Coulombs harvested in one cycle and Ct is the theoretical Coulombs calculated from the complete oxidation of acetate as Ct = F b M v. F is Faraday’s constant (96485 C·mol-e-1
), b is the number of electrons produced per mol of substrate (8 mol-e mol-acetate-1), M is the acetate concentration and v is the liquid volume (28 mL).
The linear fit and the non-linear surface fit were performed using Origin 9.0. Non-linear surface fit equation were calculated as z = c0 + c1x + c2y +c12xy + c11x2 +c22y2, where x (mm) is thickness of GDL, y (mm) is thickness of CL, z1 (mW∙m
−2
) is maximum power density, z2 (A·m-2) is exchange current density, z3 () is current transfer resistance and c0, c1, c2, c12, c11, c22 are the corresponding constant coefficients. The Pearson correlation coefficient at 0.01/0.05 level (significant 2-tail test, n = 9) was obtained by using Bivariate Analysis of Statistical Product and Service Solutions 19.0.
2.4 Electrochemical Analysis
Before electrochemical tests, cathodes were soaked in 50 mM PBS in abiotic reactors for at least 24 h. The target cathode was used as the working electrode, a platinum sheet of 1 cm2 was used as the counter electrode and a saturated calomel electrode (3 M KCl, 0.241 V versus standard hydrogen electrode) was used as the reference electrode. All the electrochemical tests were performed in the same reactor using a firmly fixed reference electrode and refilling the same PBS electrolyte.
Linear sweep voltammetry (LSV) was conducted from 0.3 to −0.2 V at the scan rate of 0.1 mV∙s-1. Tafel plots (log |current density|, A∙m-2
the overpotential (|η|, mV) from 0 to 100 mV at the scan rate of 0.1 mV∙s-1, where η = 0 is the open circuit potential (OCP).
Electrochemical impedance spectrum (EIS) was performed over a frequency range from 100 kHz to 10 mHz with a sinusoidal perturbation signal amplitude of 10 mV using a potentiostat (Autolab PGSTAT 302N, Metrohm, Switzerland) at OCP. The Nyquist plots were used to interpret the spectra. A fitting program (ZsimpWin 3.10) was employed to simulate plots according to an equivalent circuit reported previously [6].
3. RESULTS
3.1 Performance of MFCs
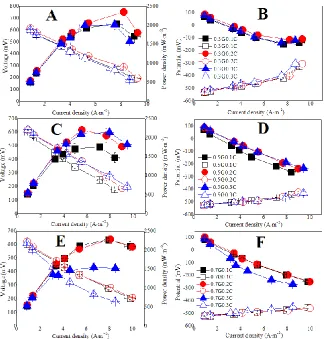
Figure 1. Polarization curves and power density curves (A/C/E) and electrode potentials (B/D/F) of MFCs using different air-cathodes. A and B: 0.3GyC, C and D: 0.5GyC, E and F: 0.7GyC.
[image:4.596.137.463.283.622.2]
CL (0.3 mm) (Figure 1E, Table S1). The cathodic potentials at their highest power densities tend to decrease with the increase of GDL thickness. For example, the cathodic potential decreased from –141 to –189 mV and –237 mV when the thickness of GDL increased from 0.3 to 0.5 mm and to 0.7 mm with the same 0.3 mm of CL.
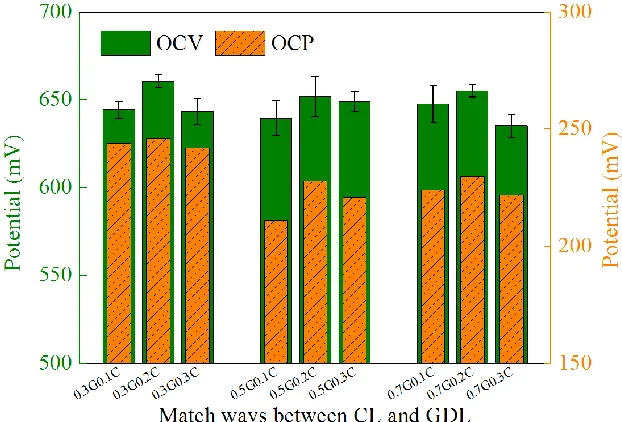
The xG0.2C cathodes exhibited the highest open circuit voltages (OCVs) of 661±4, 652±12 and 655±4 mV and the highest OCPs of 246, 228 and 230 mV with 0.3, 0.5 and 0.7 mm of GDLs respectively (Figure S1), which was consistent with the power density results.
CEs at the start-up period, stationary period and non-equilibrium period were showed in supporting information (Figure S2). In the first period (from the 1st to 3rd cycle, or from 0 to 200 h), MFCs using 0.2 mm of CL exhibited a faster voltage increase than other MFCs with the same GDL thickness (Figure S2A, B and C). When CE reached to ~25% (the 4th cycle), the inoculation was stopped and a relative stable CEs were obtained from the 4th to 7th cycle (from 200 to 350 h). From the 8th cycle, the inoculation was restarted, resulted in a further increase in CEs with a non-stable trend, indicating that the inoculation played an important role in CEs.
3.2 LSVs and Tafel Plots of Air-cathodes
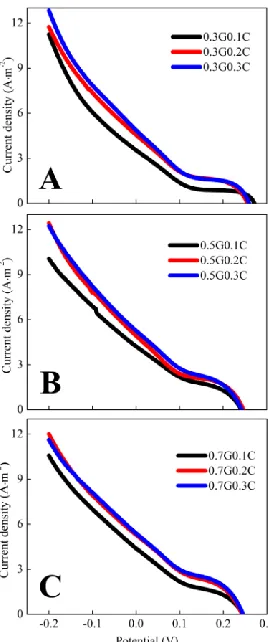
[image:5.596.232.366.380.701.2]
With the same thickness of GDL, current densities increased with the thickness of CL over the potential range from –0.1 to 0.2 V (Figure 2). For example, at the potential of 0 V (versus saturated calomel electrode), current densities of 4.23, 4.93 and 5.26 A·m-2
were achieved in 0.5G0.1C, 0.5G0.2C and 0.5G0.3C air-cathodes respectively (Figure 2B). Although the current densities also increased with the thickness of GDLs, the influence was not as obvious as that of CLs.
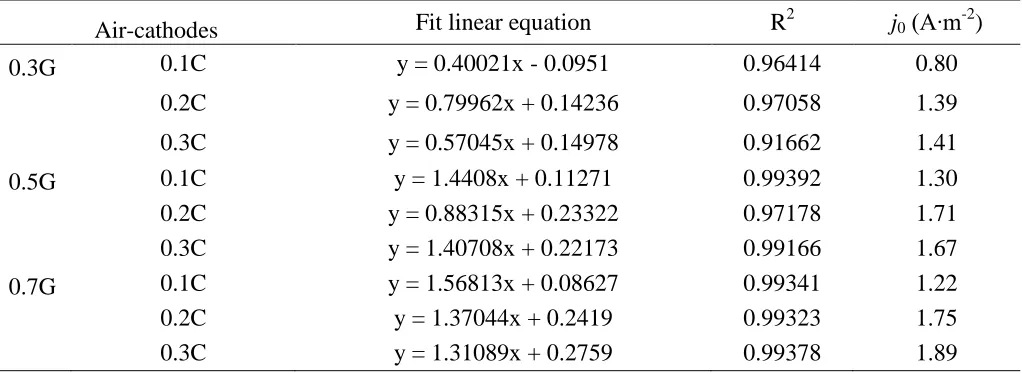
According to Tafel plots and linear fitting results at potentials from 80 to 100 mV, the exchange current densities (j0, A·m-2
) increased with the thickness of CL or GDL (Figure S3, Table S2). The highest exchange current density of 1.89 A·m-2 was achieved by the 0.7G0.3C, which was inconsistent with the result of power densities.
3.3 EIS of MFCs
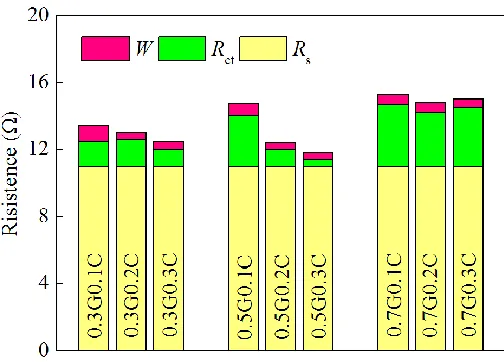
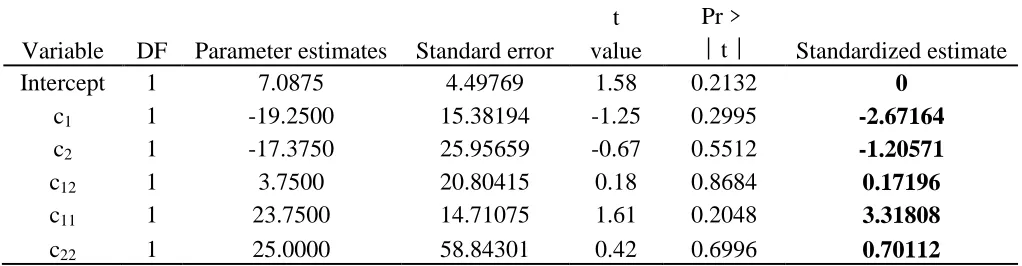
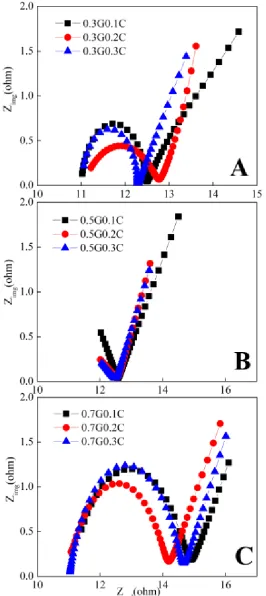
Despite of the similar ohmic resistance (Rs), the charge transfer resistance (Rct) was the dominant part of the total internal resistance (Rin) accounting for a proportion of 49–87% (Figure 3 and Figure S4). The Rct tend to be decreased with the increase of CL thickness except the 0.7G0.3C using the thickest GDL and CL.
[image:6.596.172.424.372.553.2]
Figure 3. Resistances analysis of different air-cathodes at OCP based on EIS.
With the same thickness of GDL, the double layer capacitances (Cdl) of xG0.2C were larger than those of xG0.1C and xG0.3C (Table S3). No obvious trend was observed between the thickness of GDL and the Cdl. The changes of Warburg diffusion impedance (W) in different cathodes were insignificant compared to Rct and Cdl.
4. DISCUSSION
which was consistent with the results that the thickness of the CL had an optimal value [18, 19]. However, different from power densities, the exchange current density increased with the thickness of both GDL and CL, possibly due to the absent of biofilm in LSV tests. This result indicated that a dynamic test such as LSVs could not be transferable to the real performance in MFCs [20].
[image:7.596.58.546.276.416.2]The xG0.2C cathodes exhibited large Cdl and high power densities, suggesting that the high power output may be partly from the large capacitance in double layer, because the capacitance could sustain a high current densities under the same cathodic potential by the transient storage of excess charge [6]. The Rct accounted for 49–87% of Rin and thus significantly affected the power output. Therefore, to reduce the Rct was a feasible approach to improve the performance of MFCs in the future.
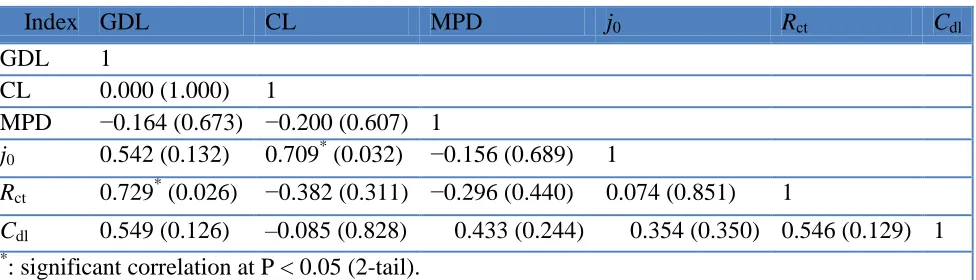
Table 1. Pearson correlation coefficient (significant 2-tail test), n = 9
Index GDL CL MPD j0 Rct Cdl
GDL 1
CL 0.000 (1.000) 1
MPD −0.164 (0.673) −0.200 (0.607) 1
j0 0.542 (0.132) 0.709* (0.032) −0.156 (0.689) 1
Rct 0.729* (0.026) −0.382 (0.311) −0.296 (0.440) 0.074 (0.851) 1
Cdl 0.549 (0.126) –0.085 (0.828) 0.433 (0.244) 0.354 (0.350) 0.546 (0.129) 1 *
[image:7.596.44.555.477.615.2]: significant correlation at P < 0.05 (2-tail).
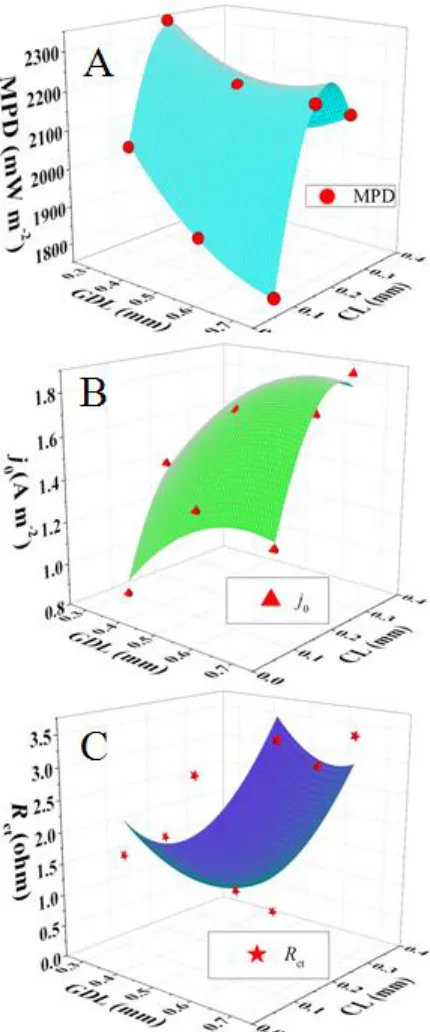
Table 2. Non-linear surface fit parameter for MPD, CL and GDL (n = 9, R = 0.9991).
variable DF parameter estimates standard error t value
Pr﹥ ︱t︱
Standardized estimate
Intercept 1865.11111 49.75098 37.49 ﹤0.0001 0
c1 1 -2534.16667 170.14677 -14.89 0.0007 -2.38238
c2 1 9515.41667 287.11787 33.14 ﹤0.0001 4.47273
c12 1 3962.50000 230.12426 17.22 0.0004 1.23081
c11 1 1408.33333 162.72243 8.65 0.0032 1.33277
c22 1 -25866.66667 650.88970 -39.74 ﹤0.0001 -4.91386 c1: GDL, c2: CL, c12: reciprocal action (GDL and CL), c11: reciprocal action (GDL and GDL), c22: reciprocal action (CL and CL), similarly hereinafter.
[image:8.596.190.405.189.705.2]
statistically significant level (P < 0.05) compared to 0.542 between the thickness of GDL and j0, indicating that the thickness of CL was mainly responsible to the differences in exchange current density, which was consistent with the non-linear surface fitting (3.03726 > 2.39885, Table S4, Figure 4B). The correlation between j0 and the total thickness (GDL + CL) in Figure S5 showed a significant correlation (R = 0.72163, P < 0.05, n = 9), indicating that the total thickness of air-cathode exerted a vital effect on j0.
The Rct positively correlated with the thickness of GDL (P < 0.05) as proved by the non-linear surface fitting (2.67164 > 1.20571, Table S5, Figure 4C), showing the GDL played an important role in Rct. The reason for the influence on Rct by the GDL needs to be investigated in the future. The highest Pearson correlation coefficient (only 0.433, P < 0.05, Table 1) was observed between the MPD and Cdl, suggesting that the MPD was also determined by other factors such as the cathodic microbial community.
5. CONCLUSION
The thickness of CL played a more important role than that of GDL on both the maximum power density in biotic tests and the exchange current density in abiotic measurements according to the correlation analysis. However, the thickness of GDL had a more significant effect on the charge transfer resistance. These results provided more information on the optimization of CL and GDL in AC air-cathodes in the future.
ACKNOWLEDGEMENTS
The authors thank associate professor Wenlu Zeng for help with the data analysis. This research work was financially supported by the Ministry of Science and Technology as an 863 major project (grant No. 2013AA06A205), the National Natural Science Foundation of China as a young scholar project (No. 21107053) and as a key joint project (No. U1133006), the Fundamental Research Funds for the Central Universities, the science and technology supporting of Tianjin as a key project (No. 12ZCZDNC00400) and the Ph.D. Candidate Research Innovation Fund of Nankai University (No. 68140001).
References
1. B. E. Logan, Microbial fuel cells, Wiley-Interscience, New York (2008).
2. K. Rabaey, L. Angenent, U. Schröder and J. Keller, Bio-electrochemical Systems: From
Extracellular Electron Transfer to Biotechnological Application, IWA publishing, London (2010). 3. Z. He, Environmental science & technology, 47 (2012) 332.
4. B. E. Logan, Applied microbiology and biotechnology, 85 (2010) 1665.
5. F. Zhang, T. Saito, S. A. Cheng, M. A. Hickner and B. E. Logan, Environmental science & technology, 44 (2010) 1490.
6. X. J. Li, X. Wang, Y. Y. Zhang, N. Ding and Q. X. Zhou, Applied Energy, 123 (2014) 13. 7. F. Zhao, F. Harnisch, U. Schröder, F. Scholz, P. Bogdanoff and I. Herrmann, Electrochemistry
Communications, 7 (2005) 1405.
8. E. H. Yu, S. A. Cheng, K. Scott and B. Logan, Journal of Power Sources, 171 (2007) 275. 9. X. Wang, Y. J. Feng, H. M. Wang, Y. P. Qu, Y. L. Yu, N. Q. Ren, N. Li, E. Wang, H. Lee and B.
E. Logan, Environmental science & technology, 43 (2009) 6088.
10. S. A. Cheng, H. Liu and B. E. Logan, Environmental science & technology, 40 (2006) 364. 11. W. Z. Li, C. H. Liang, W. J. Zhou, J. S. Qiu, Z. Zhou, G. Q. Sun and Q. Xin, The Journal of
Physical Chemistry B, 107 (2003) 6292.
13. H. Dong, H. B. Yu and X. Wang, Environmental science & technology, 46 (2012) 13009. 14. H. Dong, H. B. Yu, X. Wang, Q. X. Zhou and J. L. Feng, Water Research, 46 (2012) 5777. 15. H. Dong, H. B. Yu, H. Yu, N. S. J. Gao and X. Wang, Journal of Power Sources, 232 (2013) 132. 16. X. Wang, S. A. Cheng, Y. J. Feng, M. D. Merrill, T. Saito and B. E. Logan, Environmental
science & technology, 43 (2009) 6870.
17. D. R. Lovley and E. J. Phillips, Applied and environmental microbiology, 54 (1988) 1472. 18. X. Y. Zhang, J. Shi, P. Liang, J. C. Wei, X. Huang, C. Y. Zhang and B. E. Logan, Bioresource
technology, 142 (2013) 109.
19. B. Wei, J. C. Tokash, G. Chen, M. A. Hickner and B. E. Logan, RSC Advances, 2 (2012) 12751. 20. T. Saito, T. H. Roberts, T. E. Long, B. E. Logan and M. A. Hickner, Energy & Environmental
Science, 4 (2011) 928.
[image:10.596.56.537.334.481.2]Supporting Information:
Table S1 Maximum power density of MFCs using different AC air-cathodes, unit: mW∙m−2.
GDL(mm) CL(mm)
0.1 0.2 0.3
0.3 2037±26 2348±80 2013±133
0.5 1753±78 2201±24 2138±77
0.7 2272±23 2280±11 1543±78
Table S2 Linear fit equations and exchange current densities calculated from the linear region of the Tafel plots.
Air-cathodes Fit linear equation R2 j0 (A∙m-2)
0.3G 0.1C y = 0.40021x - 0.0951 0.96414 0.80
0.2C y = 0.79962x + 0.14236 0.97058 1.39
0.3C y = 0.57045x + 0.14978 0.91662 1.41
0.5G 0.1C y = 1.4408x + 0.11271 0.99392 1.30
0.2C y = 0.88315x + 0.23322 0.97178 1.71
0.3C y = 1.40708x + 0.22173 0.99166 1.67
0.7G 0.1C y = 1.56813x + 0.08627 0.99341 1.22
0.2C y = 1.37044x + 0.2419 0.99323 1.75
[image:10.596.45.556.560.747.2]
Table S3 Rs, Rct,W and capacitance of different air-cathodes at their OCPs.
elememt 0.3G 0.5G 0.7G
0.1C 0.2C 0.3C 0.1C 0.2C 0.3C 0.1C 0.2C 0.3C
Rs(Ω) 11 11 11 11 11 11 11 11 11
Rct(Ω) 1.5 1.6 1.0 3.0 1.0 0.4 3.7 3.2 3.5
W(Ω∙s1/2
) 0.9 0.4 0.5 0.8 0.4 0.4 0.6 0.6 0.5
Cdl(Ω-1∙sn
) ×102.8 -5
8.7 ×10⁻⁴ 1.8 ×10⁻⁵ 2.4 ×10⁻⁵ 5.1 ×10⁻⁴ 5.8 ×10⁻⁵ 8.9 ×10⁻⁴ 1.0 ×10⁻³ 6.2 ×10⁻⁴
[image:11.596.43.555.299.433.2]n 0.9 0.7 1 0.7 0.6 0.8 0.7 0.7 0.8
Table S4 Non-linear surface fit parameters for j0, CL and GDL (n = 9, R = 0.9699) Variable DF Parameter estimates Standard error
t Pr﹥
Standardized estimate value ︱t︱
Intercept 1 -1.16083 0.51369 -2.26 0.1089 0
c1 1 4.65000 1.75681 2.65 0.0772 2.39885
c2 1 11.77500 2.96457 3.97 0.0285 3.03726
c12 1 0.75000 2.37610 0.32 0.7730 0.12784
c11 1 -3.75000 1.68015 -2.23 0.1118 -1.94741
c22 1 -23.50000 6.72062 -3.50 0.0396 -2.44977
Table S5 Non-linear surface fit parameters for Rct, CL and GDL (n = 9, R = 0.8333) Variable DF Parameter estimates Standard error
t Pr﹥
Standardized estimate value ︱t︱
Intercept 1 7.0875 4.49769 1.58 0.2132 0
c1 1 -19.2500 15.38194 -1.25 0.2995 -2.67164
c2 1 -17.3750 25.95659 -0.67 0.5512 -1.20571
c12 1 3.7500 20.80415 0.18 0.8684 0.17196
c11 1 23.7500 14.71075 1.61 0.2048 3.31808
[image:11.596.43.554.490.623.2]
Figure S1 Open circuit voltages and open circuit potentials of MFCs using different AC air-cathodes.
[image:12.596.109.491.315.725.2]
Figure S5 Linear fitting correlation between exchange current density (j0) and the total thickness of air-cathode (TGDL+CL).