Int. J. Electrochem. Sci., 7 (2012) 10008 - 10026
International Journal of
ELECTROCHEMICAL
SCIENCE
www.electrochemsci.org
Influence to the Structure and Dynamics of Hydrated Ca
2+and
Water Molecules in CaCl
2Aqueous Solution Caused by
External AC Electric Field: A Mechanism Study by Molecular
Dynamics Simulation
Yong Han, Yongping Zhao*
School of Electrical Engineering and Automation, Harbin Institute of Technology, 92 West Street, Nan Gang, Harbin 150001, China
*
E-mail: [email protected]
Received: 2 August 2012 / Accepted: 7 September 2012 / Published: 1 October 2012
In the present study systematic long time (1112-2500 ns) non-equilibrium molecular dynamics (MD) simulation have been carried out at the first time to study structural and dynamical properties of hydrated Ca2+ and water molecules in CaCl2 aqueous solutions with an external AC electric field
produced by the electronic anti-fouling (EAF) system. The result of this study can help to understand some mechanism of electronic anti-fouling. Our simulations reveal the change of structure and dynamics of hydrated Ca2+ and water molecules under external AC electric field with different frequencies and amplitude values respectively. Within the range of electric field frequencies and amplitude values in this paper, it was found that radius of the hydrated Ca2+ changed smaller. Under the electric field of 400 KHz and 70 v/m, the radius of the hydrated Ca2+ had the smallest value. All electric field with different frequencies or amplitude values in our range could make the Ca2+–water coordination number from 4 to 5 for the first water shell, but almost no influence to the second water shell. Self-diffusion coefficient of Ca2+ and water molecule changed larger under the external AC electric field. Under the electric field of 400 KHz and 70 v/m, the self-diffusion coefficient of Ca2+ had the biggest value. It was also found that changing electric field amplitude values was more effectively to increase the self-diffusion coefficient of water molecule than changing electric field frequencies.
Keywords: molecular dynamics; AC electric field; CaCl2 aqueous solution; coordination number;
self-diffusion coefficient
1. INTRODUCTION
field water treatment system to the scale problem. But the anti-fouling mechanism of EAF system is still not all clear as yet. Cho et al. [1] supposed that the induced alternate electric field in the aqueous solution generated by the excitation coil was the leading role to achieve the purpose of anti-fouling. The induced alternate electric field changes the crystallization process of scale and stops precipitate sticking to the water wall. There are many researchers do a lot of experiment researches based on the above-mentioned anti-fouling mechanism of EAF system [2-6]. But the results are always quite different, even opposite because of the different experiment conditions.
At the present stage experiment researches on mechanism of EAF system almost focus on calcium carbonate (magnesium sulfate) crystallization process or the change of scale crystal structure [7-8], but ignore the influence to the change of microcosmic particles structure in the aqueous solutions by AC electric field. Actually, when EAF system is working, there are almost no scale-forming negative ions because of the very low solubility of calcium carbonate (magnesium sulfate). Ca2+ (Mg2+) exists in the aqueous solution as hydrated ion, and the hydrated Ca2+ (Mg2+) is also combined with other water molecules by hydrogen bonding. Therefore, the study of hydrated Ca2+ (Mg2+) is a very important part of the calcium (magnesium) ion solution property research [9-14]. When AC electric field is applied to the aqueous solution, the structure of hydrated Ca2+ (Mg2+) cluster and water cluster will get some inevitable changes. Furthermore, these changes will impact the crystallization process of scale. Therefore, the research of influence to the structure and dynamics of hydrated Ca2+ and water molecules by AC electric field is very important to the study of anti-fouling mechanism of EAF system.
Various methods have been used to study the microstructure and dynamics properties. Among these methods, molecular dynamics simulation has been proven to be one of the most useful tools for elucidating all kinds of detailed microscopic properties of aqueous solutions. On one hand, this kind of simulations is convenient to do a real-time study to the structure and properties of particles in aqueous solutions, which can avoid the error taken from sampling and detection process. On the other hand, the results from molecular dynamics simulations are more convenient in comparing to experimental results under wide range of concentrations, temperatures and pressures.
In the present study, CaCl2 aqueous solution has be taken as the research object.
Non-equilibrium MD simulation is used to study the change of location of the first water shell of Ca2+, the first coordination numbers for Ca2+, location of the second water shell of Ca2+, the second coordination numbers for Ca2+, self-diffusion coefficient of Ca2+ and water molecular under external AC electric field with different frequencies and amplitude, and the influence to the crystallization process of scale caused by the changes of these parameters is researched. The results of present study do not only supply a theoretical basis for the research of anti-fouling mechanism of EAF system, but also provide a theoretical guidance for optimization of EAF system in application.
2. SIMULATION DETAILS
2.1. AC electric field wave form and parameters selection
2.1.1. AC electric field wave form selection
The wave form of excitation current signal produced by EAF system is sinusoid, and the induced electric field in aqueous solution also changes as sinusoid [15]. Therefore, in the MD simulation the external AC electric field wave form should be sinusoid.
2.1.2. AC electric field frequency selection
The induced electric field frequency should be equal to the excitation current signal frequency [15]. In practical application the frequency range of excitation current signal produced by EAF system is from several tens KHz to 1MHz. For the purpose of studying the influence to CaCl2 aqueous
solution caused by electric field with different frequency and controlling the MD simulation time within a acceptable range, the external AC electric field frequencies in the present study are chosen as 400 KHz, 500 KHz, 600 KHz, 700 KHz, 800 KHz, 900 KHz。
2.1.3. AC electric field amplitude selection
In practical application the amplitude range of excitation current signal produced by EAF system is from several A to several tens A, and the corresponding induced electric field amplitude is from several tens v/m to 200 v/m. For the purpose of studying the influence to CaCl2 aqueous solution
caused by electric field with different amplitude, the external AC electric field amplitudes used in our simulation are chosen as 10v/m, 30v/m, 50v/m, 70v/m, 90v/m, 120v/m, 150v/m.
When researching the influence to CaCl2 aqueous solution caused by electric field with
different frequency, the AC electric field amplitude is a constant 10v/m, and the simulation time is a constant 2500ns when the electric field frequency is changed. 2500ns is a cycle time of a signal with 400 KHz frequency. When researching the influence by electric field with different amplitude, the AC electric field frequency is a constant 900 KHz, and the simulation time is a constant 1112ns when the electric field amplitude is changed. 1112ns is a cycle time of a signal with 900 KHz frequency.
2.2. Simulation details
In the present study, the MD simulation in our work is a non-equilibrium MD simulation process because of the external AC electric field applied on the CaCl2 aqueous solution. The MD
simulations were performed with the software GROMACS 4.5.4 [16]. NPT ensemble is used to perform MD simulations. Temperatures of all simulations were set as 300K. The simulation system consists of a 1.6nm×1.6nm×1.8nm box containing 8 Ca2+
, 16 Cl- and 111 water molecules. SPCE model is used as water model [17-18]. The CaCl2 aqueous solution concentration is 4mol·kg-1, and the
with the particle mesh Ewald (PME) [21]method and a real space cutoff of 0.7 nm. The time step of all the simulations was set as 2.0 fs [19].
3. RESULTS AND DISCUSSIONS
All structural parameters in our study can be classified into two categories: (1) average radii (R) of the first or second shell, including RCa–O, RIICa-O;(2) coordination number (n), including nCa–O,
nIICa-O. Dynamic parameter in our study is Self-diffusion coefficient (D), including DCa, DO. R and n
are defined according to radial distribution function [g(r)], and D is defined according to the ‘Einstein relation’ [22].
3.1. Verification for correctness of our MD simulations
For verifying the correctness of our MD simulations, in the present study we calculate structural parameters and dynamic parameter of CaCl2 aqueous solution without external AC electric
field. CaCl2 aqueous solution concentration is 4mol·kg-1. The results are compared with the results
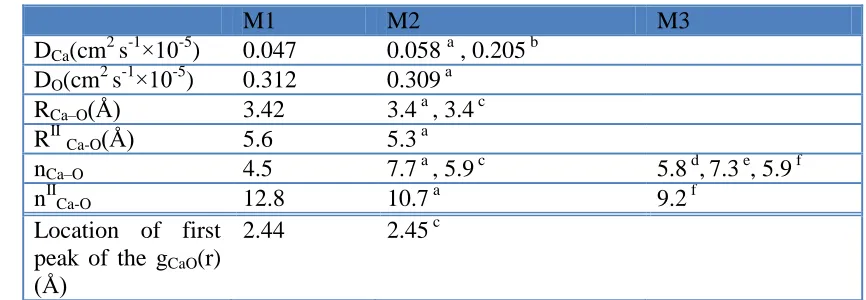
[image:4.596.77.510.438.588.2]from experiment and other references. The comparison is shown in Table 1.
Table 1. Simulation results from our work comparing with other simulation method and experiment
M1 M2 M3
DCa(cm2 s-1×10⁻⁵) 0.047 0.058 a , 0.205 b
DO(cm2 s-1×10⁻⁵) 0.312 0.309 a
RCa–O(Å) 3.42 3.4 a , 3.4 c
RIICa-O(Å) 5.6 5.3 a
nCa–O 4.5 7.7 a , 5.9 c 5.8 d,7.3 e, 5.9 f
nIICa-O 12.8 10.7 a 9.2 f
Location of first peak of the gCaO(r)
(Å)
2.44 2.45 c
Note: M1 is from our work, M2 is the result by other simulate method, M3 is from experiments.
a
From ref.[19],by MD simulation; b from ref.[23] using tracer method; c from ref.[24] using MD simulation;
d
from ref.[25] using X-ray; e from ref.[26]using ND; f from ref.[27] using X-ray.
It can be known from Table 1 that the results of DCa , DO , RCa–O, RIICa-O and gCaO(r) from our
work are close to the results from other references. But nCa–O , nIICa-O from our work are a little larger
equals to 50% particles quantity of simulation system in ref. [19] under the same solution concentration. Moreover, in our work the water model is SPCE model, but the other references are not. Using different water model can make errors. For example, a slight revision to charge in the model from SPC to SPCE can make self-diffusion coefficients sharply decreasing [29]. (b) nIICa-O from our
work is larger than the results from ref. [19] and X-ray experiment. It is because that the RIICa-O from
our work is larger, which leads to a larger nIICa-O.
According to the compare above, our MD simulation method is verified to be reliable, and it can be used to study the properties of CaCl2 aqueous solution with external AC electric field. In the
following, the change of the parameters value which is caused by external AC electric field will be discussed on the basis of the result from our MD simulation in Table 1.
3.2. Structure parameters under different AC electric field
In this section, the values of RCa–O, RIICa-O, nCa–O , nIICa-O, which can be obtained from radial
distribution function [g(r)], are discussed under AC electric field with frequency 400KHz, 500 KHz, 600 KHz, 700 KHz, 800 KHz, 900 KHz and with amplitude 10v/m、30v/m、50v/m、70v/m、90v/m 、120v/m、150v/m respectively. The expression of radial distribution function is shown as Eq. (1)
[30]:
2
( ) ( )
( )
1 1
4 A B
B AB
B local
N N ij i A j B B local A
r
g r
r r
N r
(1)
Where NA is the quantity of particle A, and NB is the quantity of particle B; 〈ρB(r) 〉is the
particle density of particle B at a distance r around particles A, and 〈ρB〉local is the particle density of
particle B averaged over all spheres around particles A with radius rmax. Usually the value of rmax is
half of the minimum length of box.
The values of nCa–O and nIICa-O are calculated using Eq. (2) [24]:
2 0
( ) 4 rs ( )
O
Ca s O CaO
n r
g r r dr (2)When calculating nCa–O, rs is the location of the first local minimum of gCaO(r). When
calculating nIICa-O, rs is the location of the second local minimum of gCaO(r).
Since all of the electric field force applied to CaCl2 aqueous solution by different AC electric
2500000 ps, when the AC electric field frequency is 400KHz, then the 1/4 cycle of AC electric field is 625000 ps, and the whole simulation time is divided into 4 pieces; when the AC electric field frequency is 500KHz, then the 1/4 cycle of AC electric field is 500000 ps, and the whole simulation time is divided into 5 pieces.
The results of RCa–O and RIICa-O under AC electric field with different frequency are shown in
[image:6.596.62.536.235.385.2]Table 2 and Table 3, the corresponding graphs are shown in Figureure. 1. and Figureure. 2.
Table 2. Radii of the first water shell under AC electric field with different frequency
RCa–O(Å)
frequenc y (KHz)
Time piece 1
Time piece 2
Time piece 3
Time piece 4
Time piece 5
Time piece 6
Time piece 7
Time piece 8
Time piece 9
Avera ge value
400 3.20 3.20 3.20 3.18 3.19
500 3.24 3.28 3.28 3.28 3.42 3.30
600 3.34 3.36 3.26 3.32 3.12 3.30 3.28
700 3.43 3.24 3.17 3.29 3.12 3.43 3.24 3.27
800 3.48 3.26 3.28 3.28 3.36 3.30 3.22 3.28 3.31
[image:6.596.64.534.444.593.2]900 3.28 3.34 3.22 3.38 3.34 3.28 3.32 3.32 3.36 3.32
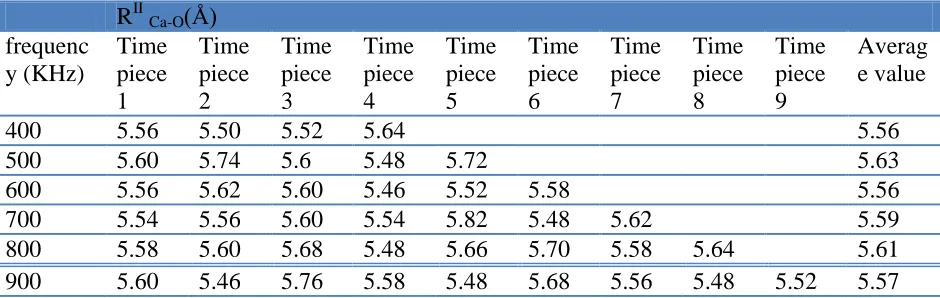
Table 3. Radii of the second water shell under AC electric field with different frequency
RIICa-O(Å)
frequenc y (KHz)
Time piece 1
Time piece 2
Time piece 3
Time piece 4
Time piece 5
Time piece 6
Time piece 7
Time piece 8
Time piece 9
Averag e value
400 5.56 5.50 5.52 5.64 5.56
500 5.60 5.74 5.6 5.48 5.72 5.63
600 5.56 5.62 5.60 5.46 5.52 5.58 5.56
700 5.54 5.56 5.60 5.54 5.82 5.48 5.62 5.59
800 5.58 5.60 5.68 5.48 5.66 5.70 5.58 5.64 5.61
900 5.60 5.46 5.76 5.58 5.48 5.68 5.56 5.48 5.52 5.57
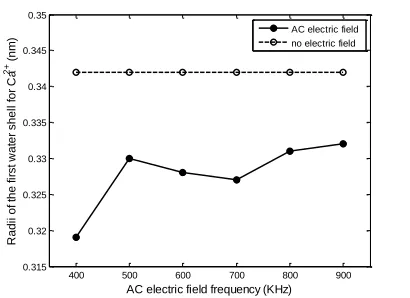
According to Table 2 and Figure.1, it is known that: 1 For every frequency, great majority of the RCa–O value at the end of time pieces is smaller than 3.42 Å — the RCa–O value obtained under no
electric field. 2 Radii of the first water shell RCa–O is also the radii of hydrated Ca2+. It can be known
that under the AC electric field with different frequencies the RCa–O value does not change regularly
during MD simulation process. When the AC electric field frequency is 400KHz, the average RCa–O
value has the minimum 3.19 Å. When the AC electric field frequency is 900KHz, the average RCa–O
400 500 600 700 800 900 0.315
0.32 0.325 0.33 0.335 0.34 0.345 0.35
AC electric field frequency (KHz)
R
a
d
ii
o
f
th
e
f
ir
st
w
a
te
r
sh
e
ll
f
o
r
C
a
2
+ (
n
m
) AC electric field
[image:7.596.197.402.75.224.2]no electric field
Figure 1. Average RCa–O value under AC electric field with different frequency
400 500 600 700 800 900 0.55
0.552 0.554 0.556 0.558 0.56 0.562 0.564 0.566 0.568
AC electric field frequency (KHz)
R
a
d
ii
o
f
th
e
se
co
n
d
w
a
te
r
sh
e
ll
f
o
r
C
a
2
+ (
n
m
) AC electric field
[image:7.596.196.403.293.440.2]no electric field
Figure 2. Average RIICa-O value under AC electric field with different frequency
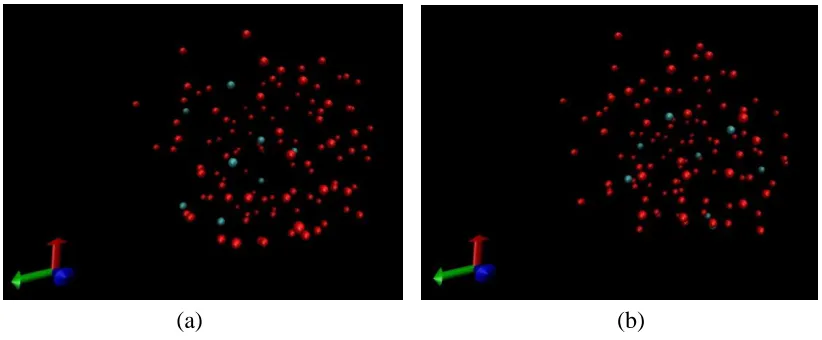
Figure 3 shows the distribution of Ca2+ and water molecule before and after MD simulation under the AC electric field with 400 KHz frequency. In Figure 3, the cyan atoms are Ca2+ and the red ones are oxygen atoms, which stand for water molecules. The hydrogen atoms are leaved out for making it easy to observe the change of the water molecules number around Ca2+ after MD simulation. The two pictures of Figure 3 show that the water molecules are more close to Ca2+ after the MD simulation. In other word, the radii of hydrated Ca2+ changes smaller. The effective radius of water molecule is 1.38 Å, and the distance between Ca2+
ref. [3] and ref. [32]. More calcium carbonate precipitate is formed in solution instead of being formed on the water wall, and the precipitate in solution will be washed away by running water. Then the scale problem can be prevented. Therefore, making the radii of hydrated Ca2+ smaller is an important point of the mechanism of electronic anti-fouling. In the present study, within the range of AC electric field frequency, the radii of hydrated Ca2+ has the minimum value when external AC electric field frequency is 400 KHz, which means that using AC electric field with 400 KHz frequency can make the best anti-fouling effect.
[image:8.596.93.504.215.385.2]
(a) (b)
Figure 3. The distribution of Ca2+ and water molecule before and after MD simulation (a) before MD
simulation.(b) after MD simulation
According to Table 3 and Figure 2, it is known that most of the RIICa-O values obtained under
external AC electric field with different frequency are very close to 5.6Å, which has no obvious change according to the RII Ca-O value obtained under no external AC electric field. Therefore, it is
supposed that the external AC electric field with different frequency almost has no influence to the location of the second water shell of Ca2+.
The results of nCa–O and nIICa-O under AC electric field with different frequency are shown in
[image:8.596.85.516.630.767.2]Table 4 and Table 5, the corresponding graphs are shown in Figure 4 and Figure 5.
Table 4. First water coordination number for Ca2+ under AC electric field with different frequency
nCa–O
frequenc y (KHz)
Time piece 1
Time piece 2
Time piece 3
Time piece 4
Time piece 5
Time piece 6
Time piece 7
Time piece 8
Time piece 9
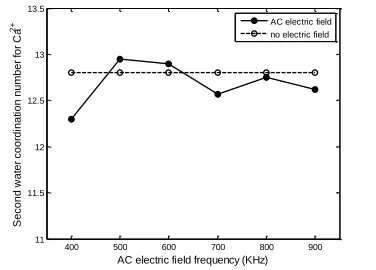
Table 5. Second water coordination number for Ca2+ under AC electric field with different frequency
nIICa-O
frequenc y (KHz) Time piece 1 Time piece 2 Time piece 3 Time piece 4 Time piece 5 Time piece 6 Time piece 7 Time piece 8 Time piece 9 Averag e value
400 12.32 11.84 11.99 13.03 12.30
500 12.68 13.95 12.72 11.66 13.73 12.95
600 12.68 13.95 12.72 11.66 13.73 12.68 12.90
700 12.20 12.42 12.70 12.18 14.71 11.66 12.13 12.57
800 12.46 12.70 13.41 11.64 13.20 13.55 12.48 12.54 12.75 900 12.67 11.43 14.15 12.52 11.65 13.36 13.23 11.64 12.85 12.62
400 500 600 700 800 900 4.4 4.6 4.8 5 5.2 5.4 5.6 5.8 6 6.2 6.4
AC electric field frequency (KHz)
F ir st w a te r co o rd in a ti o n n u m b e r fo r C a 2 +
AC electric field no electric field
Figure 4. Average nCa–O value under AC electric field with different frequency
400 500 600 700 800 900 11 11.5 12 12.5 13 13.5
AC electric field frequency (KHz)
S e co n d w a te r co o rd in a ti o n n u m b e r fo r C a 2
+ AC electric field no electric field
Figure 5. Average nIICa-O value under AC electric field with different frequency
According to Table 4 and Figure 4, it is known that the nCa–O value do not fluctuate obviously
during the MD simulation process, and in every time piece the nCa–O value is larger than the value 4.5
under no electric field. The average nCa–O value under the electric field with different frequency is
[image:9.596.205.393.496.631.2]
and the average nCa–O value has the minimum 5.67 when the electric field frequency is 900 KHz. All
average nCa–O value in Table 4 have about 1 larger than 4.5, which means that the AC electric field
makes the first water coordination number for Ca2+ increased 1.
The more first water coordination number for Ca2+ is also caused by the enhanced hydration between Ca2+ and water molecules. The enhanced electrostatic interaction does not only make hydrated water molecules more close to Ca2+, but also attract one more water molecules as hydrated water molecule. The increase of the first water coordination number for Ca2+ enhances the inhibition to carbonate ions, which seems inconsistent against above conclusion that external AC electric field increases the probability of forming calcium carbonate precipitate. Actually, electrostatic interaction is a kind of physical interaction, and during the Ca2+ and carbonate ion are associating the interaction between them is chemical interaction. Therefore, the enhancement of chemical interaction caused by reducing the distance between Ca2+ and carbonate ion is too much stronger than the inhibition to carbonate ion caused by enhancing electrostatic interaction.
[image:10.596.102.495.352.504.2]
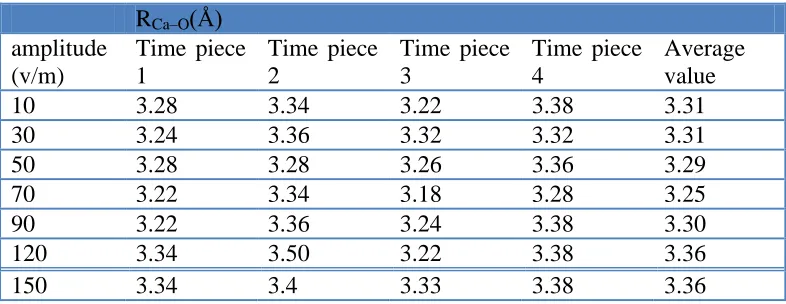
Table 6. Radii of the first water shell under AC electric field with different amplitude
RCa–O(Å)
amplitude (v/m)
Time piece 1
Time piece 2
Time piece 3
Time piece 4
Average value
10 3.28 3.34 3.22 3.38 3.31
30 3.24 3.36 3.32 3.32 3.31
50 3.28 3.28 3.26 3.36 3.29
70 3.22 3.34 3.18 3.28 3.25
90 3.22 3.36 3.24 3.38 3.30
120 3.34 3.50 3.22 3.38 3.36
150 3.34 3.4 3.33 3.38 3.36
Table 7. Radii of the second water shell under AC electric field with different amplitude
RIICa-O(Å)
amplitude (v/m)
Time piece 1
Time piece 2
Time piece 3
Time piece 4
Average value
10 5.60 5.46 5.76 5.58 5.60
30 5.6 5.68 5.48 5.72 5.62
50 5.64 5.58 5.50 5.48 5.55
70 5.72 5.54 5.54 5.62 5.61
90 5.70 5.58 5.66 5.70 5.66
120 5.56 5.52 5.46 5.64 5.55
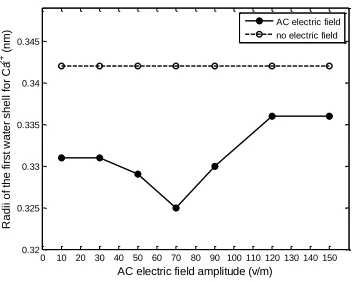
[image:10.596.103.496.562.714.2]
0 10 20 30 40 50 60 70 80 90 100 110 120 130 140 150 0.32
0.325 0.33 0.335 0.34 0.345
AC electric field amplitude (v/m)
R
a
d
ii
o
f
th
e
f
ir
st
w
a
te
r
sh
e
ll
f
o
r
C
a
2
+ (
n
m
[image:11.596.204.381.78.219.2]) AC electric fieldno electric field
Figure 6. Average RCa–O value under AC electric field with different amplitude
0 10 20 30 40 50 60 70 80 90 100 110 120 130 140 150 160 0.545
0.55 0.555 0.56 0.565 0.57
AC electric field amplitude (v/m)
R
a
d
ii
o
f
th
e
se
co
n
d
w
a
te
r
sh
e
ll
f
o
r
C
a
2
+ (
n
m
[image:11.596.203.381.285.424.2]) AC electric field no electric field
Figure 7. Average RIICa-O value under AC electric field with different amplitude
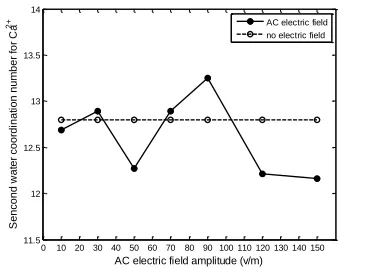
According to Table 5 and Figure 5, it is known that most of the nIICa-O values obtained under
external AC electric field with different frequency are very close to 12.8, which have no obvious change according to the nIICa-O value obtained under no external AC electric field. Therefore, it is
supposed that the external AC electric field with different frequency almost has no influence to the second water coordination number for Ca2+.
The results of RCa–O and RIICa-O under AC electric field with different amplitude are shown in
Table 6 and Table 7, the corresponding graphs are shown in Figure 6 and Figure 7.
According to Table 6 and Figure.6, it is known that: 1 For every amplitude, great majority of the RCa–O value at the end of time pieces is smaller than the RCa–O value obtained under no electric
field. It can be known that under the AC electric field with amplitude 70v/m, 90v/m and 120v/m the RCa–O value is up and down regularly as the frequency of the AC electric field during MD simulation
process. The average RCa–O values are decrease and then increase with amplitude of AC electric field
increasing. When the AC electric field amplitude is 70 v/m, the average RCa–O value has the minimum
3.25 Å. When the AC electric field amplitude is 150 v/m, the average RCa–O value has the maximum
According to Table 7 and Figure 7, it is known that under external AC electric field with different amplitude most of the RIICa-O values are very close to 5.6, which have no obvious change
according to the nIICa-O value obtained under no external AC electric field. Therefore, it is supposed
that the external AC electric field with different amplitude almost has no influence to the second water coordination number for Ca2+.
The results of nCa–O and nIICa-O under AC electric field with different amplitude are shown in
[image:12.596.102.501.247.396.2]Table 8 and Table 9, the corresponding graphs are shown in Figure 8 and Figure 9.
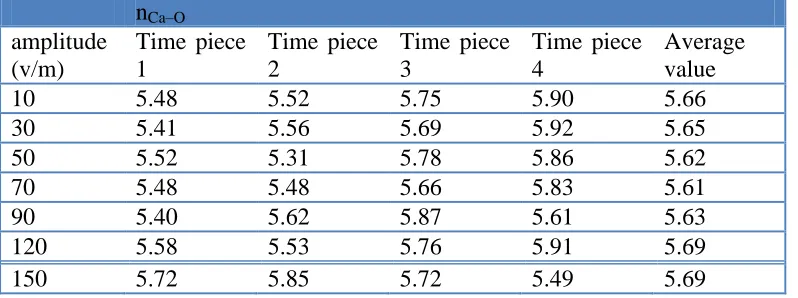
Table 8. First water coordination number for Ca2+ under AC electric field with different amplitude
nCa–O
amplitude (v/m)
Time piece 1
Time piece 2
Time piece 3
Time piece 4
Average value
10 5.48 5.52 5.75 5.90 5.66
30 5.41 5.56 5.69 5.92 5.65
50 5.52 5.31 5.78 5.86 5.62
70 5.48 5.48 5.66 5.83 5.61
90 5.40 5.62 5.87 5.61 5.63
120 5.58 5.53 5.76 5.91 5.69
[image:12.596.101.496.455.606.2]150 5.72 5.85 5.72 5.49 5.69
Table 9. Second water coordination number for Ca2+ under AC electric field with different amplitude
nIICa-O
amplitude (v/m)
Time piece 1
Time piece 2
Time piece 3
Time piece 4
Average value
10 12.67 11.43 14.15 12.52 12.69
30 12.69 13.39 11.68 13.78 12.89
50 13.09 12.52 11.82 11.66 12.27
70 13.77 12.17 12.75 12.88 12.89
90 13.67 12.51 13.18 13.66 13.25
120 12.36 11.93 11.53 13.01 12.21
150 11.80 11.82 12.55 12.47 12.16
According to Table 8 and Figure 8, it is known that in every time piece the nCa–O value is larger
than the value 4.5 under no electric field. The average nCa–O value under the electric field with different
amplitude is similar. The average nCa–O value has the maximum 5.69 when the electric field amplitude
is 150v/m, and the average nCa–O value has the minimum 5.61 when the electric field amplitude is
70v/m. All average nCa–O value in Table 8 has about 1 larger than 4.5.
According to Table 9 and Figure 9, it is known that most of the nIICa-O values obtained is very
0 10 20 30 40 50 60 70 80 90 100 110 120 130 140 150 4.2
4.4 4.6 4.8 5 5.2 5.4 5.6 5.8 6 6.2
AC electric field amplitude (v/m)
F
ir
st
w
a
te
r
co
o
rd
in
a
ti
o
n
n
u
m
b
e
r
fo
r
C
a
2
+
[image:13.596.207.392.73.213.2]AC electric field no electric field
Figure 8. Average nCa–O value under AC electric field with different amplitude
0 10 20 30 40 50 60 70 80 90 100 110 120 130 140 150 11.5
12 12.5 13 13.5 14
AC electric field amplitude (v/m)
S
e
n
co
n
d
w
a
te
r
co
o
rd
in
a
ti
o
n
n
u
m
b
e
r
fo
r
C
a
2
+ AC electric field no electric field
Figure 9. Average nIICa-O value under AC electric field with different amplitude
3.3. Dynamics parameters under different AC electric field
Self-diffusion coefficient of Ca2+ and water molecular in CaCl2 aqueous solution as an
important dynamic property was experimentally measured by quasi-elastic neutron scattering and NMR measurements [33]. However, these experiments are involved in great uncertainties.
In the present study, our calculation of self-diffusion coefficient is based on the‘Einstein relation’ [22]:
2
1
lim [ ( ) (0)]
6 i i
t
D r t r
t
(3)
Where ri (t) is the molecular position i at time t and ri (0) is the initial position, the bracket
denotes ensemble average.
The results of DCa and DO under AC electric field with different amplitude are shown in Table
[image:13.596.207.392.280.415.2]
Table 10. Self-diffusion coefficient of Ca2+ under AC electric field with different frequency
DCa(cm2 s-1×10⁻⁵)
frequenc y (KHz)
Time piece 1
Time piece 2
Time piece 3
Time piece 4
Time piece 5
Time piece 6
Time piece 7
Time piece 8
Time piece 9
Averag e value
400 0.125 0.102 0.272 0.122 0.155
500 0.086 0.063 0.069 0.077 0.104 0.080
600 0.163 0.129 0.085 0.091 0.113 0.143 0.121
700 0.168 0.105 0.159 0.105 0.148 0.076 0.113 0.125
800 0.122 0.105 0.166 0.095 0.132 0.088 0.084 0.095 0.111
[image:14.596.85.510.292.419.2]900 0.089 0.098 0.106 0.154 0.162 0.055 0.104 0.117 0.096 0.099
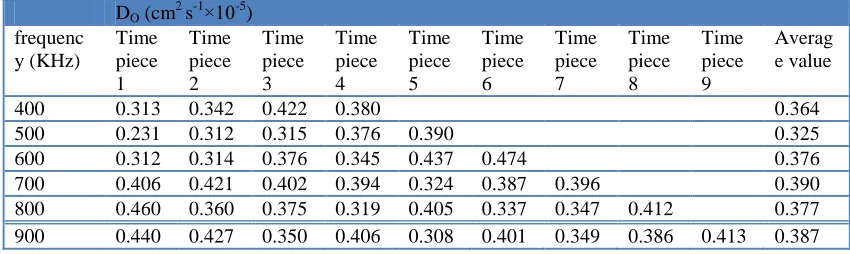
Table 11. Self-diffusion coefficient of water molecule under AC electric field with different frequency
DO (cm2 s-1×10⁻⁵)
frequenc y (KHz)
Time piece 1
Time piece 2
Time piece 3
Time piece 4
Time piece 5
Time piece 6
Time piece 7
Time piece 8
Time piece 9
Averag e value
400 0.313 0.342 0.422 0.380 0.364
500 0.231 0.312 0.315 0.376 0.390 0.325
600 0.312 0.314 0.376 0.345 0.437 0.474 0.376
700 0.406 0.421 0.402 0.394 0.324 0.387 0.396 0.390
800 0.460 0.360 0.375 0.319 0.405 0.337 0.347 0.412 0.377
900 0.440 0.427 0.350 0.406 0.308 0.401 0.349 0.386 0.413 0.387
According to Table 10 and Figure 10, it is known that in every time piece the DCa value is
larger than the value 0.047 cm2 s-1×10⁻⁵ under no electric field. The average DCa value has the
maximum 0.155 cm2 s-1×10⁻⁵ when the electric field frequency is 400 KHz, and the average DCa value
has the minimum 0.080 cm2 s-1×10⁻⁵ when the electric field frequency is 500KHz. It is known from Table 11 and Figure.11 that DO value in every time piece is larger than the value 0.312 cm2 s-1×10⁻⁵
which is obtained under no electric field. The average DCa value has the maximum 0.390 cm2 s-1×10⁻⁵
when the electric field frequency is 700 KHz, and the average DCa value has the minimum 0.325 cm2 s
-1×10⁻⁵
when the electric field frequency is 500 KHz.
Self-diffusion coefficient is an important dynamics parameter of CaCl2 aqueous solution. The
easily. Therefore making the self-diffusion coefficient of Ca2+ and water molecules larger is the other important point of the mechanism of electronic anti-fouling.
400 500 600 700 800 900 0.04
0.06 0.08 0.1 0.12 0.14 0.16
AC electric field frequency (KHz)
S
e
lf
-d
if
fu
si
o
n
co
e
ff
ici
e
n
t
o
f
C
a
2
+(cm 2 s -1×
1
0
[image:15.596.197.402.137.286.2]-5) AC electric field no electric field
Figure 10. Average DCa value under AC electric field with different frequency
400 500 600 700 800 900 0.3
0.32 0.34 0.36 0.38 0.4 0.42
AC electric field frequency (KHz)
S
e
lf
-d
if
fu
si
o
n
co
e
ff
ici
e
n
t
o
f
w
a
te
r
m
o
le
cu
le
(
cm
2 s -1×
1
0
-5)
AC electric field no electric field
Figure 11. Average DO value under AC electric field with different frequency
In addition, according to Stokes-Einstein equation, self-diffusion coefficient of particle is inversely proportional to particle radii. Stokes-Einstein equation is shown as Eq. (4).
( )
3
kT d H
D
(4)
[image:15.596.200.383.345.490.2][image:16.596.102.489.136.305.2]
Ca2+ radii meet exactly with Stokes-Einstein equation. The graphs of average value in Table 2 and Table 10 changing with time are shown in Figure 12.
400 450 500 550 600 650 700 750 800 850 900 0.318 0.32 0.322 0.324 0.326 0.328 0.33 0.332 0.334
Alternating electric field frequency (KHz)
Th e f ir s t w a te s h e ll lo c a ti o n o f c a lc iu m i o n (n m )
400 450 500 550 600 650 700 750 800 850 900 0.08 0.09 0.1 0.11 0.12 0.13 0.14 0.15 0.16
Alternating electric field frequency (KHz)
Th e s e lf -d if fu s io n o f c a lc iu m i o n ( c m
2 s -1×
1
0
-5)
(a) (b)
Figure 12. Comparison between the changes of hydrated Ca2+ radii and self-diffusion coefficient of
[image:16.596.102.497.405.558.2]Ca2+ (a) change of hydrated Ca2+ radii (b) change of self-diffusion coefficient of Ca2+
Table 12. Self-diffusion coefficient of Ca2+ under AC electric field with different amplitude
DCa(cm2 s-1×10⁻⁵)
amplitude (v/m)
Time piece 1
Time piece 2
Time piece 3
Time piece 4
Average value
10 0.096 0.104 0.114 0.160 0.119
30 0.092 0.115 0.130 0.093 0.106
50 0.183 0.149 0.095 0.133 0.140
70 0.092 0.136 0.094 0.241 0.141
90 0.208 0.079 0.105 0.073 0.116
120 0.087 0.071 0.198 0.079 0.109
[image:16.596.103.498.618.769.2]150 0.088 0.135 0.076 0.053 0.088
Table 13. Self-diffusion coefficient of water molecule under AC electric field with different amplitude
DO(cm2 s-1×10⁻⁵)
amplitude (v/m)
Time piece 1
Time piece 2
Time piece 3
Time piece 4
Average value
10 0.440 0.427 0.350 0.406 0.406
30 0.519 0.654 0.555 0.536 0.566
50 0.639 0. 435 0.538 0.565 0.544
70 0.580 0.495 0.481 0.459 0.504
90 0.610 0.485 0.502 0.491 0.522
120 0.649 0.539 0.566 0.437 0.548
The results of DCa and DO under AC electric field with different amplitude are shown in Table
12 and Table 13, the corresponding graphs are shown in Figure 13 and Figure 14.
0 10 20 30 40 50 60 70 80 90 100 110 120 130 140 150 160 0.04
0.06 0.08 0.1 0.12 0.14 0.16
AC electric field amplitude (v/m)
S
e
lf
-d
if
fu
si
o
n
co
e
ff
ici
e
n
t
o
f
C
a
2
+(cm 2 s -1×
1
0
-5) AC electric field
[image:17.596.204.384.138.281.2]no electric field
Figure 13. Average DCa value under AC electric field with different amplitude
0 10 20 30 40 50 60 70 80 90 100 110 120 130 140 150 160 0.25
0.3 0.35 0.4 0.45 0.5 0.55 0.6 0.65 0.7
AC electric field amplitude (v/m)
S
e
lf
-d
if
fu
si
o
n
co
e
ff
ici
e
n
t
o
f
w
a
te
r
m
o
le
cu
le
(
cm
2 s -1×
1
0
-5 )
AC electric field no electric field
Figure 14. Average DO value under AC electric field with different amplitude
According to Table 12 and Figure 13, in every time pieces the DCa value is larger than the value
0.047 cm2 s-1×10⁻⁵ under no electric field. It also can be known that under the AC electric field with amplitude 70v/m, 90v/m and 120v/m the DCa value is up and down regularly as the frequency of the
AC electric field during MD simulation process. The average DCa value has the maximum 0.141 cm2 s
-1×10⁻⁵
when the electric field amplitude is 70v/m, and the average DCa value has the minimum 0.088
cm2 s-1×10⁻⁵ when the electric field amplitude is 150v/m. Therefore, within the present electric field amplitude range, the DCa value changes steady and the average DCa value is biggest when the AC
electric field amplitude is 70v/m, which means that using AC electric field with 70v/m amplitude can make the best anti-fouling effect. This result meets exactly with the conclusion obtained in Part B of Sec. III.
According to Table 13 and Figure.14, it is known that in every time piece the DO value is larger
than the value 0.312 cm2 s-1×10⁻⁵ under no electric field. The average DO value has the maximum 0.566
[image:17.596.208.383.336.480.2]
0.406 cm2 s-1×10⁻⁵ when the electric field amplitude is 10v/m. Under the AC electric field with amplitude 70v/m, 90v/m and 120v/m, the DO value is up and down regularly as the frequency of the
AC electric field. It also can be known that the average DO value curve is a multi-extreme curve. When
the electric field amplitude is 30v/m, 50v/m, 120 v/m and 150v/m, the average DO value is larger.
An important result is obtained by comparing Table 10 with Table 13 that the increment of DO
value under AC electric field with different amplitude is larger than the increment under AC electric field with different frequency, which means increasing electric field amplitude is more effective to enhance the self-diffusion coefficient of water molecule than increasing electric field frequency. In other word, increasing electric field amplitude can make better anti-fouling effect.
4. CONCLUSION
For exploring the mechanism of electronic anti-fouling, in the present study the structure and dynamics of hydrated Ca2+ and water molecules in CaCl2 aqueous solution under external AC electric
field with different frequency and amplitude are researched at first time by systematic long time non-equilibrium molecular dynamics simulation. Within the range of the electric field frequency and amplitude in this paper, some important conclusions obtained as follow that under external AC electric field with different frequency and amplitude:
(1) the radii of hydrated Ca2+ is smaller than the radii under no external electric field. When the AC electric field frequency is 400KHz and amplitude is 70v/m, the radii of hydrated Ca2+ has the minimum. The smaller radii of hydrated Ca2+ means that the hydration between Ca2+ and water molecules is enhanced by external AC electric field. When there are carbonate ions appearing in the CaCl2 aqueous solution, a hydrated Ca2+ with smaller radii can more easily combine with carbonate ion
and form calcium carbonate precipitate. Then the precipitate formed on the water wall is decreased. Therefore making the radii of hydrated Ca2+ changing smaller is an important point of the mechanism of electronic anti-fouling.
(2) the first water coordination number for Ca2+ changes from 4 to 5. The first water coordination number for Ca2+ increasing also can be considered that the hydration between Ca2+ and water molecules is enhanced by external AC electric field.
(3) the location of the second water shell of Ca2+ and the second water coordination number for Ca2+ almost have no change. Therefore, it is considered that the external AC electric field has no obvious impact to the second water shell of Ca2+.
(4) the self-diffusion coefficient of Ca2+ is larger than the self-diffusion coefficient under no external electric field. When the AC electric field frequency is 400KHz and amplitude is 70v/m, the self-diffusion coefficient of Ca2+ has the maximum. The larger self-diffusion coefficient of Ca2+ can be considered that the activity of Ca2+ is enhanced. The self-diffusion coefficient of water molecules changes larger, which means that the activity of water molecules is enhanced too. When there are carbonate ions appearing in the CaCl2 aqueous solution, the increase of particles activity can make a
(5) the increment of self-diffusion coefficient of water molecules under AC electric field with different amplitude is more than the increment under AC electric field with different frequency. Since a larger self-diffusion coefficient of water molecules can make a better anti-fouling effect, therefore in the practical application the anti-fouling effect can be controlled by changing the current strength of excitation signal produced by EAF system.
References
1. Y.I.Cho, C.F.Fan and B.G.Choi, Int. Comm. Heat Mass Transf. 24 (1997) 757. 2. Y.I.Cho and S.H.Lee, Int. Comm. Heat Mass Transf. 32 (2005) 1.
3. L.D.Tijing, H.Y.Kim, D.H.Lee, C.S.Kim and Y.I.Cho, Int. J. Heat Mass Transf. 57 (2010) 1426. 4. W.T.Kim and Y.I.Cho, Int. Comm. Heat Mass Transf. 28 (2001) 671.
5. D.S.Premalatha1, B.Liana1, S.Vute and M.David R, Journal of Materials Science. 42 (2007) 6792. 6. Y.I.Cho and B.G.Choi, Int. J. Heat Mass Transf. 41 (1998) 2565.
7. Y.I.Cho and R.Liu, Int. J. Heat Mass Transf. 42 (1999) 3037.
8. X.K.Xing, C.F.Ma and Y.C.Chen, Chem. Eng. Tech. 28 (2005) 1540. 9. T.Yamaguchi, S.Hayashi and H.Ohtaki, Inorg. Chem. 28 (1989) 2434.
10.M.M.Probst, T.Radnai, K.Heinzinger, P.Bopp and B.M.Rode, J. Phys. Chem., 89 (1985) 753. 11.N.A.Hewish, G.W.Neilson, and J.E.Enderby, Nature. 297 (1982) 138.
12.J.L.Fulton, Y.S.Chen and S.M.Heald, J. Chem. Phys. 125 (2006) 1. 13.G.Licheri, G.Piccsluga and G.Pinna, J. Chem. Phys. 64 (1976) 2437. 14.Y.Marcus, Chem.Rev. 88 (1988) 1475.
15.H.Yong, Z.Y.Ping, C.Xin and L.X.Long, Electric Machines and Control. 15 (2011) 31. 16.B.Hess, C.Kutzner, D.van der Spoel and E.Lindahl, J. Chem. Theory Comput. 4 (2008) 435. 17.Z.Zhang and Z.Duan, Phys. Earth Planet. Inter. 149 (2005) 335.
18.L.X.Dang and D.E.Smith, J. Chem. Phys. 102 (1995) 3483.
19.M.Y.Li, Z.H.Duan, Z.G.Zhang , C.Zhang and J.Weare, Molecular Physics. 106 (2008) 2685. 20.W.F.van Gunsteren, S.R.Billeter, A.A.Eising, P.H.Hü nenberger, P.Krü ger, A.E.Mark,
W.R.P.Scott, and I.G. Tironi, Biomolecular simulation: The GROMOS96 manual and user guide, Zü rich, Groningen (1996).
21.M.P.Allen and D.J.Tildesley, Computer Simulation of Liquids, Clarendon Press, Oxford (1989). 22.T.Darden, D.York and L.Pedersen, J. Chem. Phys. 98 (1993) 10089.
23.H.G. Hertz and R.Mills, J. Phys. Chem. 82 (1978) 952.
24.A.Ariel, Chialvo and J.M.Simonson, J. Chem. Phys. 119 (2003) 8052.
25.T.Megyes, T.Grosz, T.Radnai, I.Bako and G.Palinkas, J. Phys. Chem. 108 (2004) 7261. 26.Y.S.Badyal, A.C.Barnes, G.J.Cuello and J.M.Simonson, J. Phys. Chem. 108 (2004) 11819. 27.T.Megyes, I.Bako, S.Balint, T.Grosz and T.Radnai, J. Mol. Liq. 129 (2006) 63.
28.S.Obst and H.Bradaczek, J. Phys. Chem. 100 (1996) 15677.
29.H.J.C.Berendsen, J.R.Grigera and T.P.Straatsma, J. Phys. Chem. 91(1987) 6269.
30.H.J.C.Berendsen, J.P.M.Postma, W.F.van Gunsteren and J.Hermans, B.Pullman ed., Reidel, Dordrecht (1981) 331.
31.Z.Jian, L.X.Hua, W.Y.Ru and S. Jun, Journal of Chemical Industry and Engineerin. 51 (2000) 143. 32.X.K.Xing and D. F. Jing , Journal of Engineering for Thermal Energy and Power. 22 (2007) 336. 33.H.Ohtaki and T.Radnai, Chem.Rev. 93 (1993) 1157.