This is a repository copy of Review Of PV Array Interconnection Schemes For Maximum
Power Operation.
White Rose Research Online URL for this paper:
http://eprints.whiterose.ac.uk/152565/
Version: Accepted Version
Proceedings Paper:
Etarhouni, M, Chong, B and Zhang, L (2019) Review Of PV Array Interconnection
Schemes For Maximum Power Operation. In: EU PVSEC 2019 Proceedings. 36th
European Photovoltaic Solar Energy Conference and Exhibition, 09-13 Sep 2019,
Marseille, France. WIP GmbH & Co Planungs-KG , pp. 1296-1302. ISBN 3-936338-60-4
https://doi.org/10.4229/EUPVSEC20192019-5BO.5.6
This article is protected by copyright. This is an author produced version of the following
conference paper: Etarhouni, M, Chong, B and Zhang, L (2019) Review Of PV Array
Interconnection Schemes For Maximum Power Operation. In: EU PVSEC 2019
Proceedings. 36th European Photovoltaic Solar Energy Conference and Exhibition, 09-13
Sep 2019, Marseille, France. WIP GmbH & Co Planungs-KG , pp. 1296-1302. ISBN
3-936338-60-4. Reproduced with permission from the publisher.
[email protected]
https://eprints.whiterose.ac.uk/
Reuse
Items deposited in White Rose Research Online are protected by copyright, with all rights reserved unless
indicated otherwise. They may be downloaded and/or printed for private study, or other acts as permitted by
national copyright laws. The publisher or other rights holders may allow further reproduction and re-use of
the full text version. This is indicated by the licence information on the White Rose Research Online record
for the item.
Takedown
If you consider content in White Rose Research Online to be in breach of UK law, please notify us by
REVIEW OF PV ARRAY INTERCONNECTION SCHEMES FOR MAXIMUM POWER OPERATION UNDER PARTIAL SHADING
Etarhouni Mohamed, Chong Benjamin, Zhang Li
University of Leeds / School of Electronic and Electrical Engineering Woodhouse lane, LS2 9JT, Leeds, UK
[email protected], [email protected], [email protected]
ABSTRACT: Published results on the performance of photovoltaic arrays under partial shading conditions are thoroughly reviewed, for a variety of conventional array interconnections. New results are presented for a wide variety of realistic shading patterns, and for several new hybrid methods of interconnection. The fully cross-tied array is found to give the best performance, and the simple series – parallel array the worst. In the more favourable shading cases, much of the excess loss in available power due to the shading can be recovered by adding the interconnections. An important result is that most of the power recovery can usually be achieved using a hybrid array with fewer interconnections, and hence lower cabling costs, than the fully cross-tied form.
Keywords: Photovoltaic, PV Array, Total-Cross-Tied (TCT), Maximum Power, Hybrid Array
1 INTRODUCTION
One of the proposed solutions to mitigate the effect of partial shading on a PV array is interconnecting the PV modules in different ways, hence forming different array configurations [1]. Conventional configurations include:
Simple Series (SS), Parallel (P), Total-Cross-Tied (TCT), Bridge-Linked (BL), and Honey-Comb (HC).
Many new varants were developed in recent years [2], and their comparative performance under partial shading has been studied [3]. It has been concluded that the parallel array is more robust under shading effects, and less prone to mismatching losses, than all the other configurations, but its low output voltage may be impractical. Conversely, simple series connections of PV modules are most liable to substantial power reduction due to the the mismatching effect [4].
Studies [5, 6] have been made of the electrical behaviour of differently sized arrays in SP, BL and TCT configurations. A comprehensive comparative study was performed between 3×4, 4×3, 6×6, 6×2, 2×6 and 9×4 arrays considering the shading condition. Results were compared on the basis of the Fill Factor (FF) as well as the Global Maximum Power Point (GMPP).
Two modelling techniques, Piecewise-Linear Parallel Branches [PLPB] and Newton-Raphson models have been used by [7] to analyse the output performance of S, SP, TCT, HC and BL arrays under a particular shading case. Results again showed the TCT topology outperforming the other array configurations in terms of ouptut power, but only a single pattern of shading was considered. Authors in [8] tested various cases of a random shading on different PV array configurations by software simulation. They concluded that TCT is less susceptible to the effect of mismatch losses compared to the other array configurations. They also claimed that TCT and HC are the most suitable configurations for both symmetrical and asymmetrical arrangements of a PV array, respectively. Only a random shading pattern was considered, which may not give completely conclusive nor quantitatively realistic results.
Recent developments in PV array interconnection technique have led to renewed interest in deriving new hybrid PV array configurations by modifying the conventional array connections into SP-TCT, BL-TCT and BL-HC arrays.
A comparative simlulation study was carried out by [9] to analyse the shading effects on SP, BL and TCT configurations. The performance of these arrays was evaluated with and without protection diodes. As a result, TCT showed a better output performance than SP and BL topologies under PSCs. [10] conducted a simulation study on a 4×4 array size of TCT, BL and SP configurations under a moving shading pattern. In this study, the authors found that the maximum power is extracted by selecting an array configuration that is best suited to the shading conditions.
More general ways of interconnecting arrays have been considered [11-15] and raise the question of loss occurring in the longer interlinking cables, and their increased cost.
The present paper thoroughly reviews the traditional along with the hybrid array configurations and highlights their advantages and limitations. New results are presented on the basis of six different and more realistic shading patterns, as will be defined. The comparison study has been conducted on a 4×5 array. Performance of all the array topologies is mainly assessed by comparing their Global Maximum Power Points (GMPP), the Mismatch Power Loss (ML) and the Fill Factor (FF). Several recommendations are made for addressing the shading issue using different array schemes, and further discussions are included on how to select the optimal array connections with a smaller number of ties, thus decreasing the complexity of the PV system and also the cabling costs.
2 PV ARRAY INTERCONNECTIONS
producing or absorbing power [18]. It is more likely that a bypass diode will be activated than a blocking diode in most shading conditions [19]. Though parallel connection appears to have better performance under non-uniform illuminations, its terminal voltage is significantly lower and may have to be boosted before being linked to the grid through an inverter [20]. This process will be inefficient for high voltage boost ratios, and a mixed series-parellel array is almost certain to be adopted in practice.
Authors in [21-24] have therefore proposed and tested several array interconnections such as SP, TCT, BL and HC, or any combination of two of these [11-15]; these can be classified into two groups, traditional and hybrid, as shown in Figs. 1(a-d) and Figs 2(a-c) respectively. These are now discussed.
2.1 Traditional Array Configurations
PV arrays connected in series and parallel (SP),as shown in Fig.1 (a),are the most common configurations and [25] has discussed their performance in detail. In this topology, a few series strings of PV modules are connected in parallel as shown in Fig. 1(a) to obtain the required voltage level and current level. This SP topology has some advantages as it is easy to implement, has no redundant connections, and hence is more economical to build [26]. Convenient voltage and current levels can be achieved simultaneously [27]. It has no interconnection between two series strings, hence if one module is less illuminated,
its bypass diode is activated and the series string’s voltage
will drop. Then all the modules of the same string may be prevented from generating power due to the requirement to activate the associated blocking diode [28].
Authors in [29] proposed the tied-cross-tied (TCT) connection which alleviates these issues of SP, and is derived through fully cross-tying the rows of junctions as in Fig.1(c). Thus, the total array voltage is determined by summing the voltage across the individual rows, and the overall current is the sum of the currents flowing in all the strings in the array. The cross ties within the TCT configuration reduce the possibility of turning on bypass diodes and can increase the lifetime of the PV array to nearly double that in SP form [30]. When one module is less illuminated, the higher current of the other more illuminated modules can flow in the other series strings through the cross ties without the need to activate the bypass diodes of the shaded module [31]. The ability of the current to flow from one series string to another also implies that one module can be open circuited. For example, [28] shows that since one short circuited module does not disable an entire string, the TCT scheme allows one module to be taken out for maintenance while other modules are in normal operation. It has been proven in [17] that the TCT topology offers a better output performance than the SP scheme. In this work, a mathematical modelling approach has been used to demonstrate that the mismatch power loss (ML) is significantly less than that of the SP scheme. The authors in [29] pointed out that the TCT topology offers a better output performance than the SP scheme under any kind of shading condition while those in [23] highlighted that, for most cases, there is only a single power peak in the power-voltage (P-V) characteristic of TCT arrays, especially when they experience column-wise shading. However, there are many redundant links (the cross ties) in TCT arrays and if all the PV modules are experiencing uniform illumination, there will be little or no current flowing through these links [22].
The many redundant links of TCT may incur some cost penalty, and several authors [21-24] proposed and tested alternatives. One is based on the bridge link (BL) topology as shown in Fig. 1(b). The modules are connected in a form reminiscent of a bridge rectifier circuit where every four neighbouring modules are grouped together. Between two groups of these modules, a cross –tie link is inserted to connect two adjacent series strings so that all the links resemble a brickwork pattern based on the stretcher bonding method [11]. Clearly this configuration shows fewer tie-cross links, but has more alternative current paths than the SP scheme so the ML is lower than that of SP under partial shading [32]. Considering Fig. 1(b), it can be seen that the number of these links in BL is half of that in TCT, so reducing wiring cost and installation time. The work in [24] showed that the BL form can achieve the highest maximum output power point compared to both the TCT and SP arrays, but this was only under certain shading patterns. Results in [26] showed that TCT outperforms BL under most partial shading conditions while work in [23] shows that BL can deliver the second highest maximum power among SP and TCT configurations under the column-wise shading. Therefore, the authors in [33] have clearly stated that BL is generally more sensitive to mismatch effects than TCT.
Another alternative configuration to BL topology is based on the Honeycomb (HC) structure as shown is Fig. 1(d).
(a) (b) (c)
(d)
Fig. 1: Traditional PV array topologies; (a) SP; (b) BL;
(c) TCT; (d) HC
(a) (b) (c)
Fig. 2: Hybrid PV array topologies; (a) SP-TCT; (b)
BL-TCT; (c) BL-HC
both BL and TCT. According to [4], when the array columns and rows are not equal (asymmetrical), HC outperforms TCT in this case under specified shading conditions. However in the work in [33], TCT still generally shows the better output power performance than HC under most shading conditions, since the former still offers the maximum number paths for the current flow. Only a limited amount of research has been carried out on the HC configuration, which is still largely unexplored.
Among all the traditional array configurations, it is clear from the literature that though the cost is higher, TCT configuration is able to deliver the best performance.
2.2 Hybrid Array Configurations
Recent developments in the field of PV array interconnections have led to renewed interest in deriving new hybrid array configurations. Traditional array connections have been modified into SP-TCT, BL-TCT and BL-HC arrays as seen in Fig. 2(a-c), respectively. [15, 16] stated that these recently derived hybrid configurations can also generate better power levels than TCT under most PSCs.
SP-TCT [23] has rows completely cross linked at every other row, and can be characterized as the scheme with the lowest possible redundancy in terms of the number of internal connections, compared to either BL-TCT or BL-HC. However, SP-BL-TCT usually generates less power than the other two hybrid configurations and presents more power peaks in the PV curve under most shading cases [16].
The work of [11] has shown that the hybrid BL-TCT topology can become an alternative solution to the shading effect and one which can replace TCT, as it reduces the number cabling connections compared to TCT which in turn minimises the stress on the PV modules. However, the performance of the three hybrid array configurations has been examined by [15, 16, 23, 24, 25] and compared with that of TCT along with another proposed reconfigured arrangements of PV arrays based on static reconfigurations techniques, where the electrical connections of the arrays are fixed while the location of the panels are re-shuffled within the array in order to disperse the shading effect widely over the entire array, thereby increasing the current of each row. The results showed that these reconfigurable arrays based on a particular shade dispersion puzzle pattern could overcome the limitations of both TCT and hybrid configurations, respectively, and also lead to higher power extraction.
3 DEFINITIONS OF PERFORMANCE INDICATORS SHADING PATTERNS FOR DIFFERENT PV ARRAYS
Some new results will now be given for traditional and hybrid arrays, using a greater variety of more realistic shading patterns. The common performance indicators which have been used to evaluate the arrays discussed in Section 2 include the Maximum Power (MP), Mismatch Power Loss (%ML) and Fill Factor (FF) of a PV array. The following sub-sections explain all these performance indicators and then show examples of several common shading conditions.
3.1 Assessment Criteria
Maximum Power (MP): The most straightforward
indicator is the maximum amount of power that can be extracted from the PV array under a specific weather
condition [23, 24]. Normally the peak point of the P-V characteristics of an array is the desirable operating point for maximum power extraction; this corresponds to specific voltage and current values. Due to the partial shading effects as described in Section 2, more power peaks can be present on the P-V characteristics and there is only one global peak point, PGMPP that gives the highest
power [16]. The voltage at which this operation occurs changes for different weather conditions. There is a huge amount of work has been done for tracking and controlling a PV array so that it always generates PGMPP[25]. Even
when a PV array is operating at PGMPP point, not all PV
modules are delivering their maximum powers due to the activation of the bypass and/or blocking diodes, as highlighted in Section 2.
All the results quoted below assume that only the total terminal voltage of the array can be varied by using a single variable ratio converter at the array output terminals. However, it is assumed that this voltage is freely variable and that the controller can always locate the value
required to reach the array’s global power peak.
Mismatch Power Loss (ML): This can be obtained
using the following equation [23-25]:
(1)
where %ML indicates the percentage of the Mismatch Power Loss, Psum is the total power available to all
individual modules when they are connected separately to the system or load. This indicator is equal to one when all PV modules are delivering all their maximum powers.
Fill Factor is the ratio between the global peak power
and the product of the short-circuit current and open-circuit voltage of the PV array under the partial shading condition. The fill factor is determined as[23]:
(2)
where ISC, VOC both refer to the short-circuit current and
open-circuit voltage of the PV array respectively. Fill Factor of each array configuration is calculated and presented in Table III under different shading patterns.If the fill factor is close to unity, the array performance is considered to be better.
3.2 Shading Patterns
There are different types of shading patterns considered in the simulation study where PV modules receive different levels of solar irradiances, such as diagonal, Short-Narrow (SN), Short-Wide (SW), Long-Narrow (LN) Long-Wide (LW) and Centre shadings. As shown in Fig. 3, all these have been demonstrated through an example the 4×5 PV array and the shading patterns follow the description of the experimental work carried out by the authors in [24]. Additionally, specifications of a single PV unit are tabulated in Table I and applied for the Simulink model under standard uniform conditions where the solar irradiance is 1000 W/m2, and the cell temperature is 25C0.
(d) (e) (f)
Fig. 3: Different shading patterns; (a) Diagonal; (b) SN;
(c) SW; (d) LN; (e) LW; (f) Centre
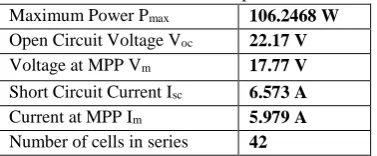
Table I: PV Module Specifications
4 PERFORMANCE ASSESSMENT OF PV ARRAYS UNDER PARTIAL SHADING CONDITIONS
Using the indicators described in Section III, this section discusses the performance assessment of the traditional PV array configurations to decide the best array arrangement that leads to a significant power extraction.
The assessment is done on the example of a 4×5 PV array under different shading patterns as illustrated in Fig. 3. A comprehensive comparison between both the traditional and recently derived hybrid PV array configurations is presented under chosen realistic shading conditions. A MATLAB/Simulink software was used to simulate the array topologies under different PSCs.
4.1 Performance of the Configurations under Each Shading Pattern
Figs. 4 – 9 present the P-V characteristics of the traditional and the hybrid PV arrays under different shading conditions. The maximum global power of each array scheme is tabulated in Table II under the mentioned shading patterns and the performance of all arrays under each shading condition is discussed in the following sub-sections.
4.1.1 Diagonal shading (DS)
The simulation results reveal that TCT array configuration has the best power performance with PGMPP
of 1566W. From the data in Table IV, it is observed that it has the lowest ML of 1.5%. This configuration also produces no local power peaks when comparing to the other configurations under diagonal shading type, implying the bypass diodes are less like to be activated. From the data in Table II, the new hybrid array topology BL-HC shows relatively good results as compared to TCT. It has the second best performance delivering PGMPPof
1484W. This topology as well as BL-TCT only have
slightly less ML than TCT. However, SP has the lowest power performance under this pattern. This topology and HC arrays have MLs of 28.8% and 19.8% respectively. In short, any array topologies having some tie-cross links will enable them to have higher MP and lower ML.
4.1.2 Centre shading (CS)
Under this pattern, TCT array is proved to have the best power performance having PGMPP of 1384 W with
MLof 20.66%. This is followed by BL-HC and BL-TCT
generating PGMPP of 1383 W and 1379 W respectively
having ML of 20.95% and 20.72%. The PGMPPin BL, HC
and SP-TCT are less than that in TCT by 3.9%, 3.76% and 4.12% respectively. On the other hand, SP configuration showed the lowest power performance; its PGMPP is 8.16% less than that of TCT.As more series
strings are affected by shading, the MLs are slightly higher for all array configurations as compared to those of other shading patterns.
4.1.3 Short-Narrow shading (SN)
TCT configuration again has the highest PGMPP of
1664 as shown in Table II and Fig. 6. PGMPPin all BL
related configurations including BL, BL-TCT and BL-HC are lower than that of TCT by less than 3% while in SP-TCT and BL-SP-TCT, the percentage difference is in between 3-5%. SP has the lowest PGMPP of 1552W.
4.1.4 Short-Wide shading (SW)
As seen from the data depicted in Tables II&IV and Fig. 7, all the PV array configurations have almost similar range of PGMPP where TCT, BL-TCT and BL-HC have the
highest PGMPP of 1201W while it is 1160W in SP. In terms
of power loss, TCT, BL-TCT and BL-HC are considered as the most efficient configurations under this shading condition since they presented the lowest ML of 19.6% while SP has ML of 22.3%. Nevertheless, the mismatch power losses for all array configurations under this shading pattern can be as high as those under centre shading and as observed in Fig. 2, more series strings are experiencing non-uniform illumination levels.
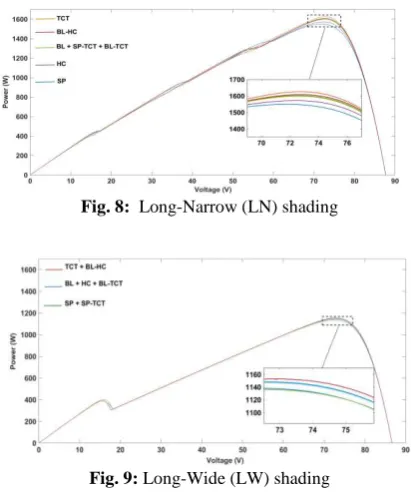
4.1.5 Long-Narrow shading (LN)
The presented results in Table II and Fig. 8 reveal that TCT is the most efficient configuration under this shading pattern since it has PGMPP of 1625W. BL and SP-TCT have
PGMPP of 1599W and 1598W respectively while SP array
produces PGMPP of 1549W when compared to the other
array configurations. TCT has ML of 3.41% followed by BL-TCT and BL-HC, all of which has MLs of 4.7% and
4.5% respectively. The ML of SP is the highest at 7.9%,
implying that the SP array is still highly vulnerable to the effect of this shading pattern. These and all the MLs of all traditional and hybrid array configurations are lower than other shading conditions. This may be mainly because most of the modules in the affected series strings are experiencing uniform solar illuminations though they are lower than those of the unshaded modules. Also SP configuration has three multiple local power peaks, but none of the other array configurations showed local peak points.
4.1.6 Long-Wide shading (LW)
The traditional and hybrid configurations showed very similar power performance where TCT and BL-HC have the highest PGMPP of 1149W followed by BL and HC
configurations with PGMPP of 1141W. SP and SP-TCT
have the lowest global power values. These values as well as those of other configurations are generally lower than those of other shading conditions. This could imply that more bypass diodes are likely to be activated when all the array configurations are experiencing this shading condition. TCT and BL-HC has the lowest mismatch power loss of 7.4%.
Under all the above shading conditions, the performances of all the array configurations discussed in Section II can also be analysed in terms of their FFs using Maximum Power Pmax 106.2468 W
Open Circuit Voltage Voc 22.17 V
Voltage at MPP Vm 17.77 V
Short Circuit Current Isc 6.573 A
Current at MPP Im 5.979 A
[image:5.595.72.261.203.281.2]the data in Table III. TCT, BL-TCT and BL-HC appear to perform better than the other array schemes, as their FFs are close to unity under PSCs.
Fig. 4: Diagonal shading
Fig. 5: Centre shading
Fig. 6: Short-Narrow (SN) shading
Fig. 7: Short-Wide (SW) shading
5 SUMMARY OF THE OBTAINED RESULTS AND RECOMMENDATOINS
From the above study, three insights can be generated for any pattern: the total power output Psum, which is
ideally possible under different shading patterns, the global peak power of each array topology can actually produce, and the mismatch power loss under all listed shading patterns.
Fig. 8: Long-Narrow (LN) shading
Fig. 9: Long-Wide (LW) shading
Out of six different shading conditions, one can see that LW gives the lowest Psum of 1282 W as shown in
Table II. For this case, the average PGMPP for all array
topologies is a low 1141 W, or 89% of Psum for this
shading condition. The next lowest is SW, where Psum a
higher 1494 W, and the average global peak power, PGMPP,
for all seven array connections is about 1188 W, 80% of its corresponding Psum. Though, under both these shading
conditions, PGMPP values for TCT connection are the
highest, and the results for the two hybrid topologies, BL-TCT and BL-HC, are close, the differences in PGMPP for
all array topologies, including TCT, are small. For example, for LW shading, PGMPP/Psum is 89% for TCT and
88% for SP. For SW shading, the corresponding figures
are 80% and 77%. Hence, no array connection gives substantial improvement over SP, which proves to be the worst case for all the shading patterns. This is because these two shading patterns degrade most of the panels in a single row and the cross ties cannot do much to improve the output power. The above implies that under these two shading cases, changing the array configuration may not be cost effective.
On the other hand, the shading pattern SN has the highest Psum of 1808 W, because the shading area is the
smallest. Consequently, the average PGMPP for all
topologies is a higher 1613 W, 89% of Psum for this
shading case. TCT gives the best power performance with PGMPP being 92% of its corresponding Psum value,
followed by three hybrid configurations. The poorest, SP, is about 86%. Similarly for LN pattern, though in this case Psum is lower than that of SN, TCT produce highest power
with PGMPP nearly 97% of its Psum and the lowest SP is just
92%. The hybrid configurations remain close to TCT in
performance. Thus under SN and LN shading patterns, the change of configurations can lead to up to more power.
For CN case the ideal power sum is a relatively high
1744 W, but the array configurations give a low global
maximum power with PGMPP equal to 1271 W for the SP
[image:6.595.66.275.121.628.2]The situation is different for the DS pattern, where there is a marked improvement for the TCT topology and its performance approaches the ideal. Interestingly, however, most of the performance can also be recovered with one of the hybrid connections.
This finding was unexpected and suggests that shading can substantially degrade the average performance of an array and that some other power optimisation algorithm should be invoked to increase the output power for the
“bad” shading cases.
The percentage mismatch power loss %ML gives a clear impression of the performance loss caused by the unavoidable departures from individual maximum power points in the shaded array. It references the achievable array power PGMPP to the ideal power Psum, which itself
varies with the shading, hence %ML and are not functionally related but they are highly correlated. Table IV shows %ML for the same array topologies under all 6 shading patterns. Under LN shading the average loss for all array connection is the lowest, this conforms to the Table II where the average PGMPP in this case is very close
to the corresponding Psum. On the other hand, CN gives
highest average loss. In all cases TCT gives lowest average
loss compared to all the other topologies and SP’s average loss is the highest.
Table III shows the calculated FF for the various shading patterns and array interconnections. The results show the same trends as the above two performance parameters, in that the TCT connection is the best and SP is the worst. Particular for DS shading pattern, TCT is as high as 70%, followed closely by two hybrid shading patterns, BL-TCT and BL-HC. However, for other shading patterns, the improvement offered by cross-tying the array is quite limited. The best cases of the hybrid arrays can offer much of the improvement offered by TCT with reduced interconnection costs.
6 CONCLUSION
The paper considered the potential of ameliorating the effect of partial shading on a PV array by optimising the array interconnections. The fully cross-tied (TCT) array is the best but similar improvements may be obtained from hybrid interconnections. There is some penalty in the cost of adding cabling to the array, and for many shading patterns the benefit is quite limited.
The simple cross – tied topologies considered here do not exhaust the possibilities. A more general modification can be defined conceptually by keeping the array interconnections, of whatever complexity, fixed but moving the panels to different physical locations with the array. Since however the panels are nominally identical, this can be reduced to an equivalent array with the panels not moved but with more general (and sometimes longer) interconnections. It can obviously change, and potentially improve, the average array performance since the shading patterns will exhibit statistical spatial correlations. Later work should evaluate the potential of these more general ways of cross-linking the array, whether in a static or adaptive configuration.
Table II: PGMPP and Psum of PV arrays under PSCs [W]
Table III: Fill Factor (FF) of different PV arrays
Table IV: Mismatch power loss (%ML) of different PV
arrays
7 REFERENCE
[1] A. Bidram, A. Davoudi, and R. S. Balog, "Control and Circuit Techniques to Mitigate Partial Shading Effects in Photovoltaic Arrays," IEEE Journal of Photovoltaics, vol. 2, pp. 532-546, 2012.
[2] M. Dhimish, V. Holmes, B. Mehrdadi, M. Dales, B. Chong, and L. Zhang, "Seven indicators variations for multiple PV array configurations under partial shading and faulty PV conditions," Renewable Energy, vol. 113, pp. 438-460,2017.
[3] L. Gao, R. A. Dougal, S. Liu, and A. P. Iotova, "Parallel-Connected Solar PV System to Address Partial and Rapidly Fluctuating Shadow Conditions," IEEE Transactions on Industrial Electronics, vol. 56, pp. 1548-1556, 2009.
[4] Y. Jiang, J. A. A. Qahouq, A. Hassan, M. E. Ahmed, and M. Orabi, "Energy Efficient Fine-grained approach for Solar Photovoltaic Management System," in 2011 IEEE 33rd International Telecommunications Energy Conference (INTELEC), 2011, pp. 1-4.
[5] E. Karatepe, M. Boztepe, and M. Çolak, "Development of a suitable model for characterizing photovoltaic arrays with shaded solar cells," Solar Energy, vol. 81, pp. 977-992, 2007.
[6] N. D. Kaushika and N. K. Gautam, "Energy yield simulations of interconnected solar PV arrays," IEEE Transactions on Energy Conversion, vol. 18, pp. 127-134, 2003.
Shading
case SP TCT BL HC SP-TCT BL-TCT BL-HC
Diagonal 28.8 1.47 15.7 19.8 14.1 7.51 6.6
Centre 27.1 20.7 23.8 23.6 23.9 20.9 20.7
SN 14.2 8 11.2 12.7 9.9 9.9 9.8
SW 22.3 19.6 21.3 20.9 19.7 19.6 19.6
LN 7.9 3.4 5 6.62 4.9 4.7 4.5
LW 11.5 10.4 11 11 11.6 11.1 10.4
Shading SP TCT BL HC
SP-TCT BL-TCT BL-HC
Diagonal 0.39 0.70 0.58 0.50 0.51 0.61 0.64
Centre 0.44 0.48 0.46 0.46 0.46 0.48 0.48
SN 0.54 0.57 0.55 0.55 0.56 0.56 0.56
SW 0.41 0.42 0.41 0.41 0.42 0.42 0.42
LN 0.61 0.64 0.63 0.62 0.63 0.63 0.63
LW 0.53 0.53 0.53 0.53 0.52 0.53 0.53
Shading
case Psum SP TCT BL HC SP-TCT BL-TCT BL-HC
Diagonal 1589 1131 1566 1340 1274 1366 1470 1484
Centre 1744 1271 1384 1330 1332 1327 1379 1383
SN 1808 1552 1664 1607 1579 1630 1630 1632
SW 1494 1160 1201 1175 1181 1200 1201 1201
LN 1682 1549 1625 1598 1571 1599 1603 1607
[7] Y.-J. Wang and P.-C. Hsu, "An investigation on partial shading of PV modules with different connection configurations of PV cells," Energy, vol. 36, pp. 3069-3078, 2011.
[8] R. Ramaprabha and B. L. Mathur, "A Comprehensive Review and Analysis of Solar Photovoltaic Array Configurations under Partial Shaded Conditions," International Journal of Photoenergy, 2012.
[9] M. Jazayeri, S. Uysal, and K. Jazayeri, "A comparative study on different photovoltaic array topologies under partial shading conditions," in 2014 IEEE PES T&D Conference and Exposition, 2014, pp. 1-5.
[10] S. Pareek and R. Dahiya, "Enhanced power generation of partial shaded photovoltaic fields by forecasting the interconnection of modules," Energy, vol. 95, pp. 561-572, 2016.
[11] B. Nayak, A. Mohapatra, and P. Das, "Optimal hybrid array configuration scheme to reduce mismatch losses of photovoltaic system," in 2017 Second International Conference on Electrical, Computer and Communication Technologies (ICECCT), 2017, pp. 1-7.
[12] A. S. Yadav, R. K. Pachauri, Y. K. Chauhan, S. Choudhury, and R. Singh, "Performance enhancement of partially shaded PV array using novel shade dispersion effect on magic-square puzzle configuration," Solar Energy, vol. 144, pp. 780-797,2017.
[13] A. S. Yadav, R. K. Pachauri, and Y. K. Chauhan, "Comprehensive investigation of PV arrays with puzzle shade dispersion for improved performance," Solar Energy, vol. 129, pp. 256-285, 2016.
[14] P. R. Satpathy and R. Sharma, "Power and mismatch losses mitigation by a fixed electrical reconfiguration technique for partially shaded photovoltaic arrays," Energy Conversion and Management, vol. 192, pp. 52-70, 2019.
[15] G. Sai Krishna and T. Moger, "Improved SuDoKu reconfiguration technique for total-cross-tied PV array to enhance maximum power under partial shading conditions," Renewable and Sustainable Energy Reviews, vol. 109, pp. 333-348, 2019.
[16] S. Bana and R. P. Saini, "Experimental investigation on power output of different photovoltaic array configurations under uniform and partial shading scenarios," Energy, vol. 127, pp. 438-453, 2017.
[17] A. Dolara, G. C. Lazaroiu, S. Leva, and G. Manzolini, "Experimental investigation of partial shading scenarios on PV (photovoltaic) modules," Energy, vol. 55, pp.2013. [18] E. V. Paraskevadaki and S. A. Papathanassiou, "Evaluation of MPP Voltage and Power of mc-Si PV Modules in Partial Shading Conditions," IEEE Transactions on Energy Conversion, vol. 26, pp. 923-932, 2011.
[19] L. T. M. Tam, N. V. Duong, N. T. Tien, and N. V. Ngu, "A Study on the Output Characteristic of Photovoltaic Array under Partially Shaded Conditions," Applied Mechanics and Materials, vol. 472, pp. 198-205, 2014.
[20] M. Oulcaid, H. E. Fadil, L. Ammeh, A. Yahya, and F. Giri, "Static behavior and global maximum power point characteristics of photovoltaic array under partial shading," in 2017 International Conference on Electrical and Information Technologies (ICEIT), 2017, pp. 1-6. [21] S. Malathy and R. Ramaprabha, "Comprehensive analysis on the role of array size and configuration on
energy yield of photovoltaic systems under shaded conditions," Renewable and Sustainable Energy Reviews, vol. 49, pp. 672-679, 2015.
[22] S. Mohammadnejad, A. Khalafi, and S. M. Ahmadi, "Mathematical analysis of total-cross-tied photovoltaic array under partial shading condition and its comparison with other configurations," Solar Energy, vol. 133, pp. 501-511, 2016.
[23] M. Dhimish, V. Holmes, B. Mehrdadi, M. Dales, B. Chong, and L. Zhang, "Seven indicators variations for multiple PV array configurations under partial shading and faulty PV conditions," Renewable Energy, vol. 113, pp. 438-460,2017.
[24] H. Tian, F. Mancilla–David, K. Ellis, E. Muljadi, and P. Jenkins, "Determination of the optimal configuration for a photovoltaic array depending on the shading condition," Solar Energy, vol. 95, pp. 1-12, 2013. [25] P. S. Rao, G. S. Ilango, and C. Nagamani, "Maximum Power from PV Arrays Using a Fixed Configuration Under Different Shading Conditions," IEEE Journal of Photovoltaics, vol. 4, pp. 679-686, 2014.
[26] M. Z. S. El-Dein, M. Kazerani, and M. M. A. Salama, "Novel configurations for photovoltaic farms to reduce partial shading losses," in 2011 IEEE Power and Energy Society General Meeting, 2011, pp. 1-5.
[27] M. C. Di Vincenzo and D. Infield, "Detailed PV array model for non-uniform irradiance and its validation against experimental data," Solar Energy, vol. 97, pp. 314-331, 2013.
[28] A. Abete, E. Barbisio, F. Cane, and P. Demartini, "Analysis of photovoltaic modules with protection diodes in presence of mismatching," in IEEE Conference on Photovoltaic Specialists, 1990, pp. 1005-1010 vol.2. [29] P. Bhatnagar and R. K. Nema, "Maximum power point tracking control techniques: State-of-the-art in photovoltaic applications," Renewable and Sustainable Energy Reviews, vol. 23, pp. 224-241, 2013.
[30] M. C. Alonso-García, J. M. Ruiz, and W. Herrmann, "Computer simulation of shading effects in photovoltaic arrays," Renewable Energy, vol. 31, pp. 1986-1993, 2006. [31] M. L. Orozco-Gutierrez, G. Spagnuolo, C. A. Ramos-Paja, J. M. Ramirez-Scarpetta, and B. Ospina-Agudelo, "Enhanced simulation of total cross tied photovoltaic arrays," Mathematics and Computers in Simulation, vol. 158, pp. 49-64, 2019.
[32] G. Velasco-Quesada, F. Guinjoan-Gispert, R. Pique-Lopez, M. Roman-Lumbreras, and A. Conesa-Roca, "Electrical PV Array Reconfiguration Strategy for Energy Extraction Improvement in Grid-Connected PV Systems," IEEE Transactions on Industrial Electronics, vol. 56, pp. 4319-4331, 2009.