Int. J. Electrochem. Sci., 11 (2016) 1228 - 1246
International Journal of
ELECTROCHEMICAL
SCIENCE
www.electrochemsci.orgA Rule Based Power Split Strategy for Battery/Ultracapacitor
Energy Storage Systems in Hybrid Electric Vehicles
Kursad Gokce1,*, Ayhan Ozdemir2 1
R&D Department, Otokar Automotive and Defense Ind. Corp., Arifiye, 54580, Sakarya, Turkey 2
Electrical Electronics Engineering Department , Sakarya University, *
E-mail: kgokce@otokar.com.tr
Received: 4 November 2015 / Accepted: 18 December 2015 / Published: 1 January 2016
This paper presents a simple and efficient rule based power split strategy for a combined battery/ultracapacitor energy storage system having electrochemical characteristics in hybrid electric vehicles. For this purpose, a novel rule based controller with three stages is introduced. The first stage is determination of the operation modes (i.e. either charge or discharge commands) of the energy sources based on the direction of the power request (i.e. either in traction or regen request) and the charge/discharge states (i.e. energy sources either in charging or discharging phase). In the second stage, new weighting parameters used in rule tables are formulated based on the state of charge levels (SOC) of the energy sources to ensure the charge sustainability (i.e. SOC within limits). In the last stage, the power split rules are defined in rule tables based on the operation modes, states of the energy sources and the weighting parameters. The performance of the proposed strategy has been tested on a hybrid electric city bus developed in MATLAB/Simulink and compared with alternative rule based power split strategy through comprehensive simulation studies under different drive cycle conditions. For comparison purpose, two different case studies have been conducted. First, the results have been compared with the battery only system and then the effectiveness of the proposed strategy has been compared with that of alternative one. The simulation results showed that the proposed strategy significantly reduces the frequency of high C-rate current drawn from the battery and provides a more smooth change in battery current during sudden acceleration events when comparing with alternative strategy.
Keywords: battery, ultracapacitor, energy storage, hybrid electric vehicle, rule based control.
1. INTRODUCTION
ultracapacitors (supercapacitors) have high power density, inherently long cycle life and high current rapid charge/discharge characteristics [1-3]. They provide significant improvements not only in acceleration and regenerative braking performance of the vehicle but also in cost, weight and lifetime of the battery by supplying or accepting peak power demands during transients. These complementary features of the batteries and the ultracapacitors make the combination of them quite attractive for hybrid city bus applications where high energy and power densities are required. There have been many studies in the literature that expose the benefits of using ultracapacitors in hybrid electric vehicles [4-11].
In recent years, considerable efforts have been devoted to the management of energy flow through multiple energy sources. For this purpose, bidirectional DC/DC converters in different topologies have been used between the battery and ultracapacitor systems [12]. In these topologies, the power that is absorbed or supplied by each energy source has been determined based on the power limits and characteristics of the components, which is called passive strategies [13]. However, active strategies are the most effective in reducing current stress and improving the lifetime of the energy sources. For example, ultracapacitor voltage can be controlled based on the vehicle speed such that the voltage is low at high speeds and the voltage is high at low speeds [14]. Thus, ultracapacitor can be charged to fully capacity during braking and provide peak power for acceleration. In [15], a coordinated power distribution method has been proposed between the batteries and the ultracapacitors to reduce the current stress on the batteries. In another study, a model predictive controller has been developed to split the power between the ultracapacitor and the battery in a hybrid electric vehicle with the objective of reducing the discharge intensity (C-rate) of the battery [16]. The results showed that cycling the battery at high C-rates has been reduced to a large extent with the introduction of the ultracapacitors to the system. In [17], a dynamic control of the battery/ultracapacitor systems has been performed for mild hybrid electric vehicles such that the battery is paralleled with ultracapacitor through a switch that connects/disconnects the battery to the power line. This switch has been controlled by battery management system (BMS) based on the estimated SOC of the storage devices. The test results indicated that the battery voltage drop has been reduced and the peak charge/discharge current has been eliminated compared to the battery only case by implementing this switching strategy. In [18], a frequency decomposition technique has been employed for load power splitting between the battery, ultracapacitor and fuel cell in which the ultracapacitor acts as a high pass filter, battery acts as a medium pass filter and fuel cell acts as a low pass filter. In [19], ultracapacitor was used as a load leveling device for fuel cell system such that the current demand from the fuel cell was calculated by simply averaging the load current and the remaining transient current was supplied by the ultracapacitor system. In [20], the interaction between the two electrochemical sources, fuel cell and battery, was examined. For this purpose, a hybrid fuel cell pack has been developed for unmanned aerial vehicle in which the instantaneous high power has been supplied by the battery to assist the fuel cell system.
rule based energy management algorithm has been also employed in [22] to split the power demand between the battery and the ultracapacitor in a parallel HEV such that peak power is supplied/absorbed by ultracapacitor while the average power is supplied by battery. In [23], a fuzzy logic controller has been employed for power splitting between the solar panel and battery. In [24], the load power has been distributed between the solar panel, battery and hydro system based on a flow chart of some rules. In this work, a novel rule based control strategy has been developed for battery/ultracapacitor hybrid energy source to investigate the effect of adding ultracapacitors on the performance of the batteries. The proposed strategy does not require a pre-knowledge about the driving cycle, vehicle speed and voltage levels of the energy sources. In the proposed strategy, the operation modes of the energy sources have been determined based on the power request and the charge/discharge states and some new weighting parameters have been introduced based on the state of charge levels of the energy sources. Rules are derived based on these weighting parameters by considering the charge/discharge states of the batteries and ultracapacitors and the operation modes to ensure that the SOC of the energy storage systems remains within the specified limits. The proposed strategy splits the power between the battery and the ultracapacitor system in such a way that the battery is not exposed to high temperature and high charge/discharge currents. The performance of the proposed strategy has been tested on a hybrid electric city bus developed in MATLAB/Simulink through comprehensive simulation studies under different drive cycle conditions. The results have been compared with the battery only case and the alternative strategy. It has been shown that, thanks to the effective power management strategy, high current stress on the batteries has been removed and the frequency of high charge/discharge rates have been significantly reduced. Therefore, the battery, which is the most critical component in electric vehicles in terms of cost, safety and performance, can be protected effectively, so the lifetime of the battery would be extended with the proposed power split strategy.
2. MATHEMATICAL MODELS OF ENERGY SOURCES
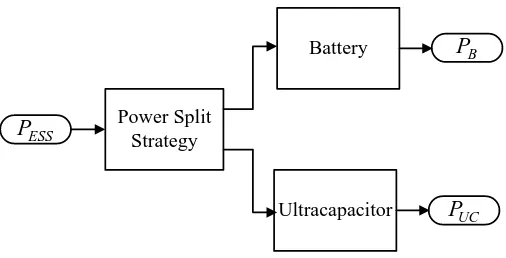
In order to study the proposed power split strategy, the battery and ultracapacitor models are developed as illustrated in Figure 1.
Power Split Strategy
Battery
Ultracapacitor
B
P
UC
P
ESS
[image:3.596.172.425.576.705.2]P
ESS
P is the total amount of power demanded from the battery/ultracapacitor system and is calculated as,
Genset req
ESS P P
P (1)
req
P is the required power of the motor drive system either be supplied or captured by the energy sources. PGenset is the available engine-generator set output power. PESS and PGenset are determined by the energy management system. PB and PUC are the available battery and ultracapacitor
powers determined by the power split logic as described in Section 3.
2.1. Battery model
Battery is modeled as a voltage source and an internal resistor. Battery resistance model is then established with the following circuit equations,
) ( / ) ( )
(k P k V k
IB B B (2)
) ( ) ( ) ( ) ( ) ( 2 _ k V k V k R k P k V B B B B OC B (3) 2 ) ( ) ( 4 ) 1 ( 2 ) 1 ( ) ( 2 _
_ k V k P k R k
V k
VB B OC B OC B B
(4)
nom B
B
B k SOC k I k T Q
SOC ( ) ( 1) ( ) /
(5) 0 ) ( 4 / ) ( )
( _ 2
_ k V k R k
PB DMax B OC D (6)
0 ) ( ) ( ) ( _ _ k R k V V V k P C OC B BMax BMax CMax B (7) 0 ) ( ), ( 0 ) ( ), ( ) ( k P k R k P k R k R B C B D B (8)
Where, kT indicates discrete time step and denoted as k for simplicity. T is sampling time in second. VB_OC(SOC), RD(T ,SOC)
and RC(T,SOC) are the open circuit voltage (OCV), discharge and charge resistances of the battery, respectively, and varies with the operating temperature and the SOC. IB is the battery terminal current, VB is the battery terminal voltage and Qnom is the nominal
battery capacity, generally provided in ampere hours. PB_DMax andPB_CMax are the maximum discharge and charge powers that the battery can produce at that time step, k. VBMax is the maximum allowed charging voltage of the batteries provided in the battery specifications.
Battery thermal model used in the simulations is a simple thermal capacitance - thermal resistance model as formulated in [25].
1) ( ) 1 ( 1) ( 1) 1 ( 1) ( 1)
( 2 T k T k
R k R k I C k T k
T B air
th B
B B B
B (9)
p B
B m c
C
A d Rth (11)
Where, CB is the thermal capacitance in J/K, mB is battery mass in kg, cp is specific heat
capacity in J/(kg.K), Rth is thermal resistivity in K/W, d is thickness in m, is thermal conductivity
in W/(m.K), A is surface area in m². These parameters can be derived experimentally or obtained from the manufacturer’s data sheets. TB is the battery temperature and Tair is the temperature of air
surrounding the battery.
2.2. Ultracapacitor model
Ultracapacitor is modeled as a simple RC circuit by the following equations,
) ( / ) ( )
(k P k V k
IUC UC C (12)
) ( ) ( ) ( ) ( 2 _ k V k V R k P k V C C UC UC OC UC (13) 2 ) ( 1 4 ) 1 ( 2 ) 1 ( ) ( 2 _
_OC UC OC UC UC
UC C R k P m m k V k V k V (14) Nom UC OC UC UC V k V k SOC _ _ ( ) )
( (15)
0 4 / ) ( )
( _ 2
_DMax UC OC UC
UC k V k R
P (16) 0 ) ( ) ( _ _ _ _ UC OC UC Max UC Max UC CMax UC R k V V V k P (17) Where, mRUCCUC /T, RUC is the internal resistance of the ultracapacitor and CUC is the rated capacitance in Farad. VUC_Nom is the nominal ultracapacitor voltage and VUC_Max is the maximum allowed charging voltage of the ultracapacitor given in the technical specifications.
3. ALTERNATIVE RULE BASED STRATEGY
Rule based strategies offer good solutions to the power split problems in hybrid electric vehicles because of their flexibility and robustness. In these strategies, the portion of the power supplied by each energy storage system (i.e. load leveling) is determined based on some pre-defined rules.
parameters, one can change the contribution of each source to the load power. Figure 2 shows the flowchart of this alternative rule based power split strategy.
0 ESS P If Min ESS P P Yes If
Can Ultracapacitor supply
Min ESS P P If Min ESS UC Min B P P P P P UC ESS B DMax UC UC P P P P P _ T UC C V
V _
[image:6.596.110.489.120.434.2]If B_Add UC B_Add ESS B P P P P P 0 UC ESS B P P P ) , ) , _ _ CMax B UC ESS B CMax UC ESS UC P P max(P P P max(P P (1) (2) (5) (3) (4) No Yes No Yes No Yes No
Figure 2. Alternative rule based power strategy.
As can be seen from Figure 2, if Pmin 0 then all requested power is supplied by ultracapacitor. Thus, a reasonable value should be chosen for Pmin. PB_Add is additional power that the battery should supply to charge the ultracapacitors if the ultracapacitor voltage, VC, is less than the target operating voltage, VUC_T. VUC_T is expressed based on the vehicle speed, v, as,
160 3 1 _ _ ach Max UC T UC v V
V
(18)
In Figure 2, each numbered rule step (i.e. 1-5) has been described in detail as,
Step-1: If PESS 0 (i.e. traction mode) and PESS PMin and ultracapacitor can supply the power, PESS PMin, then PB Pmin and PUC PESS PMin.
Step-3: If PESS 0 and PESS PMin and VC VUC_T then batteries supply both requested power and the additional power to charge the ultracapacitors, PB PESS PB_Add and PUC PB_Add.
Step-4: If PESS 0 and PESS PMin and VC VUC_T then batteries supply the requested power, PB PESS and PUC.
Step-5: If PESS 0 (i.e. regen mode), ultracapacitor is charged with power as much as it can accept and the remaining power is stored in batteries, PUC max(PESS ,PUC_CMax) and
)
max( ESS UC B_CMax
B P P ,P
P .
In comparative simulation study, PMin and PB_Add can be assigned to their optimum values based on the driving cycle simulations.
4. PROPOSED POWER SPLIT STRATEGY
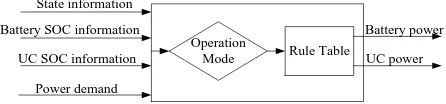
The goal of the proposed rule based power split strategy is to distribute the power between the battery and the ultracapacitor system to ensure that the batteries are protected against high current pulses and high temperature rise that could result in shortening of the battery life. In order to achieve this, a rule based controller has been developed as illustrated in Figure 3 and has been implemented in Simulink environment as shown in Figure 4.
State information Battery SOC information
UC SOC information Power demand
Operation
Mode Rule Table
[image:7.596.187.410.446.498.2]Battery power UC power
Figure 3. Rule based controller.
[image:7.596.243.400.555.733.2][image:8.596.59.545.205.547.2]
As shown in Figure 4, the inputs of the controller are; the battery and ultracapacitor state (i.e. charge or discharge state) information, SOC information, maximum available charge and discharge powers of the energy sources, maximum allowable battery power (i.e. limited power) and the power demand, PESS which is calculated by the energy management system. Based on this information, controller decides the appropriate operation mode and determines the required battery and ultracapacitor powers from the rule tables (i.e. Tab. 1-2). Figure 5 shows the internal block diagram of the rule based controller developed in Simulink in Figure 4.
Figure 5. Simulink block diagram of the rule based controller
As shown in Figure 5, rule based controller developed in Simulink mainly consists of three parts; operation mode selection, rule tables and the calculation of weighting parameters. All the definitions and calculations corresponding to the rule tables, weighting parameters and the operation modes have been described below.
B
SOC
BHigh
SOC
BLow
SOC
Ch arg
e
D is
ch arg
[image:9.596.190.394.80.247.2]e
Figure 6. Charge sustaining mode.
As can be seen from Figure 6, the battery is in discharge state while SOC is decreasing from high to low level and it is in charge state while SOC is increasing from low to high level.
For 2 different energy sources, there are 4 operation modes as illustrated in Figure 7.
UC
P
BLim
P
PBLimCMax B
P _ 0 PB_DMax
B
P 1
2
3 4
DMax UC
P _
CMax UC
P _
Figure 7. Operation modes.
In Figure 7, the x and y axis represent the battery and ultracapacitor powers, respectively. Positive power means that the power flows from energy source to the supply (i.e. discharging) while the negative power means that the power flows from supply to the energy source (i.e. charging). Here is the description of the operation modes,
[image:9.596.179.418.369.552.2]
some constraints. If PESS 0, then the rules in Tab. 1 are conducted and if PESS 0, then the rules in
[image:10.596.160.434.152.267.2]Tab. 2 are conducted.
Table 1. Power distribution for positive power demands State Operation
modes PB PUC
UC B
C D 4 PESS PESS PB
C C 1 PESSkT PESS(1kT)
D D 1 PESSkT PESS(1kT)
D C 2 PESS PUC PESS
Table 2. Power distribution for negative power demands State Operation
modes PB PUC
UC B
C D 4 PESS PUC PESS
C C 3 PESSkR PESS(1kR)
D D 3 PESSkR PESS(1kR)
D C 2 PESS PESS PB
In state columns, “C” refers to charge and “D” refers to discharge states. Rule based controller distributes the requested power between the battery and the ultracapacitor systems under the following constraints,
UC B
ESS P P
P (19)
DMax B B CMax
B P P
P _ _ (20)
DMax UC UC CMax
UC P P
P _ _ (21)
BHigh
BLow SOC SOC
SOC (22)
UCHigh
UCLow SOC SOC
SOC (23)
There is also one special constraint concerning the battery power limitation as,
BLim B
BLim P P
P
(24)
Battery is allowed to supply or accept power as much as PBLim which is an upper power limit
and calculated based on the maximum continuous charge/discharge current, Ich/dsch, as,
dsch ch Nom B
BLim V I
Among these constraints, the equality constraint (Eq. 19) must be strictly satisfied to ensure the vehicle’s performance. In Table 1-2, kT and kR are the weighting parameters defined for positive and negative power demands, respectively. These factors are taken into account when the batteries and ultracapacitors are discharging (i.e. mode “1”) or charging (i.e. mode “3”) at the same time and are calculated based on the SOC levels of the energy storage systems as,
y x
x k
y x
x k
R T
2
1 (26)
UCLow UCLow UC
BLow BLow B
SOC
SOC SOC SOC
y
SOC SOC SOC
x
(27)
Where,0(kT,kR)1 and SOCBLow and SOCUCLow are the lowest SOC values and SOCBHigh and UCHigh
SOC are the highest SOC values of the battery and the ultracapacitor, respectively. SOC is a
scale factor which is used to make the operating SOC range of the battery match that of ultracapacitor and calculated as,
BLow BLow BHigh
UCLow UCLow UCHigh
SOC
SOC SOC SOC
SOC SOC SOC
(28)
For example if
SOCBLow,SOCBHigh
0.55,0.65
and
SOCUCLow,SOCUCHigh
0.5,1
then SOC iscalculated as 5.5.
5. SIMULATION STUDY
Genset AC/DC
Battery
Electric
Motor Transmission Differential Wheel
Wheel
D
C
B
U
S
DC/AC
[image:12.596.137.457.71.208.2]UC DC/DC
[image:12.596.62.539.298.544.2]Figure 8. Series hybrid electric vehicle topology
Table 3. Simulation vehicle parameters
Parameter Value
Vehicle Dynamics
GVW (gross vehicle weight) 18 000 kg
Wheel rolling radius 0,47 m
Frontal area 7.3 m2
Aerodynamic drag coefficient 0,61 Rolling friction coefficient 0,0078
Valence
U24-12XP LiFePO4 Battery Pack
Number of modules 35 (1p35s)
Number of cells 140
Peak load current (30 seconds) 300 A
Max. continuous current 150 A
Rated capacity 110 Ah
Nominal voltage 450 V
Maxwell BMOD0063P125 Ultracapacitor Pack
Number of modules 6 (2p3s)
Nominal voltage 375 V
Peak load current (1 sec., 10%
duty cycle) 1500 A
Max. continuous current 600 A
The performance of power split strategy was investigated in two case studies: 1) comparison with battery only system; and 2) comparison with alternative strategy described in Section 3.
The Case Study-1
Figure 9. Results for Manhattan cycle (a) Vehicle speed (b) Battery only case (c) Bat/UC.
Figure 10. Results for UDDS cycle (a) Vehicle speed (b) Battery only case (c) Bat/UC.
[image:13.596.134.464.400.657.2]
Figure 11-12 show the variation of battery and ultracapacitor SOCs and battery temperature variation in the battery/ultracapacitor and battery only system for Manhattan and UDDS cycles, respectively. In the simulations, the ambient temperature is considered constant at 25°C and the initial SOC value of the battery has been set to 0.6.
Figure 11. Variation of SOC and temperature for Manhattan cycle (a) SOC variation (b) battery temperature.
Figure 12. Variation of SOC and temperature for UDDS cycle (a) SOC variation (b) battery temperature.
[image:14.596.162.433.155.368.2] [image:14.596.159.455.400.616.2][image:15.596.107.490.153.304.2]
Tab. 4 compares the battery discharge and charge currents in battery only and battery/ultracapacitor systems for Manhattan and UDDS cycles, respectively.
Table 4. Simulation vehicle parameters
Battery Parameters
Battery only Battery/UC
Manhattan
UDDS
Manhattan UDDS Avg. discharge
current (A) 112 147 77.5 100
Avg. charge
current (A) 60.5 68 42.2 45.8
Peak discharge
current (A) 300 300 230 240
Peak charge
current (A) 220 300 142 167
From Tab. 4, it is seen that the average battery discharge and charge currents have been reduced by 30%, the peak battery discharge current has been reduced by 25% and the peak battery charge current has been reduced by 50% for both driving cycles by adding ultracapacitor to the system.
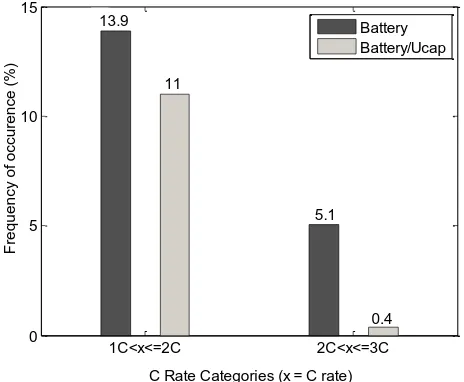
Figure 13 shows the effect of ultracapacitor on the current drawn from the batteries in different C-rate ranges for the Manhattan cycle. C-rate describes the rate of charge or discharge of battery and is calculated as the ratio of the applied charge or discharge current to the rated capacity. For example, a battery with a rated capacity of 110 Ah supplying 220 A to the load will have a C-rate of 2.
1C<x<=2C 2C<x<=3C
0 5 10 15
C Rate Categories (x = C rate)
F
re
q
u
e
n
cy
o
f
o
ccu
re
n
ce
(
%
)
Battery Battery/Ucap
0.4 5.1 11
[image:15.596.178.410.460.651.2]13.9
Figure 13. Battery C-rate distribution for Manhattan cycle.
frequency is 0.4% for battery/ultracapacitor system, which is quite lower than that of battery only system. The benefit of adding ultracapacitor to the battery system is also evident for UDDS cycle as shown in Figure 14.
1C<x<=2C 2C<x<=3C 0
5 10 15
C Rate Categories (x = C rate)
F
re
q
u
e
n
cy
o
f
o
ccu
re
n
ce
(
%
)
Battery Battery/Ucap 14.5
12.3
9.6
[image:16.596.194.394.142.304.2]2.3
Figure 14. Battery C-rate distribution for UDDS cycle.
As UDDS cycle is much more aggressive than Manhattan cycle, the current drawn from the battery in UDDS cycle is higher than that of Manhattan cycle. This situation results in a higher frequency of occurrence of high battery C-rates for battery/ultracapacitor system (i.e. 2.3%) when compared to the results of Manhattan cycle (i.e. 0.4%).
The Case Study-2
The performance of the proposed power split strategy has been compared with that of alternative rule based power split strategy given in [26]. In simulation studies, the design parameters used in the alternative strategy have been chosen as PMin 20kW,PB_Add 4kW and
kW 0 1
50kW, _
B Add
Min P
P for Manhattan and UDDS cycles, respectively.
Figure 15-16 show the frequency of occurrence of battery C-rate ranges in the case of performing the proposed and the alternative strategies for Manhattan and UDDS cycles, respectively.
1C<x<=2C 2C<x<=3C 0
2 4 6 8 10 12
C rate Categories (x=C rate)
F
re
q
u
e
n
c
y
o
f
o
c
c
u
rre
n
c
e
(%
)
Proposed strategy Alternative strategy 11
12
[image:16.596.187.403.559.730.2]0.4 2
1C<x<=2C 2C<x<=3C
0 2 4 6 8 10 12 14
C Rate Categories (x = C rate)
F
re
q
u
e
n
c
y
o
f
o
c
c
u
rre
n
c
e
(%
)
Proposed strategy Alternative strategy 12.3
2.3
[image:17.596.152.436.96.328.2]3.2 13
Figure 16. Battery C-rate distribution of proposed and alternative strategies for UDDS cycle. As can be seen from Figure 15, the frequency of occurrence of battery current in 1C-2C range is 11% and 2C-3C range is 0.4% for the proposed strategy. However, these are 12% and 2% for alternative strategy. Thus, with the proposed strategy, the frequency of occurrence of battery current has been reduced by %1 and %1.5 in the range of 1C-2C and 2C-3C rates for Manhattan cycle, respectively.
13 14 15 16 17 18 19 20
0 50 100 150 200 250 300 350
Time (s)
C
u
rr
e
n
t
(A
)
Proposed strategy Alternative strategy
[image:17.596.181.444.487.693.2]
Similar results have been obtained for UDDS cycle as well. For this cycle, with the proposed strategy, the frequency of occurrence of battery current has been reduced by %0.7 and %0.9 in the range of 1C-2C and 2C-3C rates, respectively. Although, the difference of results obtained with both strategies is small, it can be significant when considering that the bus is operating whole day (i.e. the long driving time). For example, for consecutive Manhattan cycles which last 72 minutes, the duration of high current in 2C-3C range drawn from the battery is approximately one minute more when applying the alternative strategy. Furthermore, the optimum values of PMin and PB_Add parameters in alternative strategy are determined empirically by performing several time consuming simulation runs for each driving cycle condition.
The variation of battery current during acceleration periods has been also investigated for the proposed and alternative strategies in Figure 17 for Manhattan cycle.
From Figure 17, it is seen that the current drawn from the battery is much smoother and the peak battery current is much less during aggressive acceleration period when the proposed strategy is used. Similar results can be obtained for UDDS cycle as well.
6. CONCLUSIONS
References
1. S. Zhang, and N. Pan, Advanced Energy Materials, 5 (2015)
2. M. Jayalakshmi, and K. Balasubramanian, International Journal of Electrochemical Science, 3 (2008) 1196
3. S. M. Chen, R. Ramachandran, V. Mani, and R. Saraswathi, International Journal of Electrochemical Science, 9 (2014) 4072
4. R. A. Dougal, S. Liu and R. E. White, IEEE Transactions on Components Packaging Technologies, 25 (2002) 120
5. R. M. Schupback, J. C. Balda, M. Zolot, and B. Kramer, Power Electronics Specialist Conference, 1 (2003) 88
6. A. C. Baisten, and A. Emadi, IEEE Transactions on Vehicular Technology, 53 (2004) 199 7. L. T. Lam, and R. Louey, Journal of Power Sources, 158 (2006) 1140
8. A. Lajunen, IEEE Vehicle Power and Propulsion Conference, (2010) 1
9. H. Yu, S. Cui, and T. Wang, IEEE Vehicle Power and Propulsion Conference, (2008) 1 10. P, Bubna, S. G. Advani, and A. K. Prasad, Journal of Power Sources, 199 (2012) 360 11. A. Burke, International Journal of Energy Research, 34 (2010) 133
12. C. Xiang, Y. Wang, S. Hu, and W. Wang, Energies, 7 (2014) 2874 13. H. W. He, R. Xiong, and Y. H. Chang, Energies 3 (2010) 1821
14. J. J. Awerbuch, and C. R. Sullivan, Energy 2030 Conference, (2008) 1
15. E. Ozatay, B. Zile, J. Anstrom, and S. Brennan, American Control Conference, 5 (2004) 4716 16. H. A. Borhan, and A. Vahidi, American Control Conference, (2010) 5031
17. D. H. Shin, B. H. Lee, J. B. Jeong, H. S. Song, and H. J. Kim, International Journal of Automotive Technology, 12 (2011) 125
18. T. Azib, C. Larouci, A. Chaibet, and M. Boukhnifer, IEEJ Transactions on Electrical and Electronic Engineering, 9 (2014) 548
19. H. Zhao, and A. F. Burke, Fuel Cells, 10 (2010) 879
20. M. Dudek, P. Tomczyk, P. Wygonik, M. Korkosz, P. Bogusz, and B. Lis, International Journal of Electrochemical Science, 8 (2013) 8442
21. Y. Lv, H. Yuan, Y. Liu, and Q. Wang, First International Conference on Pervasive Computing Signal Processing and Applications, (2010) 1209
22. V. A. Shah, S. G. Karndhar, R. Maheshwari, P. Kundu, and H. Desai, International Conference on Industrial and Information Systems, (2009) 408
23. C. B. Salah, and M. Ouali, International Journal of Energy Research, 36 (2012) 130 24. S. Meshram, G. Agnihotri, and S. Gupta, Chinese Journal of Engineering, 2013 (2013) 1 25. C. M. Close, D. K. Frederick, and J. C. Newell JC, Modeling and analysis of dynamic systems,
John Wiley & Sons, (2002)
26. R. Carter, A. Cruden, and P. J. Hall, IEEE Transactions on Vehicular Technology, 61 (2012) 1526