Int. J. Electrochem. Sci., 11 (2016) 1041 - 1054
International Journal of
ELECTROCHEMICAL
SCIENCE
www.electrochemsci.orgFacile Preparation of Water-processable Biochar Based on Pitch
Pine and Its Electrochemical Application for Cadmium Ion
Sensing
Guangbin Liu1 , Linjian Li1, Kun Zhang2, Xiaoqiang Wang1,*, Juan Chang1, Yingying Sheng1,2, Lin Bai1, Yangping Wen1,*
1
Key Laboratory of Applied Chemistry, Jiangxi Agricultural University, Nanchang 330045, China. 2
Jiangxi Institute of Red Soil, Nanchang, 330046, China. *
E-mail: [email protected], [email protected]
Received: 18 November 2015 / Accepted: 15 December 2015 / Published: 1 January 2016
The water-processable biochar (BC) based on pitch pine was prepared by dispersing these grinded micropowders into carboxymethyl cellulose (CMC) mixed aqueous dispersion for electrochemical sensing of cadmium ion (Cd2+) in real samples. Biochars was obtained by pyrolyzing the pitch pine under oxygen-limited conditions at 600 °C. Montmorillonite (MMT) was employed for enhancing surface area, adsorption capacity, ion-exchange ability and dispersive stability. Carboxymethyl cellulose was selected for enhancing water-dispersive ability, film-forming ability, adhesive ability. BC-CMC-MMT composites displayed synergistically enhanced ability like surface area, adsorption capacity and stripping response towards Cd2+, which was employed as cost-effective electrode modified material for voltammetric determination of Cd2+ in linear range of 2.0 × 10⁻⁸ – 8 × 10⁻⁵ M with limit of detection of 6.7 nM, remarkable selectivity, and good practicability. Satisfactory sensing performance indicated that low-cost water-processable BC has practical values and serves as sensing material for electrochemically determining heavy metal ions in real samples.
Keywords: Biochars, Sensors, Water-dispersiblity, Electrochemistry, Cadmium ion
1. INTRODUCTION
pollution remediation, increase crop yields by improving soil fertility, and ease greenhouse effect by mitigating the climate crisis. The wide availability of raw materials and broad prospects for industrial applications of BCs has becoming research hotspot in agriculture, climate, environment, and other related fields. More recently, a large amount of reviews have been published for the theory, production, properties, characterization and application of BCs [1-10].
In recent three years, BCs have been being employed as energy materials and sensing materials for application in fuel cells [11-17], sensors [18-21], batteries [22-25], supercapacitors [26-35], and others [10]. Moreover, properties of BCs for the electrochemical application in different fields were also reported [36, 37]. However, the as-obtained BCs are generally solids with diverse shapes and inherently insoluble and infusible, thus the characterization and processability of biochars were hampered by their insolubility and infusibility, which limited their potential application in different fields, especially electrode modified materials for electrochemical application. It is worth noting that only materials that are able to combine superior properties with processability have the chance to be considered for the mass production of various devices and materials. Thus water-processable BCs have more practical value and commercial prospect for the academic and industrial application.
In our previous work, carboxymethyl cellulose (CMC) was selected to not only disperse both carbon nanotubes and montmorillonite (MMT) [38], but also built a synergistically enhanced ability such as surface area, adsorption capacity and stripping response, especially electrochemical sensing performance [38-40]. In this work, the pitch pine (Pinus rigida Miller var. serotina (Michx.) Loud.ex Hoopes) was using for the preparation of BC, and then BC was dispersed in water system in combination with both CMC and MMT. Finally, the water-dispersible BC based on pitch pine containing MMT was employed as electrode modified material for voltammetric determination of Cd2+ in real samples.
2. MATERIALS AND METHODS
2.1 Chemicals and reagents
BC based on pitch pine was purchased from experimental base in Jiangxi Agriculture Univirsity, CMC was bought from Tokyo Chemical Industry. MMT and CdCl2 were obtained from J&K Co., Ltd. CH3COONa, CH3COONa and CH3COOH were obtained from Tianjin Yongda Chemical Reagent Co., Ltd. 0.1 M Acetate buffer solution (ABS) with different pH was prepared using 0.1 M CH3COOH and 0.1 M CH3COONa. Cd(II) aqueous solutions were prepared from chlorate salts of metal. The rice was obtained from the experimental field in Jiangxi Agricultural University. All reagents were analytical grade without further purification. All solutions were prepared by doubly distilled water.
2.2 Apparatus
system including glassy carbon electrode (GCE, diameter of 3 mm), platinum wire (Pt, Φ=1 mm) and saturated calomel electrode (SCE). The GCE or modified GCE served as a working electrode, the Pt wire was used as a counter electrode and SCE acted as a reference electrode. The pH was measured using a CT-6023 portable pH meter (Shanghai Jingmi Instrument, China). Scanning electron microscopy (SEM) was used by a JSM-6701F microscope (JEOL Ltd., Japan). FTIR spectra were recorded on fourier transform infrared spectrometer.
2.3 Preparation of biochar
The yields of BCs decreased when the temperature increased from 350 to 700 °C, but BCs kept a more stable form of carbon with high resistance to heat with the increases of pyrolysis temperature, and the pyrolytic volatiles like low molecular weight organics and gases were generally degraded at a lower pyrolysis temperature [41]. Thus BC based on pitch pine was prepared at 600 °C using a muffle furnace. The pitch pine was cut into pieces and air-dried by an electric thermostatic drier. And then fast pyrolysis of the raw material was performed for 2 h using a sealed iron pot under oxygen-limited conditions. The prepared BC were rapidly moved to a room temperature zone with a nitrogen atmosphere and allowed to cool. The BC powders based on pitch pine was obtained by grinding for 30 min using a mortar, and collected after being passed through a 88 μm mesh screen.
2.4 Dispersion of biochar
The 4 mg mL−1 MMT was obtained by sonication in CMC aqueous solution with different concentrations. 2 mg mL−1 CMC aqueous solution was selected as the optimal concentration of CMC. Subsequently, both MMT and BC were mixed manually in a mortar and pestle for at least 30 min for the homogenization. Then 4 mg mL−1 MMT-BC was dispersed by sonication in 2 mg mL−1 CMC. After optimizing, the stable aqueous dispersion of CMC-MMT-BC was obtained (CMC and BC as well as MMT were 2 mg mL−1, 4 mg mL−1 and 4 mg mL−1, respectively).
2.5 Preparation of modified electrode
Prior to modifying the electrode, the GCE was carefully polished on chamois leather containing 0.05 μm alumina slurry and rinsed thoroughly with the doubly distilled water between each polishing step, then sonicated with the doubly distilled water, ethanol, and doubly distilled water for 5 min, respectively, and dried in air afterwards. The CMC-MMT-BC/GCE was prepared by drop-coating 5 μL CMC-MMT-BC aqueous dispersion on the surface of bare GCE and dried in infrared lamp.
2.6 Experimental measurements
s. The Cd2+ was detected by square wave anodic stripping voltammetry (SWASV) unde r optimized conditions. Cadmium was deposited at -1.2 V for 150s by the reduction. The anodic stripping (oxidation of cadmium to cadmium ions) of electrodeposited cadmium was carried out in -1.1 – -0.5 V, their frequency and amplitude are 15 Hz and 25 mV, respectively. The content of Cd2+ in real sample has been detected under the same experimental conditions. All experiments are of five replicate.
3. RESULTS AND DISCUSSION
3.1. MMT-CMC-BC aqueous dispersion
[image:4.596.126.472.471.637.2]BC powders based on pitch pine hardly dissolve in water. So a dispersant that can make BCs for dispersion in water is a very necessary. The CMC was selected as a dispersant for the dispersion of BC micropowders based on pitch pine. In addition, the MMT could also disperse well after sonication using CMC, and the formed mixed dispersed solution was more stable than the single dispersed solution [38]. As can be seen form Figure 1. The pure BC (Figure 1A) and MMT-CMC-BC (Figure 1B) seem to be dispersed in water during ultrasonic oscillations, but the pure BC quickly detached from the water after ultrasonic oscillations, and formed precipitates on the bottom surfaces (Figure 1C). The CMC-BC could form aqueous dispersion after ultrasonic oscillations, and the precipitates gradually appeared with the passage of time. Interestingly, the aqueous dispersion of MMT-CMC-BC (Figure 1D) is more stable than the aqueous dispersion of CMC-BC. Although the aqueous dispersion of CMC-BC also formed precipitates on the bottom surfaces with the passage of time, MMT-CMC-BC could easily form homogeneous and stable aqueous-dispersion again after small vibration or mechanical stirring.
Figure 1. The photographs of BC (a) and MMT-CMC-BC (b) in water after ultrasonic oscillations, and the fresh prepared samples (A) and the sample after 5 days of stationary cultivation (B).
3.2 Surface morphology of MMT-CMC-BC film
MMT was a flaky texture reflecting its layered structure (Figure 2B). The MMT-BC-CMC film was an uneven-layered structure, and formed dense and intimate film with bright flaky aggregates (Figure 2C and D). Therefore, both CMC and BC were coated in the interlamellar surface of MMT, forming mostly flat and aggregated morphology. In addition, the rough and layered structure of MMT-CMC-BC suggested that MMT-CMC-MMT-CMC-BC composite seem to have a large specific surface area [38].
Figure 2. SEM images of CMC film (A, magnification, 10,000×), MMT film (B, magnification, 10,000×), and MMT-CMC-BC film (C, magnification, 2,000×, and D, magnification, 20,000×)
3.3 FT-IR analysis
[image:5.596.109.489.181.519.2]
MMT, Si–O stretching vibration, Al-O stretching and Si-O bending vibration resulted from strong absorption bands at 1044, 540, and 444 cm−1 respectively[38].
4000 3200 2400 1600 800
BC
BC/MMT/CMC
Transmitt
ance
( a
. u.)
[image:6.596.158.443.134.368.2]Wavenumber (cm-1)
Figure 3. FT-IR spectra of BC and BC-CMC-MMT
3.4 Optimum of experimental parameters
Metal ions were generally detected by anodic stripping voltammetry that are preconcentrated on the surface of working electrode during a deposition step and then oxidized at the electrode during the stripping step. SWASV was used to optimize the parametric condition of BC composite electrode for the SWASV detection of Cd2+.
3.4.1 Effect of different modified electrodes
-1.00 -0.95 -0.90 -0.85 -0.80 -0.75 -1
0 1 2 3 4
d
c
b
I
/
A
E / V (vs. SCE) a
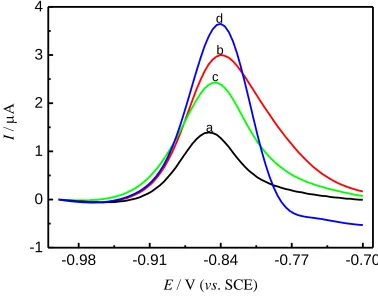
Figure 4. Electrochemical behaviors of Cd2+ in ABS at bare GCE (a), MMT-CMC/GCE (b), BC-CMC/GCE (c), and MMT-CMC-BC/GCE (d).
3.4.2 Effect of different composite ratios
Different ratios of both MMT and BC dispersed by CMC were obtained to study the influence of their different ratios on the change of sensing performance for the SWASV detection of Cd2+. Clearly, the peak current first increased, and then decreased with the increasing ratios of both MMT and BC (Figure 5), this is because that the larger amounts of MMT or BC at the surface of electrode resulted in the decrease of the electroconductibility, the proper proportion both MMT and BC enhanced the stripping signals, and peak currents remarkably increasing. Ratios with1:1of both MMT and BC achieved maximum response of the peak current, which was used for following experiments.
-0.98 -0.91 -0.84 -0.77 -0.70 -1
0 1 2 3 4
e d
c b
I
/
A
E / V (vs. SCE)
a
[image:7.596.168.431.76.266.2] [image:7.596.176.428.499.690.2]
3.3 .2 Effect of treatment methods
Functional groups of BC may change in strong acid or strong alkali medium, which may result in the change of sensing performance for the SWASV detection of Cd2+. BC was soaked in 1M nitric acid or sodium hydroxide for 24 h, then different BCs treated with nitric acid or sodium hydroxide were washed repeatedly with double deionized water to remove residual nitric acid or sodium hydroxide, and dispersed and prepared modified electrodes using methods mentioned-above. Finally, Effect of treatment methods on the SWASV detection of Cd2+ was studied. Clearly, different BCs via the treatment of nitric acid or sodium hydroxide were worse for the detection of Cd2,while BC without the treatment displayed higher peak current response was than other two (Figure 6).
-0.98
-0.91
-0.84
-0.77
-0.70
-1
0
1
2
3
4
d
c b
I
/
A
E
/ V (
vs
. SCE)
[image:8.596.105.483.261.557.2]a
Figure 6. Effect of treatment methods on sensing performance for the SWASV detection of Cd2+. Bare GCE (a), MMT-CMC-BC treated with nitric acid/GCE (b), MMT-CMC-BC treated with sodium hydroxide /GCE (c), MMT-CMC-BC/GCE (d).
3.3.3. Effect of pH
-0.98 -0.91 -0.84 -0.77 -0.70
-1 0 1 2 3 4
I
/
A
E / V (vs. SCE)
[image:9.596.184.420.73.254.2]PH=3 PH=4 PH=5 PH=6 PH=7 pH=8
Figure 7. Effect of pH using SWASV in ABS containing 100 nM Cd2+.
3.3 .4 Effect of deposition potentials
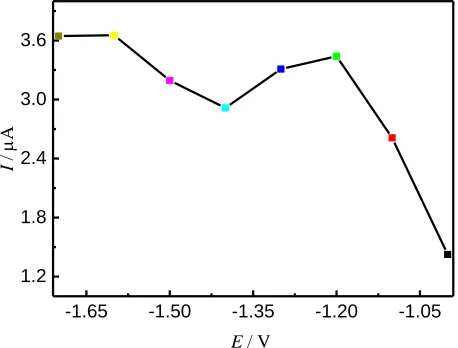
Deposition potentials are very important to achieve the best sensitivity in stripping analysis. Thus the effect of deposition potentials on peak currents after 150s accumulation was studied in the potential range from -1.0 to -1.7 V in 0.1 M ABS (pH=5.0). The increment of stripping peak currents for Cd2+ increased when deposition potentials shifted from -1.0 to - 1.2 V, and peak currents for Cd2+ reached a maximum at - 1.2 V(Figure 8), which was used for the following experiments.
-1.65 -1.50 -1.35 -1.20 -1.05
1.2 1.8 2.4 3.0 3.6
I
/
A
E / V
Figure 8. The effect of deposition potentials using SWASV in ABS containing 100 nM Cd2+.
3.3 .5 Effect of deposition time
[image:9.596.181.410.438.612.2]
suggesting that the electrode is saturated by Cd2+ when the deposition time is beyond 160 s. Namely, the deposition time of 160 s was selected.
0 50 100 150 200 250 300
1.8 2.4 3.0 3.6 4.2 4.8 I / A
[image:10.596.102.499.581.736.2]T / s Deposion
Figure 9. The effect of deposition time using SWASV in 0.1 M ABS (pH=5.0) containing of 100 nM Cd(II).
3.4. Linear range
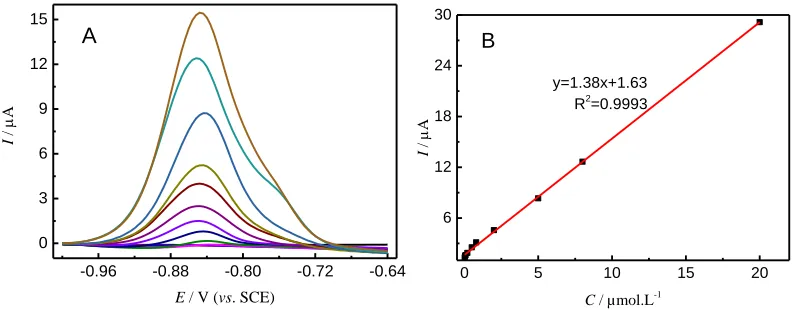
After optimization of different parameters, additions of Cd2+ using optimized conditions were investigated. A series of voltammograms in ABS containing Cd2+ with different concentrations on MMT-CMC-BC/GCE after preconcentration for 150 s are shown in Figure 10. The peak height versus added concentration of Cd2+ was found to produce linear ranges. The regression equation is y = 1.38x + 1.63 with a correlation coefficient of 0.9992. The fabricated sensor displayed good linear range from 2×10⁻⁸
to 2×10⁻⁵, indicating that the proposed method could be used for the trace detection of Cd2+. The fabricated sensor had lower detection limit toward Cd2+ than most recently reported electrochemical methods for detection of those metal ions (Table 1).
-0.96 -0.88 -0.80 -0.72 -0.64
0 3 6 9 12 15 I / A
E / V (vs. SCE)
A
0 5 10 15 20
6 12 18 24 30 I / A
C / µmol.L-1 y=1.38x+1.63
R2
=0.9993
B
Table 1. A comparison of the analytical performance of modified electrodes based on different materials for the electrochemical determination of Cd2+
Materials pH Buffer solusion Linear rang LOD Ref
CPEM (BC) 7.0 0.1 M PBS 25-500 µM 0.69 nM [18]
Sn/NA/MWCPE 4.0 0.11 M ABS 8.90-711.68 nM 1.16 nM [45]
BDD/GCE 4.67 0.1 M ABS 0.18-2.17 µM 8.90 nM [46]
MWCNT/P1,5-DAN 4.5 0.1 M ABS 0.035–1.33 μM 28.47 nM [47]
PDA@Fe3O4/mGCE 5.0 0.1 M ABS 20–590 nM 920 nM [48]
Au-Ph-AuNP 7.0 0.1 M ABS 0.1-100 nM 0.1 nM [49]
NanoBiE/GCE 4.5 0.1 M ABS 44.64-535.71 nM 3.57 nM [50]
L/MWCNTs/CPE 3.0 B-R buffer 1.78-205.36 nM 0.72 nM [51]
NH2-MCM-41/GCE 4.1 0.2 M ABS 0.45-4.02 µM 8.93nM [52]
MMT-CMC-BC/GCE 5.0 0.1 M ABS 0.02-20 µM 6.7 nM This work
3.5. Stability of MMT-CMC-BC/GCE
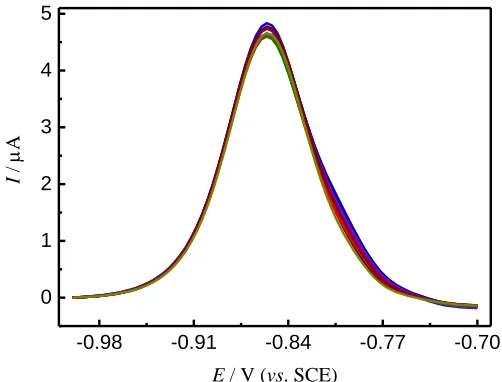
The stability of the modified electrodes is very important. The stability of the MMT-CMC-BC/GCE was obtained by keeping the electrode immersed in ABS for ten days (Figure 11). The response of peak currents displayed a satisfactory stability during these days (4.713±0.0653mA) with relative standard deviation (RSD) of 1.637% under these conditions.
-0.98 -0.91 -0.84 -0.77 -0.70 0
1 2 3 4 5
I
/
A
E / V (vs. SCE)
Figure 11. The sensing stability of MMT-CMC-BC/GCE for ten days. 3.6. Interferences
[image:11.596.176.427.431.622.2][image:12.596.108.491.148.266.2]
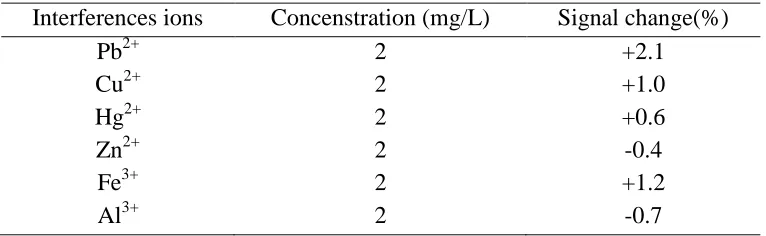
potential of Cd2+, even no electrochemical activity, the tolerance limits was estimated to less than 3% of the error, indicating a good selectivity of the proposed sensor.
Table 2. Effect of other metal ions on peak currents on the detection of Cd2+
Interferences ions Concenstration (mg/L) Signal change(%)
Pb2+ 2 +2.1
Cu2+ 2 +1.0
Hg2+ 2 +0.6
Zn2+ 2 -0.4
Fe3+ 2 +1.2
Al3+ 2 -0.7
3.7. Practical application
[image:12.596.113.480.460.517.2]The MMT-CMC-BC/GCE was used for determining Cd2+ in rice. The results were listed in Table 3, clearly, the recoveries of the determining Cd2+ in rice sample using MMT-CMC-BC/GCE in the range of 97.0–101.8%. This result indicated that the determination of Cd2+ content in real samples was feasible and applicable, suggesting the MMT-CMC-BC/GCE has practical significance and can determine the content of Cd2+ in real samples.
Table 3. The detection and recoveries of Cd2+ in rice sample using MMT-CMC-BC/GCE
Sample Spiked (M) Found (M) Recovery (%)
Rice
- - -
2×10⁻⁷ 2.04×10⁻⁷
101.8 5×10⁻⁶ 4.93×10⁻⁶
98.6
4. CONCLUSIONS
ACKNOWLEDGEMENTS
The authors would like to acknowledge the financial support of this work by the NSFC (51302117), Jiangxi Provincial Department of Education (GJJ14289 & GJJ14301), Jiangxi Provincial Department of Environmental Protection (JXHBKJ2013-4).
References
1. S. Sohi, E. Krull, E. Lopez-Capel, and R. Bol, Adv. Agron., 105 (2010) 47.
2. D. Woolf, J.E. Amonette, F.A. Street-Perrott, J. Lehmann, and S. Joseph, Nature commun., 1 (2010) 56.
3. S. Sohi, E. Lopez-Capel, E. Krull, and R. Bol, Biochar, climate change and soil: A review to guide future research, CSIRO Glen Osmond, Australia, 2009.
4. L. Beesley, E. Moreno-Jiménez, J.L. Gomez-Eyles, E. Harris, B. Robinson, and T. Sizmur, Environ. Pollut., 159 (2011) 3269.
5. M. Ahmad, A.U. Rajapaksha, J.E. Lim, M. Zhang, N. Bolan, D. Mohan, M. Vithanage, S.S. Lee, and Y.S. Ok, Chemosphere, 99 (2014) 19.
6. S. Meyer, B. Glaser, and P. Quicker, Environ. Sc. Technol., 45 (2011) 9473. 7. R.S. Kookana, Soil Res., 48 (2010) 627-637.
8. D. Mohan, A. Sarswat, Y.S. Ok, and C.U. Pittman, Bioresource Technol., 160 (2014) 191.
9. T. Xie, K.R. Reddy, C. Wang, E. Yargicoglu, and K. Spokas, Crit. Rev. Environ. Sci. Technol., 45 (2015) 939.
10.K. Qian, A. Kumar, H. Zhang, D. Bellmer, and R. Huhnke, Renew. Sustain. Energ. Rev., 42 (2015) 1055.
11.T. Huggins, H. Wang, J. Kearns, P. Jenkins, and Z.J. Ren, Bioresource technolog., 157 (2014) 114. 12.A. Elleuch, A. Boussetta, J. Yu, K. Halouani, and Y. Li, Int. J. hydrogen energ., 38 (2013) 16590. 13.Y. Yuan, T. Yuan, D. Wang, J. Tang, S. Zhou, Bioresource technolog., 144 (2013) 115.
14.A. Elleuch, A. Boussetta, K. Halouani, and Y. Li, Int. J. Hydrogen Energ., 38 (2013) 16605. 15.J. Yu, Y. Zhao, and Y. Li, J. Power Sources, 270 (2014) 312.
16.A. Elleuch, K. Halouani, and Y. Li, J. Power Sources, 281 (2015) 350.
17.H. Yuan, L. Deng, Y. Qi, N. Kobayashi, and J. Tang, The Scientific World J., (2014). http://dx.doi.org/10.1155/2014/832850.
18.T.M. Suguihiro, P.R. de Oliveira, and E.I.P. de Rezende, A.S. Mangrich, L.H.M. Junior, and M.F. Bergamini, Bioresource Technol., 143 (2013) 40.
19.P.R. Oliveira, A.C. Lamy-Mendes, E.I.P. Rezende, A.S. Mangrich, L.H.M. Junior, and M.F. Bergamini, Food chem., 171 (2015) 426.
20.P.R. de Oliveira, A.C. Lamy-Mendes, J.L. Gogola, A.S. Mangrich, L.H.M. Junior, and M.F. Bergamini, Electrochim. Acta, 151 (2015) 525.
21.D. Agustini, A.S. Mangrich, M.F. Bergamini, L.H. and Marcolino-Junior, Talanta, 142 (2015) 221. 22.X. Gu, Y. Wang, C. Lai, J. Qiu, S. Li, Y. Hou, W. Martens, N. Mahmood, and S. Zhang, Nano Res.,
8 (2015) 129.
23.D.J. Ryu, R.G. Oh, Y.D. Seo, S.Y. Oh, and K.S. Ryu, Environ. Sci. Pollut. Res., 22 (2015) 1405. 24.H. Zhang, F. Yu, W. Kang, and Q. Shen, Carbon, 95 (2015) 354.
25.H. Jin, X. Wang, and Z. Gu, Mater. Focus, 2 (2013) 497.
26.L. Zhang, J. Jiang, N. Holm, and F. Chen, J. Appl. Electrochem., 44 (2014) 1145. 27.H. Jin, X. Wang, Z. Gu, and J. Polin, J. Power Sources, 236 (2013) 285.
28.J. Jiang, L. Zhang, X. Wang, N. Holm, K. Rajagopalan, F. Chen, and S. Ma, Electrochim. Acta, 113 (2013) 481-489.
30.M. Genovese, J. Jiang, K. Lian, and N. Holm, J. Mater. Chem. A, 3 (2015) 2903.
31.R.K. Gupta, M. Dubey, P. Kharel, Z. Gu, and Q.H. Fan, J. Power Sources, 274 (2015) 1300. 32.L. Wang, X. Li, J. Ma, Q. Wu, and X. Duan, Sustain. Energ., 2 (2014) 39.
33.S. Koutcheiko, and V. Vorontsov, J. Biobased Mater. Bio., 7 (2013) 733. 34.H. Jin, X. Wang, Y. Shen, Z. Gu, J. Anal. Appl. Pyrolysis, 110 (2014) 18. 35.A.M. Dehkhoda, N. Ellis, E. Gyenge, J. Appl.Electrochem., 44 (2014) 141.
36.L. l pfel, M. Keiluweit, M. Kleber, and M. Sander, Environ. Sci. Technol., 48 (2014) 5601. 37.L. Zhao, X. Cao, W. Zheng, Q. Wang, and F. Yang, Chemosphere, 136 (2015) 133.
38.S.S Lu, L. Bai, Y.P. Wen, M.F. Li, D. Yan, R. Zhang, and K.J. Chen, J. Solid State Electrochem., 19(2015) 2023.
39.H. Zhang, J.K Xu, Y.P Wen, Z.F. Wang, J. Zhang, and W.C Ding, Synthetic Met., 204 (2015) 39. 40.J. Zhang, J.K. Xu, Y.P. Wen, Z.F. Wang, H. Zhang, and W.C. Ding, J. Electroanal. Chem., 751
(2015) 65.
41.K.H. Kim, J.Y. Kim, T.S. Cho, and J.W. Choi, Bioresource Technol., 118 (2012) 158. 42.J.M. Novak, W.J. Busscher, D.W. Watts, D.A. Laird, M.A. Ahmedna, and M.A. Niandou,
Geoderma, 154 (2010) 281.
43.B.B. Uzun, E. Apaydin-Varol, F. Ateş, N. Özbay, and A.E. P t n, Fuel, 89 (2010) 176.
44.Y. Luo, M. Durenkamp, M. De Nobili, Q. Lin, and P. Brookes, Soil Biol. Biochem., 43 (2011) 2304. 45. Z. Wang, G. Liu, L. Zhang, and H. Wang, Ionics, 19 (2013) 1687.
46. T. Zhang, C. Li, B. Mao, and Y. An, Ionics, 21(2015) 1761.
47. H. D. Vu, L. H. Nguyen, T. D. Nguyen, H. B. Nguyen, and T. L. Nguyen, Ionics, 21(2015) 571. 48. Q. Song, M. Li, L. Huang, Q. Wu, Y. Zhou, and Y. Wang, Anal. Chim. Acta, 787 (2015) 64. 49. G.Z. Liu, Y. Zhang, M. Qi, and F.J. Chen, Anal. Methods, 7(2015) 5619.
50 . L. Wang, Z. Chen, M. Megharaj, and Naidu, R. Microchim. Acta,181(2014), 1199.
51. Afkhami, A., Khoshsafar, H., Bagheri, H., and Madrakian, T. (2014). Mater. Sci. Eng., C 35 (2014) 8.