This is a repository copy of
Limitations of Monoolein in Simulating Water-in-Fuel
Characteristics of EN590 Diesel containing Biodiesel in Water Separation Testing
.
White Rose Research Online URL for this paper:
http://eprints.whiterose.ac.uk/134267/
Version: Accepted Version
Article:
Arouni, H, Farooq, U, Goswami, P orcid.org/0000-0003-1488-409X et al. (2 more authors)
(2018) Limitations of Monoolein in Simulating Water-in-Fuel Characteristics of EN590
Diesel containing Biodiesel in Water Separation Testing. SAE International Journal of
Fuels and Lubricants, 11 (3). pp. 229-238. ISSN 1946-3960
https://doi.org/10.4271/04-11-03-0012
[email protected] https://eprints.whiterose.ac.uk/ Reuse
Items deposited in White Rose Research Online are protected by copyright, with all rights reserved unless indicated otherwise. They may be downloaded and/or printed for private study, or other acts as permitted by national copyright laws. The publisher or other rights holders may allow further reproduction and re-use of the full text version. This is indicated by the licence information on the White Rose Research Online record for the item.
Takedown
If you consider content in White Rose Research Online to be in breach of UK law, please notify us by
1
Limitations of Monoolein in Simulating Water-in-Fuel Characteristics of EN590
Diesel containing Biodiesel in Water Separation Testing
Abstract
In modern diesel fuel a proportion of biodiesel is blended with petro-diesel to reduce
environmental impacts. However, it can adversely affect the operation of nonwoven
coalescing filter media when separating emulsified water from diesel fuel. This can be due to
factors such as increasing water content in the fuel, a reduction in interfacial tension (IFT)
between the water and diesel, the formation of more stable emulsions, and the generation of
smaller water droplets. Standard water/diesel separation test methods such as SAE J1488
and ISO 16332 use monoolein, a universal surface-active agent, to simulate the effects of
biodiesel on the fuel properties as part of water separation efficiency studies. However, the
extent to which diesel/monoolein and diesel/biodiesel blends are comparable needs to be
elucidated if the underlying mechanisms affecting coalescence of very small water droplets in
diesel fuel with a low IFT are to be understood.
To address this challenge, test fuels composed of reference diesel (REF diesel)/biodiesel and
REF diesel/monoolein were experimentally studied to determine fuel properties such as IFT,
water content, and dynamic viscosity, as well as online droplet size distributions with reference
to IFT. It was found that biodiesel and monoolein do not influence the IFT of water in fuel in a
comparable manner and resulting water droplet size distributions are substantially different.
Fuels blended with biodiesel exhibited higher viscosity and water content than fuel freshly
blended with monoolein. Online measurement of water droplet sizes revealed substantially
smaller water droplets in biodiesel blends compared to monoolien blends at the same IFT
measured using offline tensiometry. These results may be instructive for the development of
standard test methods that simulate the effect of biodiesel blends in fuel-water separation, as
well as for improving the design of fuel-water separation systems.
Keywords: Biodiesel; Monoolein Surfactant, Coalescence; Water separation; Fuel
characterization.
1. Introduction
Emission control regulations established by The United States Environmental Protection
Agency (EPA) and the council of the European Union, have led to the development of a
standard diesel fuel composition known as EN590, as well as high-pressure common-rail
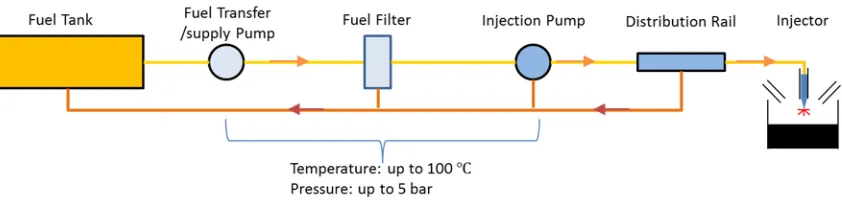
(HPCR) injection systems (Figure 1) [1, 2]. The EN590 fuel is composed of Ultra-Low Sulphur
Diesel (ULSD), up to 7% of which is composed of biodiesel, and a variety of fuel performance
enhancement additives. In HPCR systems, microlitres of fuel are injected in to the engine
2
for fuel injection have reduced to a micrometre scale [3, 4]. Such a sensitive system requires
highly efficient fuel-water separation to ensure water-free fuel is presented to the injection
system and serious damage such as wear and corrosion as well as formation of biological
sludge and sediments in the fuel lines are avoided [1, 5-12].
Evaluation of the water separation performance of filters depends on their end use, and
standards such as SAE J1488 and ISO 16332 define the test conditions required [13, 14].
These laboratory tests are usually conducted using a base reference grade diesel fuel that is
free of solid contaminants or biodiesel but is blended with a specified surfactant (surface active
agent) such as monoolein, which alters the fuel’s interfacial tension (IFT), the water
separability of such fuels can also be measured using a sedimentation test (ASTM D1401).
The approach is based on the theory that a low IFT will result in small droplet sizes (< 25 m [13]), which should simulate more challenging fuels such as EN590 diesel. Fuel additives in
EN590 fuel are known to act as surfactants, which are amphiphilic and able to lower the
interfacial tension (IFT) of oil/water emulsion phases resulting in small, stable droplets that are
[image:3.595.90.511.380.482.2]a challenge for water separation.
Figure 1 Simple schematic of a high-pressure common rail fuelling (HPCR) system: orange arrows show the fuel feeding direction and red arrows shows return of excess fuel to the tank
A threshold of 200 ppm ( ) total water in diesel fuel is defined by the EN590 standard as
an acceptable level by Original Equipment Manufacturers (OEMs) in Europe and North
America [4, 15]. However, in reality the total water level of fuel within the vehicle tank can
increase because of condensation as well as the conditions under which the fuel is maintained
during storage, transfer, and transport from the refinery to the petrol station. There may also
be differences in dissolved water content due to variations in fuel composition resulting from
blending biodiesel. Biodiesel is more hygroscopic than petro-diesel and has affinity to water
due to the presence of alkyl-esters and the unsaturated molecular structure, such that the
3
Water in a diesel fuelling system can take three forms: dissolved, free (settled), or emulsified,
depending on circumstances [1, 22-25]. In a vehicle fuel tank, where agitation is minimal,
water and diesel can form a single interface because the liquids are immiscible, and the
interfacial tension (IFT) is measured at the interface surface. The free water is disturbed when
it is exposed to the shear stress of the fuel moving through the fuel pump, such that it forms a
spherical interface in the form of an emulsified water droplet in the fuel.
The dispersed water is characterised by its droplet size distribution (DSD), which depends on
the type and specification of the fuel pump and fluid parameters governing the fluid shear
stress, Pa (Equation 1), which includes the velocity gradient of the fluid layers, s and the dynamic viscosity, Pa s . The water and fuel IFT, N m governing the internal Laplace pressure of the water droplet, is also important, where is the droplet
radius (Equation 2) [24, 26, 27].
Equation 1 Shear stress in a fluid
Equation 2 Laplace pressure across the surface of a spherical droplet
The shear stress of the bulk fuel competes with the internal Laplace pressure of the water
droplet to rupture it, such that at a given flow rate, the probability of smaller water droplets in
the fuel of higher viscosity and lower IFT, increases.
In water-in-fuel emulsions of high internal energy, dispersed droplets tend to collide and
coalesce into larger droplets, and this droplet enlargement process continues until a single
interface between the two phases is achieved [24, 27-29]. Equation 3 indicates the settling
velocity ( ) of a droplet with a density of and a radius of , settling down in a bulk fuel with
a viscosity of and a density of , where is the acceleration due to gravity.
Equation 3 Settling velocity of a water droplet dispersed in fuel
The breakdown of the emulsion requires time, which can be of the order of hours if the
emulsion is stabilised by surface active agents in the fuel [1, 22-24, 27, 28, 30]. In real vehicle
4
composed of amphiphilic molecules that reduce the water/fuel interfacial tension (IFT) and
stabilise small size water droplets in the fuel [1, 7-10, 31-34]. Therefore, the droplets have low
settling velocities and also the surfactants can prevent droplet enlargement by inducing
resistance to coalescence and the formation of repellent and/or electrostatic barriers between
the water droplets.
Petiteaux [4] demonstrated that 20:80 blends of biodiesel/petro-diesel reduce water
sedimentation and IFT by 1.5% and 19% respectively, and that B20 (blend of 20% biodiesel
in petro-diesel v/v) fuel can possess a saturation level more than twice that of petro-diesel.
Other studies [13, 15, 35] found that the IFT and water separation behaviour of blends
containing more than 20% biodiesel are very similar to pure biodiesel (B100), and the change
in both parameters does not hold as the proportion of biodiesel increases up to B100.
However, a thorough search of the relevant literature yielded no consistent explanation for this
behaviour. Tang [15] claimed that the fuel viscosity can almost double if biodiesel is blended
with petro-diesel, which can be beneficial for capturing small, solid particles, e.g. <20 .
However, the addition of biodiesel can reduce water separation efficiency owing to the
influence of biodiesel on IFT. It has also been reported that the total water content of diesel
measured in the tank of a vehicle can be as high as 5000 (v v) ppm [4, 26], and pure biodiesel (B100) can have a water saturation content of ≥1300 ppm [13, 15, 35]. Moreover, Yoshino et
al. [13] using the ISO 16332 test stand methodology, claimed that the addition of just 5%
biodiesel (B5) can reduce water separation efficiency in the fuel from 95% to 85% due to a
decrease in the fuel IFT (22.9 to 12.9 ) as well as increase the separation time
(13s to 150s - according to the sedimentation test, ASTM D 1401).
The presence of surfactants also influences water separation from diesel. Petiteaux [4] and
Schutz [34] reported that water separation from ULSD fuel is more challenging than Low
Sulphur diesel due to the presence of additives that modify lubricity, cetane number, and the
level of deposits in ULSD fuel. They also suggested that in the presence of surfactants, a
decrease in IFT is time-dependent due to the dynamic movement of surfactant molecules from
the bulk fluid to the water/fuel interface. Moreover, a study of different types of surfactant
revealed no absolute correlation between associated changes in IFT and that of water
separation (sedimentation of water droplets) [4, 34]. This is in agreement with the results of
Pangestu [1], which suggested that droplet size and its persistence in an emulsion is not only
driven by IFT, but also by the ability of the surfactant to stabilise dispersed droplets from
coalescence.
Although the impact of biodiesel and surfactants on water-in-fuel emulsion properties and
water separation has been previously investigated, comparative data on water droplet size
distributions and water separation performance associated with blends of diesel/biodiesel and
5
surfactant/petro-diesel blends can be compared in terms of water/diesel IFT and water droplet
size distribution in fuel is crucial to understand their roles in water separation. Such
understanding is needed to underpin development of improved coalescing filter media that are
less sensitive to fuel composition as well as to inform the development of new standard test
methods. Accordingly, the aim of this work was to investigate the emulsion properties and
water droplet size distribution (DSD) characteristics of Rapeseed oil Methyl Ester (RME)
biodiesel and the surfactant monoolein (Sigma® 1-Oleoyl-rac-glycerol) when blended in
petro-diesel fuel. Monoolein (Sigma® 1-Oleoyl-rac-glycerol) was selected in light of its
recommended application in the SAE 1488 and ISO 16332 standard test procedures. The
interfacial tension, fuel water content, dynamic viscosity, and density of the fuel were also
elucidated using standard test procedures.
2. Experimental methods
2.1. Preparation of test fuel blends
Biodiesel blends were prepared by mixing pure rapeseed oil methyl ester (RME) biodiesel
(B100, Carcal B100 RME (Off-road) - Petrochem Carless Limited, UK), into an additive-free
reference grade diesel (REF) (CEC RF-06-03 diesel - Hess Corporation, Germany). Biodiesel
oxidation levels were not measured, but all fuels for testing were extracted from unopened
barrels. Diesel fuel blends were designated as Bi where i = the volume fraction of biodiesel
( ) x 100%. B5 therefore consists of a blend of REF and 5% biodiesel. The petro-diesel and
surfactant blends were prepared by mixing a specified volume (ppm) of monoolein
((1-(cis-9-Octadecenoyl)-rac-glycerol, density of 969 kg/m3), Sigma Aldrich UK) in the reference grade
diesel (Mi), where i = the volume fraction of monoolein ( ) x 1000000. M200 therefore refers
to a blend of REF with 200 ppm monoolein ( ).
2.2. Fuel characterisation
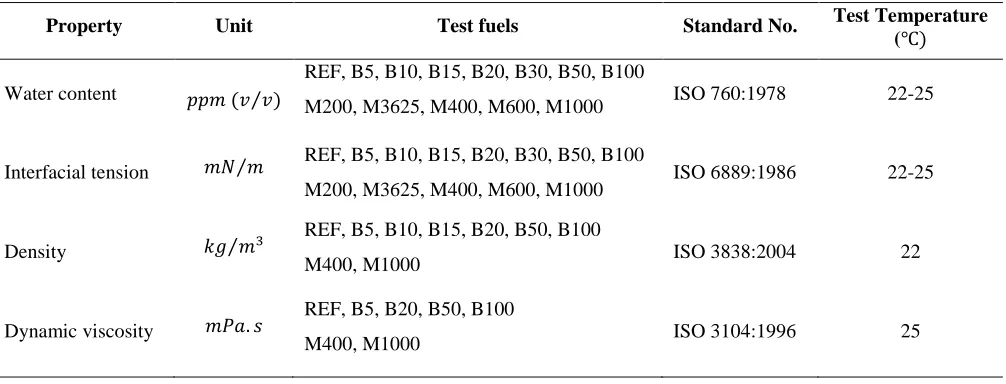
The characterisation methods and test fuels used for each method are summarised in Table
6
Table 1: Fuel properties and their standard test procedures
Property Unit Test fuels Standard No. Test Temperature
(
Water content
REF, B5, B10, B15, B20, B30, B50, B100
M200, M3625, M400, M600, M1000 ISO 760:1978 22-25
Interfacial tension REF, B5, B10, B15, B20, B30, B50, B100
M200, M3625, M400, M600, M1000
ISO 6889:1986 22-25
Density
REF, B5, B10, B15, B20, B50, B100
M400, M1000 ISO 3838:2004 22
Dynamic viscosity
REF, B5, B20, B50, B100
M400, M1000 ISO 3104:1996 25
Water content was measured using a coulometer (Metter-Toledo-C20 Compact Karl Fischer)
and the IFT was determined using the Wilhelmy plate method via tensiometry (Kruss K20
Easy Dyne force) based on five replicates per sample. The fuel densities were measured using
a 25 ml capillary-stoppered pycnometer, with two replicates per sample. The dynamic viscosity (mPa s) of the test fuels was calculated according to ISO 3104:1996, based on measurement of the Kinematic viscosity (mm s) and density. Kinematic viscosity was measured using a BTI® viscometer (BS/U-tube, size B) for the REF, monoolein blends and
B5. A Technico® viscometer (BS/IP/SL size 1) was used to measure fuels containing blends
of more than 20% biodiesel (B20). According to the ISO 3105 standard, at least two
measurements were performed for each test sample to enable an average of the flow time to
be calculated.
2.3. Water separation via the sedimentation test
The sedimentation test used to determine resistance to coalescence modulated by biodiesel
and monoolein content in the test fuels followed the ASTM D1401-12E1 test procedure with
small modifications. Herein, 40ml of REF, B5, B20, B50, M200, and M325 was separately mixed with 10 ml distilled water in a measuring cylinder for 30 s at 1000-12500 r min-1 using a
MICROSEP® emulsifier (ASTM D7261 – 13) at room temperature. After emulsification, the
fuel blends were compared semi-quantitatively by recording the volume of the coalesced water
versus time for the test fuels. More time is required to recover the total volume of water if the
water-in-fuel is stable, there is more resistance to coalescence in the emulsion, and water
droplets exhibit low settling velocity.
B5 and M200, and B20 and M325, were directly compared due to the similarity in their
7
consider the effect of viscosity on the water separation as it has the same IFT as B20 but
higher viscosity than other fuel blends. REF fuel was used as the control sample.
2.4. Water Droplet size distribution (DSD)
An emulsion generation test rig equipped with an online droplet size measurement system
(Insitec Malvern® particle size analyser) was employed to characterise water droplet size
distribution in the test fuels. The in-house built rig emulsifies 0.2% (v/v) Deionised water in a
test fuel and measures droplet size distribution at both atmospheric and four bar static
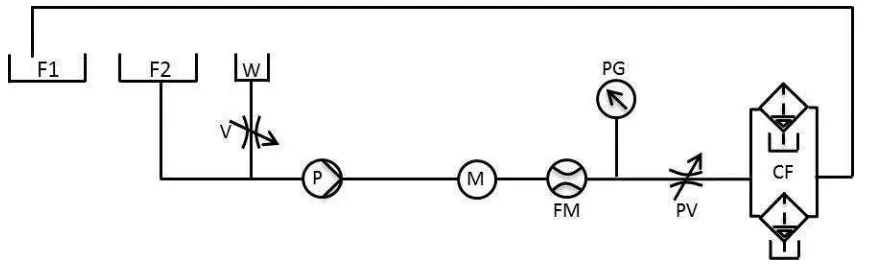
pressures. A schematic of the test rig is shown in Figure 2. The rig consists of one circuit
enabling a single-pass test through a particle sizer for analysis of droplet size distribution. The
Parker Nicholas pump (Heavy Duty Engine Platform Gerotor, 5000 r min-1, 24V~7 /min @ 6
bar) (P) circulates at least 10 of a fresh test fuel from the reservoir (F2) at a flow rate of 6
m, through the particle size analyser (M), flowmeter (FM), and high efficiency Parker Racor Dmax® clean-up filters (CF). Deionised water reserved in the tank (W) at the suction side of
the main pump (P) is injected into the system by opening the valve (V) via pump suction or
based on the hydrostatic pressure in the tank. Once injection is started, fuel is collected in the
storage reservoir (F1) instead of tank F2 to provide a single pass emulsion test. The injection
rate was constant at 12 during a water injection experiment of 1 min. To run a test at
the higher pressure, the pressure valve (PV) was adjusted to reach 4 bar static pressure using
the same procedure.
[image:8.595.74.510.456.590.2]
Figure 2. Schematic of the emulsion generation test rig
Water droplet sizes were measured over a range of 0.1 m to 2500 m during injection using laser diffraction at a wavelength of 670nm. The received data from thirty-two detectors for the
angular variation in intensity of light scattered by dispersed water droplets is interpreted to
calculate their diameter. The REF, B5, B10, B20, B30, B50, B100, M200, M400, M600, and
M1000 fuel compositions were evaluated. The output was an average distribution for a volume
equivalent spherical diameter of the water droplets of the emulsion during the water injection.
8
their cumulative distribution curves. Figure 3 gives an example of the average water droplet
size distribution in the REF fuel. The refractive indices of the fuel blends needed to calculate
[image:9.595.181.415.159.337.2]the droplet size distributions was obtained via a CETI® Abbe refractometer.
Figure 3. Example of an in-line water droplet size distribution during injection for the reference diesel
3. Results and discussions
3.1. Fuel characterisation
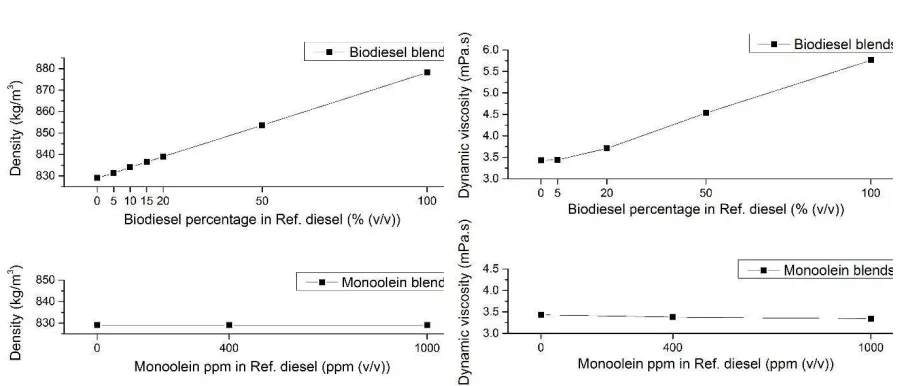
The biodiesel and monoolein blends were of dissimilar density ( ), dynamic viscosity ( ), IFT ( ), and water content ( SE), as illustrated in Figure 4 to
[image:9.595.77.527.530.712.2]9
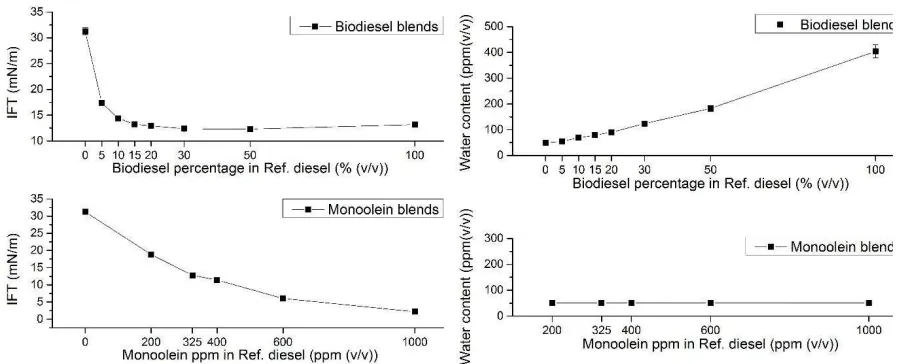
Figure 4. IFT of the biodiesel and monoolein blends
Figure 5. Water content of the biodiesel and monoolein blends
Figure 6. Density of the biodiesel and monoolein blends
Figure 7. Dynamic viscosity of the biodiesel and monoolein blends
Figure 4 confirmed that biodiesel acts as a surface-active agent such that the IFT of the REF
fuel reduced from 31.24±0.73 mN m to 13.17±013 mN m in B100. This is in agreement with findings in the literature [13, 15, 35]. However, it is noteworthy that the trends in the IFT data
for the fuels containing biodiesel and monoolein are not the same when the blend proportions
increase to B100 and M1000 respectively.
As the biodiesel content increases from B20 to B100, the IFT does not continue to decrease,
i.e. the IFT remains almost constant at about 12 mN m for B20, B30, B50, and B100. However, further decreases in IFT are observed as the monoolein content increases. This can
be attributed to the capability of the water and fuel interface to accommodate monoolein
molecules at a concentration of 1000 ppm while the interface is not being saturated by them.
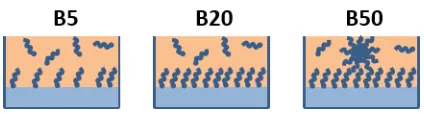
As a result, the IFT decreases by adding more monoolein, (IFT of 2.18 ± 0.12 mN m) for M1000 (Figure 8). This is in contrast to the biodiesel blends containing more than 20% biodiesel in which the interface reaches its saturation point and the behaviour of the interface
is dominated by the chemistry of the biodiesel (Figure 9). This can be explained by comparing
the molar ratios of the biodiesel and monoolein blends. For instance, the molar concentrations
of B20 and M325, which exhibited identical IFTs, were 0.5924 and 0.0009 respectively
(molecular weight of monoolein (C21H40O4) = 356.54 . Note that methyl oleate
(C19H36O2) has a molecular weight of 296.494 and is a typical biodiesel fuel [36]).
Thus, a lower number of monoolein molecules are available to saturate the fuel-water
10
Figure 8:Schematic of the interface of water and monoolein blends
Figure 9: Schematic of the interface of water and biodiesel blends
The water content measurements (Figure 5) reflect the fact that biodiesel has more affinity for
water than petro-diesel. For example, water contents of 49.13±2.79 and
403.94±24.89 were measured for the REF and B100 fuels respectively, which is in
agreement with the findings in the literature [15-21, 37, 38]. This is due to the higher polarity
of the biodiesel molecules (alkyl-esters and unsaturated molecular structure) compared to that
of petro-diesel. However, it is interesting to note that as the proportion of monoolein increases
from zero (REF) up to 1000 ppm (M1000), changes in in the water content of the fuel are not
noticeable. This is also likely to be attributed to a lower molar ratio of monoolein compared to
that of biodiesel in the test fuels, which results in a lower overall hygroscopicity of the
monoolein blends.
According to Figure 6, it was found that a fuel blend containing a higher proportion of biodiesel
exhibits a higher density compared to the reference diesel. This is because the biodiesel (B100) has a higher intrinsic density (878.2 ) and water content (403.94±24.89 )
compared to the REF fuel with a density and water content of 829.1 and 49.13±2.79 respectively, which affects the density of the biodiesel blends. By contrast, there was
no marked change in the density of the monoolein blends resulting from the addition of
monoolein up to 1000 ppm in the REF diesel.
The biodiesel blends exhibited higher viscosities than the REF fuel (Figure 7), e.g. 5.76
in B100 and 3.43 in REF fuel. On the other hand, no variation was observed in the fuel
viscosity of the monoolein blends, which is likely to be connected with the low molar ratio of
[image:11.595.192.404.195.252.2]11
3.1. Water separation via the sedimentation test
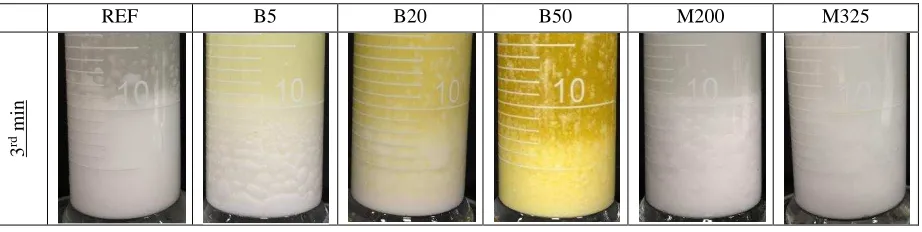
Table 2 summarises the volume of settled water at different time intervals in each of the fuel
samples, and Table 3 demonstrates the appearance of the samples at the 3rd minutes of the
[image:12.595.143.451.177.338.2]test.
Table 2. Water separation (settlement) in the test fuels (ml)
Time (min)
Fuel 1 2 3 4 5 6 7 8 9
REF 8 10 10 10 10 10 10 10 10
B5 4 9 10 10 10 10 10 10 10
B20 - - 7 7 7-8 8 8-9 9 10
B50 - - 7 8 9 9 10 10 10
M200 8 11 10 10 10 10 10 10 10
[image:12.595.70.531.390.506.2]M325 - 5-7 7-9 7-9 10 10 10 10 10
Table 3. Visual assessment of water separation in fuel blends
REF B5 B20 B50 M200 M325
3
rd m
in
It was apparent that the biodiesel blends produced longer settling times compared to the
monoolein blends and the REF fuel, and water droplets were more stable in B20 and B50
compared to the other test fuels. This could be the result of the higher viscosity of the biodiesel
blends as well as their ability to stabilise water droplets of smaller size resulting in a reduction
in the settling velocity of the dispersed water.
Visual assessment of the REF mixture revealed settled water that first appeared milky in colour
but which gradually cleared. However, in the fuels containing biodiesel and monoolein,
progression from the milky phase to clear water was accompanied by a flocculation phase
containing water. This was indicative of a resistance to coalescence associated with the
presence of the surfactant or biodiesel molecules at the interface of the water droplets.
12
blended fuels, which may be attributable to the relatively high capability of B50 to dissolve
small water droplets.
3.2. Water droplet size distribution
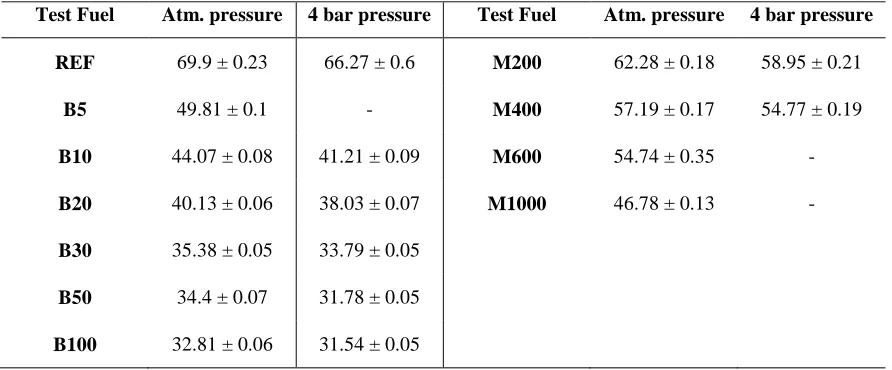
The s of water droplets (mean at atmospheric and 4 bar pressures in the test fuels
are listed in Table 4. The required refractive indexes of the blends for plotting the size
distributions were measured as 1.454 and 1.458 for B100 and B50 respectively, and the same
value of 1.461 for the other fuel blends.
Based on Table 4, of the REF fuel decreased from 69.9 ± 0.23 to 34.4 ± 0.07 m by addition of 50% biodiesel (B50) and reduced to 46.78 ± 0.13 by addition of 1000 ppm
monoolein (M1000). This data confirms that both monoolein and biodiesel reduce water
droplet size in the fuel and are able to stabilise water droplets at a lower size compared to the
reference grade diesel at an identical flow rate. Moreover, comparing s at different
pressures shows that by increasing the static pressure during emulsion generation to 4 bar,
smaller droplet sizes were formed compared to atmospheric pressure. This reduction was
observed for all the test fuels. This is of practical significance because in diesel fuel engines,
high pressures are increasingly used, meaning smaller droplet sizes are likely to be
[image:13.595.76.522.469.654.2]increasingly encountered.
Table 4: Dv50( m) of dispersed water droplets in monoolein and biodiesel blends at atmospheric and 4 bar pressures
To characterise monoolein and biodiesel regarding the water droplet size, the of water
droplets in the fuel blends at atmospheric pressure were plotted with regard to the IFT of the
test fuels as shown in the Figure 10.
Test Fuel Atm. pressure 4 bar pressure Test Fuel Atm. pressure 4 bar pressure
REF 69.9 ± 0.23 66.27 ± 0.6 M200 62.28 ± 0.18 58.95 ± 0.21
B5 49.81 ± 0.1 - M400 57.19 ± 0.17 54.77 ± 0.19
B10 44.07 ± 0.08 41.21 ± 0.09 M600 54.74 ± 0.35 -
B20 40.13 ± 0.06 38.03 ± 0.07 M1000 46.78 ± 0.13 -
B30 35.38 ± 0.05 33.79 ± 0.05
B50 34.4 ± 0.07 31.78 ± 0.05
13
Figure 10. Dv50 for dispersed water droplets at atmospheric pressure, related to the IFT of the monoolein and biodiesel blends
Based on Figure 10, at an IFT between 17 and 19 , the of water droplets in B5
was much smaller than that measured for M200 (49.81 ± 0.1 m Vs. 62.28 ± 0.18 m). The of the water droplets in B20 was also smaller than that of M400 at an IFT over a range
of 11 - 13 . This indicates that the biodiesel blends exhibited smaller values
compared to the monoolein blends at corresponding IFT values. Regardless of the chemical
composition of the monoolein and biodiesel molecules, this can be attributed to the lower
molar ratio of the monoolein than the biodiesel in the fuel blends, e.g. 0.5924 and 0.0009
in B20 and M325 respectively, resulting in an inability of monoolein to maintain the IFT
in the emulsion as low as was measured via tensiometry.
During an IFT measurement via tensiometry, the IFT of the interface between the fuel and
water phases is measured while the linear interface is stable and has a constant surface area
during the measurement. However, when the same volume of water is emulsified in the fuel,
the surface area of the fuel-water interface increases, which is because of water droplets
dispersed in the fuel. Therefore, a greater number of surfactant molecule is required to
maintain the IFT of the emulsion at the same value as what is measured via tensiometry. In
the case of the monoolein and biodiesel, there are a greater number of biodiesel molecules in
the biodiesel blends compared to the number of monoolein molecules (Figure 11) such that
the biodiesel blends provide many more surfactant molecules compared to the monoolein
14
A
B
Figure 11: Effects of molar concentration of A) biodiesel and B) monoolein in changing fuel-water interface characteristics in static and dynamic conditions
Based on this and also the fact that the biodiesel blends had a higher viscosity than the
monoolein blends at an identical IFT, water droplets are exposed to a greater shear stress
competing with their lower Laplace pressure in the biodiesel blends compared to the
monoolein blends, which could contribute to the formation of smaller droplets in biodiesel
blends.
4. Conclusion
In this work, the effects of biodiesel and monoolein on the behaviour of diesel fuel in terms of
interfacial tension (IFT), dissolved water content and viscosity were considered, and the
resultant impact on water-in-fuel emulsions was further explored with reference to biodiesel
and monoolein surfactant. Following construction of a bespoke emulsion generation test rig,
online measurements of water droplet size distributions in diesel containing biodiesel and
monoolein were undertaken, and water separation was also evaluated using sedimentation
tests.
In existing test standards, specifically ISO 16332 and SAE J1488, monoolein surfactant is
15
additives including biodiesel in petrol station diesel. However, the results reported herein, raise
questions about the suitability of monoolein as an appropriate fuel additive for the test
standard, because it does not behave comparably with biodiesel. Fuel containing biodiesel
contained more dissolved water and led to higher viscosities compared to the REF fuel and
monoolein blends. This occurs even though biodiesel acts like monoolein as a surface-active
agent, reducing the fuel IFT and stabilising water droplets in the fuel such that flocculation
occurs during water settlement. It is apparent that biodiesel blends and emulsions are capable
of maintaining a low IFT measured by tensiometry. However, this does not happen for
monoolein blends due to differences in the molar ratios. This coupled with the higher viscosity
in a biodiesel blend leads to smaller water droplet sizes compared to monoolein blends. The
effect of the static pressure on DSD was tested by applying 4 bar pressure on the fuel blends
in the emulsion rig, revealing that higher pressures lead to a decrease in the droplet size of
the emulsion, which is independent of the type of additive (biodiesel or monoolein).
Based on the experimental data reported herein, evaluating the droplet size distribution of an
emulsion is thought to be a more useful measure to control surfactant levels in fuel blends
rather than water sedimentation, and IFT measurements.