• No results found

Faceted and dendritic morphology change in alloy solidi cation

N/A
N/A
Protected

Academic year: 2019

Share "Faceted and dendritic morphology change in alloy solidi cation"

Copied!
9
0
0

Loading.... (view fulltext now)

Full text

Loading

Figure

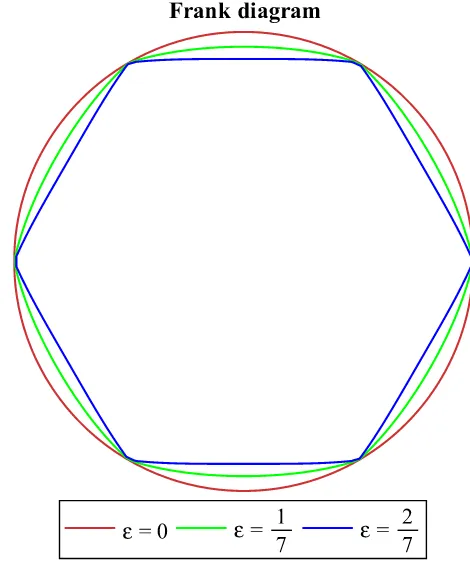
Fig. 1. Polar plot of the function, g ¼ 1 þ � cosð4hÞ, with anisotropy varying fromzero (isotropic – red) to extreme anisotropy (blue)
Fig. 3. The Wulff shape – see text for the construction.
Fig. 4. Polar plots for models with 4-fold faceting in 2D found in the literature. On the left we also include the 4-fold continuous (non facet model) for comparison
Fig. 8. The maximum value of the interface stiffness (at h ¼ p=2), n, as a function ofq given d ¼ 4;� ¼ 0:133
+4

References

Related documents