Astronomy
&
Astrophysics
https://doi.org/10.1051/0004-6361/201834583© ESO 2019
A multi-scale exploration of a massive young stellar object
A transition disk around G305.20+0.21?
?
A. J. Frost
1, R. D. Oudmaijer
1, W. J. de Wit
2, and S. L. Lumsden
11School of Physics and Astronomy, University of Leeds, Leeds LS2 9JT, UK e-mail:[email protected]
2European Southern Observatory, Alonso de Cordova 3107, Vitacura, Santiago, Chile
Received 6 November 2018 / Accepted 6 March 2019
ABSTRACT
Context. The rarity of young massive stars combined with the fact that they are often deeply embedded has limited the understanding of the formation of stars larger than 8M. Ground based mid-infrared (IR) interferometry is one way of securing the spatial resolution
required to probe the circumstellar environments of massive young stellar objects (MYSOs). Given that the spatial-frequency coverage of such observations is often incomplete, direct-imaging can be supplementary to such a dataset. By consolidating these observations with modelling, the features of a massive protostellar environment can be constrained.
Aims. This paper aims to detail the physical characteristics of the protostellar environment of the MYSO G305.20+0.21 at three size-scales by fitting one 2.5D radiative transfer model to three different types of observations simultaneously, providing an extensive view of the accreting regions of the MYSO.
Methods. Interferometry, imaging and a multi-wavelength spectral energy distribution (SED) are combined to study G305.20+0.21. The high-resolution observations were obtained using the Very Large Telescope’s MIDI and VISIR instruments, producing visibilities in theN-band and near-diffraction-limited imaging in theQ-band respectively. By fitting simulated observables, derived from the radiative transfer model, to our observations the properties of the MYSO are constrained.
Results. The VISIR image shows elongation at 100 mas scales and also displays a degree of asymmetry. From the simulated observ-ables derived from the radiative transfer model output we find that a central protostar with a luminosity of∼5×10⁴L
surrounded by a
low-density bipolar cavity, a flared 1Mdisk and an envelope is sufficient to fit all three types of observational data for G305.20+0.21.
The weak silicate absorption feature within the SED requires low-density envelope cavities to be successfully fit and is an atypical characteristic in comparison to previously studied MYSOs.
Conclusions. The fact that the presence of a dusty disk provides the best fit to the MIDI visibilities implies that this MYSO is follow-ing a scaled-up version of the low-mass star formation process. The low density, low extinction environment implies the object is a more evolved MYSO and this combined with large inner radius of the disk suggests that it could be an example of a transitional disk around an MYSO.
Key words. stars: formation – stars: imaging – stars: early-type – stars: individual: G305.20+0.21 – techniques: interferometric – infrared: stars
1. Introduction
Massive stars (≥8M) are important driving factors within our
universe. On the local-scale, the winds, outflows and super-novae (SNe) of massive stars can both inhibit and trigger further stellar formation, replenishing and sustaining turbulence result-ing in the compression and rarefaction of molecular clouds (Krumholz et al. 2014). Massive stars generate photons with energies high enough to ionise hydrogen atoms within their surrounding medium creating features unique to massive pro-tostellar environments such as HII regions (Churchwell 2002). On the larger scale, massive stars change interstellar chemistry, fusing helium into heavier elements through the slow and rapid nuclear processes. Their stellar winds and SNe then distribute this material throughout the interstellar medium, increasing its metallicity. Massive stars are additionally important for extra-galactic studies, allowing the inference of the mass of spatially unresolved galaxies (Kennicutt 2005). SNe ejecta and massive ?Based on observations made with ESO Telescopes at the Paranal Observatory under programme IDs 097.C-0320, 75.C-0755 and 74.C-0389.
stellar winds are also very influential at these large scales and powerful enough to contribute to the galactic super-wind, with stars≥50Mproviding a critical role in the superwind topology
(Leitherer 1994).
Despite their evident importance, the formation of massive stars is poorly understood as their embedded nature, distance and rarity have restricted observational studies. Low-mass young stellar objects (YSOs) evolve through the creation of disks, which appear as the cloud collapses to conserve angular momen-tum and eventually accrete material onto the star. A massive young stellar object (MYSO) is defined as an infrared-bright object that has a spectral energy distribution (SED) that peaks at approximately 100 µm and a total luminosity of greater
than 104L
and it was previously thought that the radiation
Johnston et al. (2015) and Ilee et al.(2016), for example, pre-senting findings of Keplerian-type disks of 12Mand 1–2M
respectively around two MYSOs. The review by Beltrán & de Wit (2016) presents a detailed examination of the types of the disk-like objects around varying sizes of protostar and their accretion properties and note that the nature of the inner regions of the disks of O and B-type stars are far less clear than those of A-type and lower-mass stars. Direct accretion events associ-ated with massive stars have also been observed, with Caratti o Garatti et al. (2017) inferring an accretion event of the order 10−3M
yr−1around the MYSO S255 NIRS 3 when a radio burst
was observed after a maser/infrared accretion event.
By combining observations at multiple wavelengths, differ-ent scales of an astronomical object can be traced. SEDs are multi-wavelength observables, but only provide indirect spa-tial information. Spaspa-tially resolved observations are required to break the SED degeneracy and confirm the origin of protostel-lar emission. In the infrared (IR) wavelength regime one can obtain such observations; its short wavelength range benefits the angular resolution and traces material in protostellar environ-ments at∼100 K. A number of previous works, such asde Wit et al.(2007),Linz et al.(2008) andVehoff et al.(2010), present studies of MYSOs with mid-infrared interferometry in particu-lar.Boley et al.(2013) present a survey of 20 MYSOs with the MID-infrared Interferometer (MIDI) instrument, fitting geomet-ric models to the centralN-band frequency of 10.6µm.de Wit et al.(2010) investigated the MYSO W33A by fitting a radiative transfer model to an SED and MIDI visibilities, concluding that the majority of the mid-infrared emission originates from the outflow cavity walls, in agreement with other works such asDe Buizer(2006). Studies have been done at longer infrared wave-lengths withWheelwright et al.(2012) andde Wit et al.(2009) presenting surveys of MYSOs at∼20 and 24.5µm respectively. Inde Wit et al.(2011), a singular MIDI baseline and an image profile at 24.5µm are fit with a radiative transfer model to
inves-tigate the MYSO AFGL 2136 but given the limited amount of information retrieved from a single interferometric baseline, the constraint on theN-band geometry is therefore lacking.
The work in this paper improves upon these aforementioned studies by simultaneously fitting multiple MIDI configurations, a near-diffraction-limited∼20µm imaging profile and an SED.
By finding a radiative transfer model that optimally fits the MIDI data at 10 mas scales, the VISIR data at 100 mas scales and the SED stretching from near-infrared to millimetre wavelengths, the characteristics and accreting regions of the protostellar environ-ment are probed.
This paper presents our results when this method is applied to the MYSO G305.20+0.21. G305.20+0.21 (henceforth G305) is located at RA 13:11:10.45, Dec −62:34:38.6 (J2000 co-ordinates). The region that houses G305 is littered with Class II maser emission (e.g.Urquhart et al. 2013;Hindson et al. 2010), which has been shown to be exclusively associated with mas-sive star-forming regions (e.g.van der Walt 2011;Pandian et al. 2011). A separate compact HIIregion is present∼1800 west of
the source (Walsh 2002), again implying the presence of massive star formation. A very bright source is also visible∼2200east of
G305 in 870µm maps from the ATLASGAL survey (Schuller
et al. 2009). Walsh & Burton (2006) detect 13CO and HCO+ line wings in the area surrounding G305 implying the presence of outflows, but due to the spatial resolution of their data they cannot discern which source would be powering these emis-sion features. G305 is classified as an MYSO in the Red MSX Source (RMS) survey (Lumsden et al. 2013) and has a listed bolometric luminosity of 4.9×10⁴L
(Mottram et al. 2011) at a
kinematic distance of 4 kpc (Urquhart et al. 2014).Krishnan et al.
(2017) determine a distance of 4.1+1.2
−0.7kpc for a maser parallax of 0.25±0.05 mas.Hindson et al.(2010) findvLSR =−42.0 km s−1 from observations of the NH3(3, 3) line at 24 GHz, correspond-ing to a kinematic distance of 4.74±1.70 kpc.Walsh(2002) find G305 to have a deeply embedded near-infrared source and deter-mine its luminosity to be 2.5×10⁵L
at a distance of 4.5 kpc
based on IMF models and Class II maser emission. Despite this high luminosity they detect no radio emission from the source, conclude that the source is not yet producing ionising photons and that G305 is therefore an MYSO.Liu et al.(2019) included G305 (named as G305B in their paper) in a SOFIA survey of massive star formation supplemented by radiative transfer mod-elling and we discuss our findings in relation to theirs in Sect.5.1. The source was also included in a study of a number of suspected MYSOs byIlee et al.(2013) where the CO band-head emission of the MYSO (as part of a large sample) was modelled and the presence of a disk inferred.
The remainder of this paper is split into five further sections: Sect. 2 – a detailing of the observations, Sect.3 – a descrip-tion of our modelling, Sect.4– a presentation of the results for this object, Sect.5– subsequent discussions and Sect. 6– our conclusions.
2. Observations
In this study of G305, two sets of spatially resolved data in the mid-infrared and an SED are presented. The MIDI data have pre-viously been presented elsewhere and the VISIR data is newly obtained. We describe each of the data sets in the following subsections.
2.1. Previously published interferometric data from MIDI
MIDI (Leinert et al. 2003) is a Michelson-type, two-telescope interferometric instrument at the European Southern Obser-vatory’s (ESO) Very Large Telescope (VLT), able to com-bine light from the 8 m Unit Telescopes (UTs) or the 1.8 m Auxiliary Telescopes (ATs) into two interferometric channels. The channels have a phase difference ofπradians, induced by the half-reflecting combiner plate of the instrument, allowing the cancellation of uncorrelated background photons whilst retain-ing the correlated flux. The beam-combination is done near to the pupil plane while the signal is detected in an image plane. In order to minimise contamination of the data from background and instrumental thermal emission, the optics are cooled to 35 K using a helium closed-cycle cryostat and the array detector is cooled to 10 K. MIDI measures both the correlated and total flux in the N-band using one of two possible dispersive elements, grism or prism.
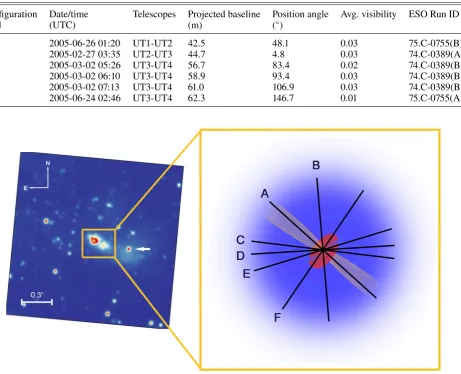
Table 1.MIDI observations of G305.20+0.21.
Configuration Date/time Telescopes Projected baseline Position angle Avg. visibility ESO Run ID
label (UTC) (m) (◦)
A 2005-06-26 01:20 UT1-UT2 42.5 48.1 0.03 75.C-0755(B)
B 2005-02-27 03:35 UT2-UT3 44.7 4.8 0.03 74.C-0389(A)
C 2005-03-02 05:26 UT3-UT4 56.7 83.4 0.02 74.C-0389(B)
D 2005-03-02 06:10 UT3-UT4 58.9 93.4 0.03 74.C-0389(B)
E 2005-03-02 07:13 UT3-UT4 61.0 106.9 0.03 74.C-0389(B)
F 2005-06-24 02:46 UT3-UT4 62.3 146.7 0.01 75.C-0755(A)
Fig. 1.A logarithmically scaled VVVKs-band image of G305.20+0.21 (left). Two lobes are visible separated by a dark lane. The bright point-source (noted with a white arrow) approximately 0.30west of the central object surrounded is a known compact HIIregion. TheKs-band image is
supplemented by a schematic of the suspected MYSO geometry overlain with the projected baselines of each configuration of the MIDI observations (right). In the schematic the envelope is shown in blue, the cavity in yellow and the disk in red.
observation process in general can be found inPrzygodda et al.
(2003),Chesneau et al.(2005) andLeinert(2004).
G305 was observed in 2005 in six distinct telescope config-urations (the details of which are listed in Table1) using three different telescope pairs. The prism mode was used for configu-rations A–D and F and the grism mode was used for configura-tion E. Each configuraconfigura-tion has a different projected baseline and position angle. In order to help illustrate the regions of the proto-stellar environment each configuration may trace, Fig.1presents a VISTA Variables in The Via Lactea (VVV; Minniti et al. 2010) survey Ks-band image displaying G305.20+0.21 and its surrounding area, supplemented with a schematic labelled with each interferometric baseline. We include theKs-band image for illustrative purposes only and do not include it in the fitting pro-cess as it presents another level of complication and the object’s Ks-band flux is already considered in the SED. The VLTI’s baseline capabilities range from approximately 40–120 m and the observations for G305 were taken with baselines between ∼42–62 m. This work attempts to model the entireN-band spec-trum between 7 and 13 µm and as such the range in angular resolution varies from 12 mas (for a 62 m baseline at 7.5 µm) to 31mas (for a 40 m baseline at 12.5µm).
The MIDI measurements of G305 show that the object has a comparatively low correlated flux between 7 and 8µm in the context of the full sample of MYSOs from theBoley et al.(2013) sample. The average overall visibility is 0.03 and the visibility is not constant with wavelength but shows a clear chromatic depen-dency, in part because of the strongly varying opacity within the silicate absorption wavelength region at 9.7µm.
MIDI was decommissioned in March 2015 to make way for the next generation of instruments on the VLTI.
2.2. New 20µm imaging data from VISIR
The VLT Imager and Spectrometer for the mid-InfraRed (VISIR;
to MIDI, particularly envelope emission as based on conclu-sions fromWheelwright et al.(2012). To reduce the amount of noise, the VISIR detector is cooled to∼9 K and observes with short exposure times. Given the large background fluctuations at mid-infrared wavelengths the chopping and nodding technique is used instead of flat-fielding, with chopping frequencies between 2 and 4 Hz and amplitudes of∼1300 (see ESO’s VISIR manual;
Lagage et al. 2004). G305.20+0.21 was observed on 6/7/2016 with good sky conditions (PWV was 0.78 mm) at exposure times of 0.0114 s with a total time-on-target of 45 min. The observa-tions followed an upgrade for the instrument which improved its efficiency by a factor of six and increased its sensitivity (Käufl et al. 2015). The science verification observations post-upgrade were taken in February 2016, the same year as the presented observations. ESO pipelines (version 4.3.1) were used to reduce the data, accounting for chopping and nodding corrections and averaging the subsequent frames to form one image. HD 123139 was observed as PSF standard on the night of the observations with a measured FWHM of 0.4800. The Graphical Astronomy
and Image Analysis Tool (Gaia;Currie et al. 2014) was used to perform aperture photometry on G305 and on three other cali-brator objects (HD 169916, HD 163376 and HD 111915) observed at the VLT. The amount of counts detected within the apertures were compared to the recorded fluxes of the objects and the dif-ference in aperture size was accounted for. This led to a resultant flux density for G305 of 138±7 Jy at 19.5µm.
2.3. Spectral energy distribution (SED)
G305’s source fluxes were compiled from the Red MSX Source (RMS) Survey (Lumsden et al. 2013) and the literature to cre-ate an observational SED for the object. The included fluxes
are 2MASS J, H and K band fluxes, the WISE 3.4 and
4.6µm fluxes, GLIMPSE data at 3.6µm, MSX 14 and 21µm points, the 18 µm flux from De Buizer et al. (2000; taken with the OSCIR instrument at the Cerro Tololo Inter-American Observatory 4 m Blanco Telescope) and the PACS 70 µm flux (obtained through the Herschel/PACS Point Source Catalog1). No GLIMPSE 4.5 µm flux is present in archival data for the source and the GLIMPSE 5.8µm image is saturated so neither
are included. The WISE fluxes are the colour-corrected fluxes for a 200 K black-body emitter. Other wavelength data also exist in the form of the IRAS 60 and 100µm data points and the SIMBA 1.2 mm flux (Faúndez et al. 2004). We do not consider these in our fitting, however, due to the presence of the ATLASGAL core described in Sect.1whose emission is contaminating these measurements. As we cannot reliably separate the two sources, we discard all flux measurements obtained with apertures larger than 2000. We include the 19.5µm VISIR flux mentioned in the
previous section and the flux calibrated MIDI spectrum in the SED fitting. All the included SED fluxes are listed in Table2.
3. Radiative transfer modelling
The model used in this work follows the schematic of an MYSO defined inWhitney et al.(2003); a central protostar surrounded by an envelope, a bipolar outflow cavity and potentially a disk. This is a generalisation of the low-mass star formation geometry of Class I objects (Shu 1977). Given the number of disks present in recent observations of MYSOs and the fact that outflows and dusty envelopes are nearly ubiquitous around MYSOs this is a sensible approximation of the protostellar environment.
[image:4.595.307.552.99.284.2]1 http://archives.esac.esa.int/hsa/legacy/HPDP/PACS/ PACS-P/PPSC/HPPSC_Explanatory_Supplement_v2.2.pdf
Table 2.Fluxes used in the SED.
Source Wavelength (µm) Flux (Jy)
2MASSJ-band 1.25 (3.21±0.09)×10−3
2MASSH-band 1.662 (2.09±0.1)×10−2
2MASSKs-band 2.159 0.113±0.004
WISE 3.4 0.293±0.005
GLIMPSE 3.6 2.23±0.07
WISE 4.6 5.71±0.2
MSX 14 (1.10±0.07)×102
OSCIR 18 117.53±0.29
VISIR 19.5 138±7
MSX 21 (2.66±0.2)×102
IRAS 60 (3.17±0.6)×103
PACS 70 (1.14±0.003)×103
IRAS 100 (8.16±1)×103
SIMBA 12000 (18.5±0.04)
Notes. The italicised fluxes are those omitted from the fitting due to the
considerations discussed in Sect.2.3.
3.1. Description of the code
The 2013 version of the radiative transfer code Hochunk, which is presented inWhitney et al.(2013), was used to perform the radiative transfer modelling in this study. Hochunk uses the radiative equilibrium routines developed byBjorkman & Wood
(2001) in a 3D spherical-polar grid code (Whitney & Wolff 2002). The code is of the Monte-Carlo style, where packets, or in this case “photons”, from the centrally defined source propagate through a defined dusty structure in a random walk and the absorption, re-emission and scattering of those packets are calculated. The code produces results simultaneously at all inclinations and images can be produced at several wavelengths (which can be convolved with broadband filter functions, includ-ing 2MASS, Spitzer, IRAC and Herschel) for comparison to observations. In this work 4×10⁷photons were used to generate images of sufficient quality for post-processing.
Two options exist for the modelling of the protostellar enve-lope; one described by a power-law and the other as a rotating and infalling sphere that defines the density of the envelope according to its infall rate (Ulrich 1976;Terebey et al. 1984). The outflow cavity can be defined in either a conical or polynomial shape, with the polynomial defined as:
z=a$b. (1)
where$= (x2 +y2)12 and constitutes a region in the spherical
envelope with different density properties. The disk descrip-tion has been greatly expanded on from the previous version of the code but is still a flared dust disk overall. It is split into two parts, a small-grain disk and a large-grain disk, each of which have their own defined dust type, scale-height, inner radius and outer radius. One can decide in the overall disk description how much of the total disk mass lies within each of the disks. The disk can also harbour complex features such as warps, gaps and spirals, all of which can be individually defined, making using of the 3D capabilities of the code. These fea-tures are not included in this work and as such we refer to our model as 2.5D. Disk accretion can be included, with the released accretion luminosity adding to the central luminosity of the source.
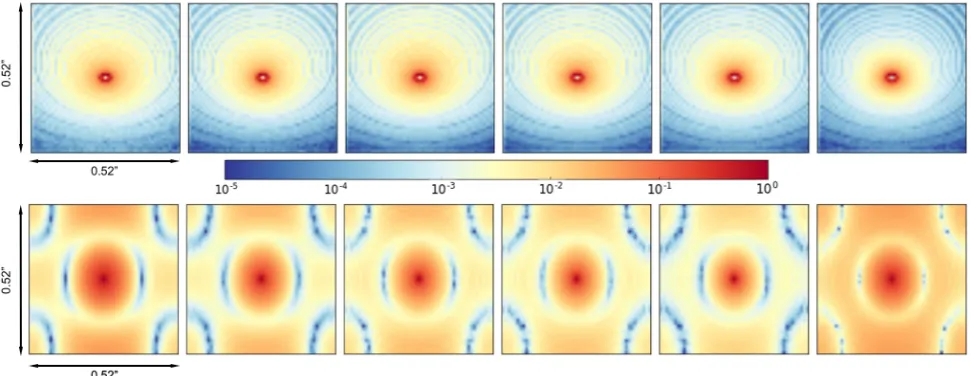
Fig. 2.Logarithmically scaled model images (top row) at 7.5, 8.5, 9.5, 10.5, 11.5 and 12.5µm and their corresponding fast Fourier transforms (bottom row). Each image is 0.5200in width corresponding to the interferometric field of view. The colour bar applies to both sets of images and
represents the number of counts.
grains are the same as those used inWhitney et al.(2003), with a ratio of total-to-selective extinction rv = 4.3 which is typical of star forming regions. The grains are also coated in water-ice mantles that make up 5% of the grain radius. The large grains included in the disk correspond to Model 1 inWood et al.(2002) and are made of amorphous carbon and silicates. Finally, the cavity dust is composed of dust in accordance with the average galactic ISM grain model byKim et al. (1994). The 2013 ver-sion of the code allows for the incluver-sion of polycyclic aromatic hydrocarbons (PAHs) which are added to the aforementioned dust types and were not offered as an option in the previous version of the code. G305 does not display any PAH emission features in its spectrum and as such we removed this emission from the model.
3.2. Simulating observations
In order to simulate the MIDI observations, model images were generated at 7.5, 8.5, 9.5, 10.5, 11.5 and 12.5µm so as to
sam-ple the entireN-band wavelength regime. The images are 0.5200
in size, corresponding to the MIDI slit width, with a pixel size of ∼0.0100. In previous work (e.g. de Wit et al. 2010) the
UT-airy disk was used as the field-of-view and the model images were multiplied with a Gaussian of identical size to this in order to account for the effects of the telescope. In this work we revised this methodology and have instead opted to use the slit-width as the size of our measurements and not to multiply by a Gaussian. This is because the MIDI data reduction pro-cess accounts for the effects of the telescope and removes them, meaning that multiplying the model images to include telescope effects is not necessary when the final aim is to simulate the vis-ibilities, the final product of the data reduction. It is ultimately the slit size that determines the amount of observed emission from the object, and as such we use this as the size of our model images. We checked the result of multiplying the model image by a Gaussian corresponding to the UT-airy disk and note that it increases the resulting visibilities but not to such a degree that alternate conclusions about the MYSO geometry can be made.
Once the model images are generated they were post-processed in Python in order to allow a direct comparison to our observations. Taking the fast Fourier Transform (FFT) of the images provides a fully-filleduvplane from which the visibilities
corresponding to the position angle and baseline of the observa-tions can be extracted. At lower densities gridding effects exist in the model images, creating ring-like structures within the cavity. In order to quantify the effect this may have on the final visibil-ities the model images were convolved with a Gaussian with a FWHM of 10 pixels to remove any high frequency structure and then subtracted from the original model image to isolate the rings and quantify their contribution to the emission. The rings consti-tute approximately 5% of the overall image counts and therefore any effects they may have on the model visibilities are negligi-ble. Example model images are presented in Fig.2, which also pertain to the best-fitting model discussed in Sect.4.2.
In order to simulate the 19.5 µm image a model image of the same field of view as our observations was generated (∼1400
across). This was convolved with the observed PSF standard star from the same night as the observations (HD 123139) in order to accurately include seeing effects on the modelled object. An azimuthally averaged profile of the model image was taken to allow easy comparison to the source and PSF.
To generate an SED the Hochunk post-processing script writ-ten byWhitney et al.(2013) was utilised which extracts the flux and wavelength data from the radiative transfer output. Fluxes from the RMS and the MIDI observations were overlain on the model SED to allow comparison, with the beam-sizes and apertures taken into account in the SED generation.
3.3. Fitting process
Given the very large parameter space of Hochunk it is not effi-cient to automatically fit all three data types and as such the following procedure was utilised. Since SEDs are degenerate (as previously discussed) and theoretically the easiest to fit, this was the starting point for the fitting process. Fitting the MIDI and VISIR data followed and the simulated visibilities and profiles were checked simultaneously as each model parameter was systematically varied. Extreme testing was done to deter-mine whether a parameter was going to affect the datasets. If a change occurred in the simulated observables the values were changed in smaller intervals to then constrain the fit and improve the model. Given the success of the envelope-only model of
of MYSO W33A (de Wit et al. 2010) the same central object (T = 35 000 K,R= 8R), envelope and cavity parameters were
used as a starting point for the modelling of G305. However, the model did not immediately present a satisfactory fit and as such a large portion of the parameter space was varied in attempts to fit the observational data.
The VVVKs-band image shown in Fig. 1 displays a dark lane between two lobes. The lobes are likely to correspond to the bipolar cavities of the object, implying a dense dusty feature lies between them. This led to the inclusion of a disk in the model but we note that due to size of the dark lane (∼200) it is more likely
a result of the shadow of a disk on the surrounding nebulous material. Originally the presence of the lane also led to a priori-tisation of close to edge-on inclinations for the source. However, close to edge-on inclinations do not reproduce well the 19.5µm image as too much emission is present in the model images from the red-shifted cavity lobe so ultimately less extreme inclination solutions were explored. The added disk was experimented with in a number of respects. Its mass was varied between 0.1 and 10 solar masses throughout the fitting. The scale-height of the disk and the scale-height exponent (which affect the curved shape of the disk at greater radii) were also experimented with. The outer radius of the disk was changed on 500–1000 au scales in accordance with the expected radii of disks around other objects and the minimum disk radius was varied in intervals beginning with the sublimation radius (18 au). The inclusion of a puffed-up inner rim and curved inner rim were also tested. The cavity properties such as shape, opening angle and density were varied as they were expected to affect the VISIR profiles. Varied envelope properties include the centrifugal radius, infall rate and its minimum and maximum radii. The inclination is a parameter that has the power to affect all the simulated observables and as such a compromise had to be made when deciding on the final value. A discussion of the effects of varying these parameters can be found in Sect.4.1.
In an attempt to quantify the quality of our fits we calculated the chi-squared for each observation. The chi-squared was calcu-lated separately for each configuration of the MIDI observations and each value combined to determine the best MIDI fit overall. The VISIR chi-squared was calculated from the radial profiles up to the cut-off displayed on the x-axis of the VISIR profiles (Fig. 4, see Sect. 4), which is the point at which the MYSO profile falls to the level of the background noise. The SED chi-squared was calculated from six data points, corresponding to the filter wavelengths at which the post-processing script provides the user with the convolved model fluxes allowing for an accurate comparison to the observed fluxes. We do not, however, calcu-late an overall chi-squared for all three observations and decide on a best fit on the basis of overall minima. As the observations all trace different material, one can argue that finding an overall chi-squared for the three observations is not a particularly useful exercise. The chi-squared does present use in terms of narrow-ing down the closer fits, especially for the MIDI observations. A variety of different minimum radii for the disk and envelope presented similar fits to the MIDI data and the chi-squared value helped to constrain their values and determine the final best-fit.
4. Results
4.1. General observations
This section discusses the observations made while experiment-ing with the parameter space of the radiative transfer code in the context of each probed scale of the MYSO. The distance is
a parameter that affects all simulated observables. We assume the RMS distance of 4 kpc for G305 and all the following observations are made for this specific distance.
4.1.1. 10 mas scales
The N-band emission depends on a wide number of model parameters, thus complicating the search for an optimal model. The inclusion of a circumstellar disk has an effect on the rel-ative flux contributions of the geometrical structures and the visibilities, making them higher than an envelope-only model. This appears consistent as the disk constitutes a compact emit-ting region and adds a large amount of dense material close to the central object. As such one can expect the visibilities and fluxes to increase at the scales probed by our spatial frequen-cies, especially at the shorter MIDI wavelengths which trace hotter material.de Wit et al.(2010) also find that adding a disk increases the visibilities at 7 and 8µm, and their simulated
vis-ibilities from Fig. 10 of that work are very similar in shape to those presented here.
Any changes to the disk of the object have repercussions on the simulated visibilities but do not affect the simulated VISIR profiles (see Sect. 4.1.2). The scale-height of the disk does not induce large effects and changing the scale-height expo-nent (which affects the curved shape of the disk at greater radii) also results in small effects. Varying the outer radius of the disk affects the simulated visibilities between 10–13 µm only and
effects are small between 1000, 2000 and 3000 au. This outer radius affects the emission at longer millimetre wavelengths, which probe the cooler disk regions, but are not simulated in this work. The minimum disk radius has a significant effect on the simulated visibilities, producing a range of visibility values when the minimum radius is varied between Rsub and 125 au. This is due to the fact that a large amount of emission will be reprocessed by the inner rim presenting a turnover. As the min-imum radius increases past 100 au, the visibilities decrease as more dust is cleared from the inner protostellar regions and the model visibilities become comparable to a no disk-model.
Adding a puffed-up rim increases the visibilities slightly at all wavelengths for the smaller baseline configurations and at 7–8 µm for all configurations. This appears consistent as
the puffed-up rim provides a greater area of dust available for heating and subsequent emission at MIDI’s observed wave-lengths. Changing the inner rim shape from flat to curved results in marginally higher visibilities for Configuration A across the entire N-band spectrum. Since the disk is flared and the scale height at the inner rim is small, one would expect the change in visibilities to be small, if the disk was more toroidal then one would expect a bigger change as the curve of the inner rim would be more pronounced.
Increasing the disk density by varying the disk mass from 1 to 5 and then 10 solar masses while maintaining other disk parameters was also investigated. This increases the visibilities at the extreme ends of theN-band range slightly with the most marked effects found at 7, 12 and 13µm, lowering the 7 and 8µm
mass. A 0.1 solar mass disk, i.e. a disk mass within the regime of those found in Herbig Be systems (e.g.Walsh et al. 2014,2016;
Kama et al. 2016;Boneberg et al. 2016), was tried and this gen-erated little change. From these observations we conclude that theN-band interferometry poorly constrains the total disk mass, which is in agreement with Boley et al. (2016), and conclude that the N-band visibilities are insensitive to most geometrical parameters of the disk for an object of this distance, except those related to the inner rim size and shape.
We note that throughout the fitting process Configuration A was consistently the most difficult to fit. In particular, the 7–8 µm visibilities proved to be systematically inconsistent
with the radiative transfer models that would match the other observables. This configuration has the smallest baseline and is therefore the lowest resolution configuration of the MIDI dataset. It is also the only one aligned with the outflow axis (as dis-played in Fig.1). The model visibilities at 7–9µm are constantly higher than the observed visibilities meaning that the observed emission is less compact than the model predicts. Asymmetri-cal dusty structures along the outflow axis could arise from the entrainment of material during the accretion process. As dynam-ical processes that depend on local conditions are not covered by the radiative transfer model, we can only speculate about the emission’s origin and more data are needed to interpret this plau-sibly. Another potential source of this emission is entrainment from a collimated jet. It is thought that collimated jets are asso-ciated with a number of MYSOs (e.g.Purser et al. 2016,Beuther et al. 2002) and such a collimated jet would lie along the position angle of Configuration A. A jet is not included in our model and as such dusty material that might have been swept up into such a jet and emit would not be replicated in our simulated visibilities, again explaining the difficulties with fitting this configuration. Given these considerations, the fitting of the other configura-tions which are more likely to be accurately represented within the model were prioritised over fitting Configuration A.
4.1.2. 100 mas scales
All the disk parameters mentioned in the previous section have negligible effects on the simulated 19.5µm image. It was found that the most important influences on the emission at this wave-length are the cavity properties, in particular the cavity opening angle and its geometrical shape as captured by the cavity expo-nent (bin Eq. (1)). Since the cavity density is low, the material within it will be more easily illuminated by the central object and the envelope material in the cavity walls will bear the brunt of the stellar emission and be heated. Therefore, the more emis-sion from the cavity that is present, the more extended the emission in theQ-band becomes and the greater the amount of ∼20µm flux. When the cavity exponentbequals 1 it will have
a conical shape as opposed the more curved shape of the poly-nomial cavity that has an exponent other than 1. Because of this change in shape there is less flux at larger scales when mod-elling a conical cavity as it is essentially narrower, presenting a smaller area of cavity wall available for irradiation and sub-sequently a smaller solid angle on the sky for re-emission. The envelope infall rate also affects the∼20µm emission.
Increas-ing the envelope infall rate reduces the flux at larger radii. This appears consistent as more of the envelope mass will be present at smaller radii and within a region that is traced at mid-infrared wavelengths, as opposed to remaining in cooler outer regions that would be better traced by radio and sub-mm data. The affect of the envelope infall rate is less pronounced than the affects of varying the nature of the cavity walls and as such we conclude
that VISIR is predominantly a tracer of cavity wall emission (within the limitations of our adopted dust radiative transfer model).
The remaining factor that influences the∼20µm emission is the inclination, but this affects all types of observation. Push-ing to pole-on inclinations raises the MIDI visibilities, while decreasing the amount of∼20µm flux (as one sees less of the
illuminated cavity wall) and weakening the silicate absorption feature (as the cavity is optically thin) in the SED and as such a compromise needed to be found throughout the fitting. If the inclination is increased towards 50◦for this source, more 19.5µm
emission from the red-shifted cavity lobe is visible in the model images that is not observed in the source. The ultimately adopted value for the inclination of the modelled object is 35◦. This lies
within the range of inclinations found from the five best fit-ting models ofLiu et al.(2019) and is similar to the inclination derived in Ilee et al. (2013) of 43◦. The final value was
cho-sen as 35◦ because for higher inclinations the flux short-ward
of the silicate absorption feature was too great and the depth of the silicate absorption feature in the SED was slightly too deep.
4.1.3. The total flux
Factors that can change the shape of the whole model SED are the size of the central illuminating star (mass, radius and temperature are the definable parameters within the code), the inclination and the distance. The inclination is also one of many parameters that affects the silicate absorption feature at 9.7µm.
As the inclination is increased from a pole-on inclination (0◦)
to an edge-on inclination (90◦) the silicate absorption feature
deepens (an illustration of which can be found inWhitney et al. 2003). This is because edge-on inclinations probe the densest regions of the infalling envelope and disk of the MYSO, while pole-on inclinations probe the much less dense outflow cav-ity. MYSOs are known to be very dusty objects so one would expect the silicate absorption feature to be very prominent, but theN-band spectrum for G305 displays a weak silicate absorp-tion feature. This implies that a closer to pole-on inclinaabsorp-tion for the model would provide a satisfactory fit to this feature. How-ever, theKs-band VVV image implies the presence of a second lobe and as such higher inclinations were trialled leading to a final inclination of 35◦.
The silicate absorption feature has long been an indicator of the extinction towards a source (e.g.Henning & Guertler 1986,
Boley et al. 2016) and the interstellar extinction can be varied within the SED post-processing. A small amount of interstel-lar extinction best satisfies the model SED’s silicate absorption feature, allowing it to remain small enough to fit the observed MIDI total fluxes. The appearance of two cavity lobes in the Ks-band already implies that the total extinction towards the source is lower than the average found in MYSOs, and when compared to other MYSOs such as AFGL 2136 (de Wit et al. 2011) the silicate absorption feature is indeed much weaker. This implies that most of the compact (<100) N-band emission
Table 3.Parameters of the preferred model.
M? L? Temp. i d Rminenv Rmaxenv Rc M˙infall θcav ncav Mdisk Rmindisk Rmaxdisk Aforv
(M) (L) (K) (◦) (kpc) (au) (au) (au) (Myr−1) (◦) (g cm−3) (M) (au) (au)
25 48 500 35 000 35 4 60 5×10⁵ 2000 7.5×10⁻⁴ 12 8.35×10⁻²¹ 1 60 2000 1
Notes. The level of constraint on each of the quoted values is discussed in Sect.4.
scales, while the spatial filtering of MIDI limits this contribution. They fit a power-law spectrum with an additional foreground screen of material with a column density and dust composition (independent of projected baseline or position angle) to the cor-related flux for each of their sources. They found that G305 was one of the few sources whose correlated flux was not adequately reproduced by this model implying that the absorbing material is not largely uniform, detached from the scales traced by MIDI and that spatial effects may be present.
The total cavity optical depth in the line of sight (or the cavity density and path length) also affects the silicate absorp-tion feature. The cavity density used in de Wit et al. (2010) of approximately 1×10⁻¹⁸g cm−3 results in a very deep sili-cate absorption feature (as observed in the case of the MYSO W33A) and our final model uses a lower density. Making the cavity opening angle greater also increases the depth of the sili-cate absorption feature in the model SED and as such the largest the cavity opening half-angle could be was 12◦. This is different
to the half-angles found by the fittingLiu et al. (2019) of≥27◦
and we discuss this in Sect.5.1.
The envelope parameters affect the SED across its wave-length range. Increasing the infall rate of the envelope deepens the silicate absorption feature and also increases the 70 µm peak of the model SED. Increasing the maximum radius of the envelope factor shifts the entire SED to longer wavelengths and severely lowers the 70 µm peak of the SED when pushed to
sizes of order 107au (a value tried during the extreme testing mentioned in Sect.3.3). The 70µm peak is an important photo-metric point to fit as it essentially describes the total flux of the MYSO. The 70µm flux increases because the optical thickness increases, and the colder part of the emission becomes more sub-stantial. Making the disk around the central object more massive slightly increases the flux in theJ-,H- andK-bands and results in increases of the flux at the SED peak. As such a lower mass disk provided a more satisfactory fit.
4.2. Best-fitting model
The systematic variation of the properties discussed in the pre-vious section and the consideration of the chi-squared values for the MIDI fits finally amounts to the best-fitting model whose parameters are shown in Table3. The central protostellar object of this model possesses a luminosity of 4.85×10⁴L
for the
RMS distance of 4 kpc, which is in very good agreement with the RMS bolometric luminosity of 4.9×10⁴L
. In order to
sat-isfy the MIDI visibilities, a disk of order ∼1 solar mass (the exact mass is poorly constrained as discussed in Sect.4.1.1) is required ranging in size from 60–2000 au in radius. The enve-lope has a centrifugal radius of 2000au, chosen to be consistent with the outer radius of the disk, and the infall rate of the enve-lope is 7.4×10⁻⁴M
yr−1. The cavity opening angle is 12◦and
the cavity density is 8.35×10⁻²¹g cm−3.
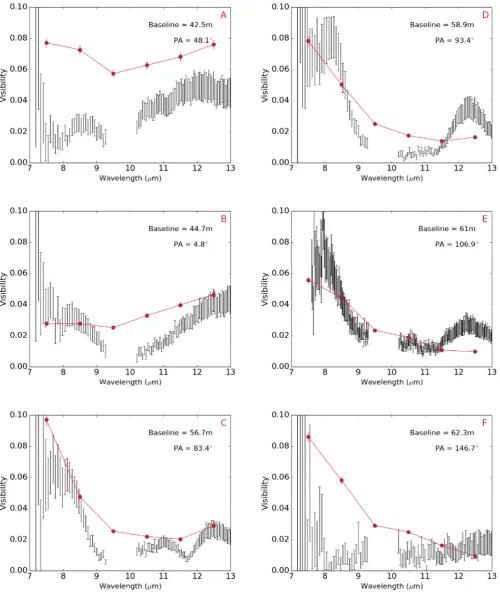
Figure 3 presents the MIDI visibilities for each observed configuration of G305, with the observed visibilities being
shown in black and the simulated model visibilities being shown in red. For all baselines, we see a depression in the visibil-ity spectrum around the silicate absorption indicating that the emission region at around those wavelengths is larger than the adjacent N-band wavelengths. Telluric absorption impairs flux measurements between 9.3 and 10.2µm and as such they
have been omitted. Any observations below 7.5 µm or above 13.3µm are outside of theN-band and compromised by
atmo-spheric absorption, so our visibilities are plotted between these values only. The errorbars of the simulated visibility points account for the error induced by the artificial ring structures dis-cussed in Sect. 3.3. The emission seen in Fig. 2 is relatively extended resulting in the low visibilities seen in Fig. 3. The images also suggest that the inner regions of the cavity walls become progressively fainter with wavelength (with the excep-tion of the 9.5 and 10.5 µm images) with an increase in the typical emitting size and the subsequent production of lower visibilities.
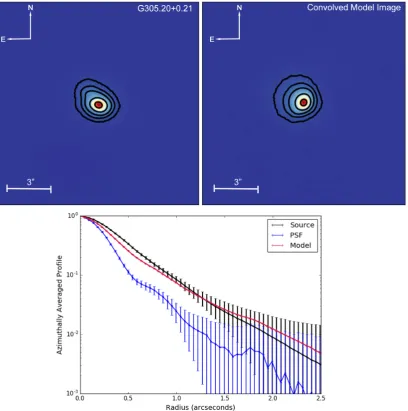
Figure 4 shows the VISIR image for G305, the convolved model image and their subsequent radial profiles. The contours represent 2, 5, 10, 25 and 75% of the peak flux and the error bars represent the rms within a given annulus. The secondary lobe seen in the VVV Ks-band image is also visible in the VISIR image (albeit it at low percentage contours of ∼0.2% of the peak flux). Figure5 presents a combination of the two images, illustrating that their emission coincides and confirm-ing the location of the secondary lobe. When aKs-band model image was generated for the source the secondary lobe was not visible in the normal intensity images. However, images detail-ing the polarised emission, images of the polarised flux and the QandUStokes images can also be generated. In these images the second lobe is visible, implying that most of the Ks-band emission from the secondary lobe in the VVV image is scattered light.
Figure 6 shows the SED. The fluxes corresponding to the MIDI fluxes are shown as red crosses, included to assure con-sideration of the silicate absorption feature at 9.7µm. The blue diamonds are fluxes from the RMS, the yellow diamond rep-resents the VISIR flux and unfilled green diamonds represent the fluxes from the RMS survey which were omitted due to the considerations made in Sect. 2.3. We note that the near-infrared fluxes show a slightly worse fit than the rest of the SED. G305 has an envelope which will be causing significant levels of extinction and in reality this envelope is unlikely to be as smooth as the one presented by the model. The envelope extinc-tion effects will have a much larger effect on the near-infrared fluxes than others at longer wavelengths in the SED. Given this and the potential for irregularities within the envelope material, fitting of the rest of the SED was prioritised over fitting the near-infrared fluxes.
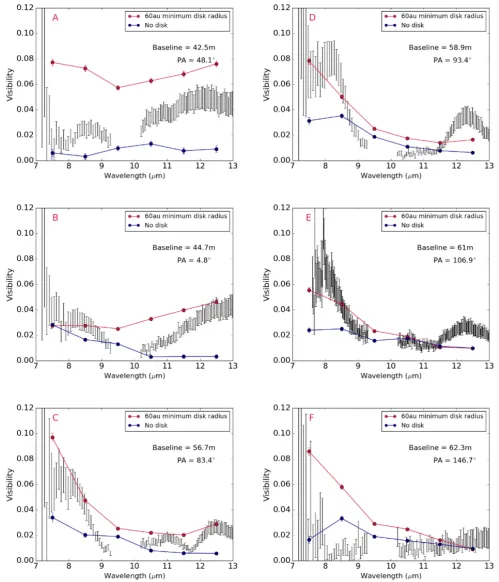
Fig. 3.Observed visibilities for each configuration (black) with the simulated visibilities for each model image (red).
low-density bipolar cavity carved out by the central proto-star and a large-grain disk. We do not include a small grains disk in the model as it presents another layer of complexity which is not conducive to constraining a good fit. The param-eters of the disk were decided in such a way as to match a density feature induced by the Ulrich-type envelope. As the
Fig. 4.VISIR 19.5µm image (top left), convolved model image (top right) and subsequent radial profiles (bottom). The model image was convolved with the PSF of the observed object to accurately mimic the effects of the telescope specific to the observations.
5. Discussion
5.1. Comparisons with previous work
The most notable difference between this final model and the starting point, the envelope-only model ofde Wit et al.(2010), is the addition of a disk. Other significant departures from the enve-lope specification are the centrifugal radius, which is 2000 au as opposed to 33 au, changed to match the outer radius of the added disk. The cavity has the same polynomial shape as de Wit’s work, but in order to successfully fit the silicate absorption feature of the SED the cavity density in our best-fitting model is lower than that presented inde Wit et al.(2010). The central protostar is 30% dimmer than the central protostar required to fit W33A. The fact that W33A does not require a disk to fit its MIDI visibilities while G305 does could be due to their envi-ronments. de Wit et al. (2010) note that while a disk was not visible for W33A, MYSOs viewed at smaller inclinations may reveal the presence of a dusty accretion disk and this could be the case for G305. More recently,Maud et al.(2017) show that at larger scales W33As protostellar environment is very chaotic,
with the spiral-like structures wreathing their way around the central source suggesting a highly turbulent, disturbed environ-ment. This is the antithesis of the environment of G305, which appears to be a very “typical” YSO with clearly defined out-flow cavities and a disk visible even in near-infrared images. One explanation for the difference between the two MYSOs could be that W33A could have formed a disk like G305 that was then distributed post-formation by the processes creating the spiral structures mentioned above, or alternatively that the system has always been so volatile that the disk was never able to form at these scales.
Wheelwright et al.(2012) compare∼20µm profiles
Fig. 5.A combined image showing the location and morphology of our VISIR 19.5µm image (black contours) in comparison to the structure observed in the VVVKs-band image. The VISIR contours are 0.2, 0.5, 2, 5, 10, 25 and 75% of the peak flux.
Fig. 6. Model spectral energy distribution of the best-fitting model (black). Multi-wavelength flux measurements from the RMS are rep-resented as blue diamonds, the yellow diamond represents the VISIR flux density and the fluxes corresponding to the MIDI visibilities are also shown in red. The unfilled diamonds represent the fluxes that were not considered in the fitting due to their suspected contamination.
majority of their sample and this does not rule out the pres-ence of disks around the MYSOs. MIDI probes the MYSO at scales small enough to trace disk emission, while the sensitiv-ity of VISIR is not high enough for such an endeavour given the MYSOs distances. This indicates that if one wants want to iden-tify the presence of a disk, whilst also accurately constraining the cavity properties of MYSOs in the infrared, a combination of the two observations is invaluable.
As mentioned briefly in the introduction, G305 has also been included in a survey of massive star formation by Liu et al.
(2019). In this work an SED of G305 was compiled from fluxes obtained from Gemini/T-ReCS and SOFIA/FORCAST images
and was fit using their ZT radiative transfer models (Zhang & Tan 2018) resulting in five best-fitting models. The stellar mass and inclination of our preferred fit are comparable to the ranges for these values listed for their five best fitting models. Other notable parameters such as cavity opening angle differ between our two works, but we note that the spatial resolution of our N-band data is higher and that therefore we were more tightly constrained on this parameter.
Within their deep, single-dish, 3.8–24.5 µm images a
sec-ondary source (referred to as G305B2) can be seen∼100 to the
north-east of G305 whose nature remains unclear. Interestingly, G305B2 is not present across the entire wavelength range, being absent from the shorter wavelength images, with an increas-ing relative brightness throughout theN-band and progressively becoming less visible again towards 24.5µm. Liu et al.(2019) mark a silhouette in their 9.7µm image between G305B2 and
G305 and postulate that it could be indicative of the silhouette of an inclined disk. If this is a disk silhouette, that would imply that the inclination of the source is the opposite to what we find in this work. Changing the inclination of the model to its opposite (145◦ instead of 35◦) has minimal effects on the MIDI
visibili-ties (as FFTs are symmetric), the VISIR radial profile (which is azimuthally averaged) and the SED. However it does present dif-ferences for our images, as the position of the brightest lobe is consistent only if the inclination is 35◦for both the VISIR image
and the VVV image (illustrated in Fig.5). The cavity lobe to the south-west is dimmer, and for a reverse inclination this would be the brighter lobe. This cavity lobe is outside the Gemini imaging field-of-view shown inLiu et al.(2019) and consequently was not discussed in their work. We also note that asymmetry is present in our 19.5µm VISIR image and theKs-band image and as such it is possible that they trace this second source.
In Sect. 4.1.1 we discussed the poor fitting of our MIDI data for Configuration A. The model visibilities were much higher than those observed, implying that extra emission must be present that is not being produced in the model. Given that the secondary source found in the Gemini images lies in the region of the suspected outflow cavity, it therefore appears a good can-didate for the source of this emission. Whilst our MIDI data trace only a 0.5200area, one can assume that if material has been
entrained out to nearly 1.500, material will be also be present at
∼0.500.
Given the confirmed inclination of the source from the VVV and VISIR images, we conclude that G305B2 is unlikely to be a coherent disk structure. The point-like material could be entrained cavity material (as discussed in Sect. 4.1.1), fall-out from potential disk fragmentation or indicate the presence of a binary companion. The latter two possibilities are addressed further in Sect.5.5.
5.2. Definitely a disk?
In Sect.3.3we mentioned that the unsatisfactory fits presented by the envelope-only model fromde Wit et al.(2010) and the fact that a dark lane existed between two apparent cavity lobes in the VVVKs-band image led us to include a disk in the model. How-ever, other studies find an insensitivity to disk emission and have shown that cavity emission alone can control theN-band visibil-ities (e.g.de Wit et al. 2010). As such, for completeness, Fig.8is presented, which includes the best fitting model visibilities and those for the same model with no disk. The VISIR and SED fits for the no-disk model are not added as these change mini-mally with the inclusion or exclusion of a disk (see Sects.4.1.2
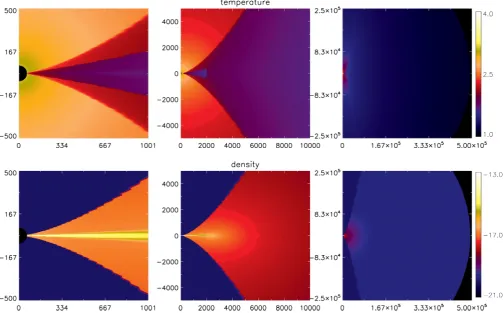
[image:11.595.36.292.396.560.2]Fig. 7.Cut-through, side-on, logarithmically-scaled maps of the temperature and density for the best-fitting model generated with Hochunk (plotted using IDL (IDL is a trademark of Exelis Visual Information Solutions, Inc.) post-processing scripts written byWhitney et al. 2013). The temperature colour-bar is in Kelvin and the density colour-bar is in g cm−3. The axes for all panels are in au. Each column of images represents a different scale, corresponding to the observations, with the smallest scales traced by MIDI on the left, larger scales traced by VISIR in the centre and the entire envelope displayed on the right.
model visibilities violates what is observed, especially the peak-like features observed in Configurations C, D and E between 7–8µm. This implies that the illuminated cavity walls represent too large a surface and that a compact component is required to recreate these visibilities. Configuration F is the only configu-ration satisfied by the no-disk model and constitutes the worst quality dataset of the group. We have already stated that to sat-isfy the silicate absorption feature within the SED that the cavity opening angle could not be larger than 12◦. Varying the cavity
opening angle is the most effective way of changing the model visibilities in an envelope-only model, and with this limitation in place from the SED an envelope-only model could therefore not be found which would satisfy theN-band data as well as the present disk-including model.
5.3. Testing the possibility of a bloated protostar
While the central luminosity of the protostar is crucial to suc-cessfully fitting the SED, the radius and temperature of the central protostar can still be varied whilst maintaining this value. One object that creates the required luminosity is a central object with a temperature of 35 000 K and radius of 6R. Such
prop-erties are typical of an O7 zero-age-main-sequence object as defined by the work ofStraizys & Kuriliene (1981). This cen-tral object is similar to the object used inde Wit et al.(2010) for W33A, but is dimmer by nearly 30% due to its smaller radius (6Ras opposed to 8R) for the same stellar temperature. One
could assume that because of the hot nature of the object that
the protostar should therefore be able to ionise hydrogen in its surrounding material and create a HIIregion, contrary to the lit-erature mentioned in Sect.1. It is possible to include a protostar that does not have this high temperature, thereby maintaining its luminosity, by “bloating” the star; expanding its radius and lowering its temperature and this possibility has been modelled extensively (Hosokawa et al. 2010 and Hosokawa & Omukai 2009). Bloated protostars have been utilised in the fitting of other MYSOs, namely AFGL 2136 (de Wit et al. 2011) and M8E-IR (Linz et al. 2009).
Hosokawa et al.(2010) propose the bloating of central proto-stars as a by product of massive protostellar accretion where the protostellar radius swells to 30–100R. In order for this to occur,
Hosokawa et al.(2010) required envelope infall rates of order 10−3M
yr−1, which are comparable to our model envelope infall
rate of 7.4×10⁻⁴M
yr−1. As such the bloating effect Hosokawa
postulates is feasible according to our analysis, if the protostel-lar system manages to retain a protostel-large portion of its envelope infall rate and some accretion continues across the 60 au gap.
Two models were run where the compact protostar was replaced with two different bloated protostars to assess their affect on our observables. Each bloated central object had the same luminosity as their hotter compact counterpart with the first having a radius of 30R and a temperature of∼16 000 K
and the second a radius of 100Rand a temperature of∼9000 K,
Fig. 8.Observed visibilities for each configuration (black) with the simulated visibilities for the best model fit (red) and a model with no-disk (blue).
silicate absorption feature of the SED did becoming marginally deeper for the 100R bloated star. In terms of the MIDI
visi-bilities, differences were seen but the visibilities did not go up and down uniformly, with increases and decreases seen across the same N-band spectrum for each configuration. The 100R
protostar showed an average difference in visibilities of 0.0025
compared to the compact object, meaning a percentage differ-ence of ∼6%. This did not produce significant changes except in the case of Configuration B, where the visibilities at 9.5 and 10.5 µm decreased, improving the fit. For a 30R bloated star
the fit of Configuration B was again a slight improvement on the fit for the compact source, although to a lesser degree than the 100Rprotostar.
5.4. The weak silicate absorption feature in the SED
The weak silicate absorption and the adjustments required to fit it present further questions about this MYSO. MYSOs are typically extremely dusty environments (with previous works finding deep silicate absorption features in other MYSO environments) yet the feature of G305 is weak. This implies a less dense surrounding environment and indeed, lower cavity densities were required in order to fit the silicate absorption feature of our observational SED. A weak silicate absorption feature can be a result of a com-bination of emission and absorption in the environment (Whittet et al. 1988).Levenson et al.(2007) for example note that a deep silicate absorption feature should be the result of a continuous optically and geometrically thick dusty medium while a clumpy medium whose curves are illuminated by from an outside source will have a much weaker feature as the emission compensates for the absorption. We cannot replicate such a clumpy medium in our modelling but it is possible that the real-life geometry of G305 could be suited to this case. We have mentioned that there is a source that is bright at longer wavelengths which could be illuminating the object and contaminating our flux measure-ments at longer wavelengths however this source is not bright in the mid-infrared and so one would not expect this illumina-tion to be filling in the absorpillumina-tion feature. This combined with the fact that a low density environment is required for success-ful VISIR fitting of G305 contradicts the first case suggested by Levenson et al. (2007) and implies that the weak silicate absorption feature is indicative of the nature of the source, not that of outside illumination, and that this MYSO is less dense than typical examples of its class. YSOs are believed to disperse over time, so the low density environment of G305 implies that this dispersion has begun, and that the MYSO is evolving from an envelope-dominated to disk-dominated system. This is sup-ported by work byWalsh et al.(2007), who conclude that the lack of HC3N, NH3, OCS, or H2O emission observed by ATCA implies that G305 has evolved to the point where it has cleared a significant portion of its surrounding material.
5.5. The inner cleared regions
The disk of G305 has an inner rim of 60 au as opposed to the ∼6–11 au inner radius of the accretion disk found byKraus et al.
(2010), almost an order of magnitude difference in size. In order to form a minimum dust radius of 60 au through dust sublimation alone, one requires a central object of∼5×10⁵L
. When such a
central source is included in the code the SED fit is violated. The sublimation radius of the central YSO that best fits the SED is ∼18 au. However, a model with a sublimation radius of this size results in a much worse fit for the MIDI visibilities (with no change to the VISIR and SED). This implies that the inner disk has been cleared out to the 60 au inner radius which best fits the observations.
Such a clearing in the inner regions of the disk has been observed in lower mass protostars (see Cieza et al. 2010,
van der Marel et al. 2015 for examples) and such disks are referred to as “transition disks”. Wyatt et al. (2015) describes the first stage of the transition disk as a phase where accretion is ongoing, with the presence of gas but absence of small dust. This is in agreement with the dust types of the successful model which do not contain small grains or PAHs.Tang et al.(2017),
van der Marel et al.(2014),van der Plas et al.(2017) andFedele et al. (2017) show inner radii of order tens of au for low-mass transitional objects, in agreement with the size of the inner radius of our best-fitting model. Considering these properties and the weak silicate absorption feature discussed previously, our work suggests that the disk surrounding G305 could present an exam-ple of a transition disk around an MYSO. Such a disk has not been reported around a high-mass object and if the transitional nature of this disk can be confirmed this has implications for the massive star formation process, in particular its similarity to the evolutionary sequence of low-mass objects, presenting a new observed evolutionary phase for massive forming stars.
An additional disk phase is also proposed for lower-mass stars known as the pre-transitional disk. During this phase a very small gaseous inner disk (scales of order 0.1au) remains close to the inner star (Espaillat et al. 2010) as material is removed at larger radii, so the inner cleared region is referred to as a gap.
Ilee et al.(2013) find their CO band-head emission data of G305 is satisfied by a disk of 0.6±0.3 au minimum radius, suiting this specification. Further observations of the gas at small radii could confirm whether the disk found inIlee et al.(2013) and our work coexist and whether G305 presents an example of this evolutionary stage.
We cannot confirm the exact mechanism that has caused the 60 au radius gap in this disk but various mechanisms for the clearing of the inner region have been proposed for low-mass stars. One such mechanism which translates well to the mas-sive protostellar case is photoevaporation. Photoevaporation is a process whereby high-energy radiation fields heat the uppermost layers of the disk, raising the thermal velocities of its particles above the escape velocity (Hollenbach & Gorti 2005) resulting in a disk wind. Given that MYSOs have typically large lumi-nosities it seems reasonable to consider that this may be the source of clearing for G305. However it is the gas disk that exists within the dust sublimation radius that will be expelled by pho-toevaporation and this is not considered by a radiative transfer model, although the work previously mentioned by Ilee et al.
(2013) implies that a gas disk still exists close to the star. Disk theory work suggests that material captured within the resultant disk wind can either be removed from the system or be recap-tured and rejoin the disk at larger radii. It has been proposed that the mass-accretion rate decreases with age and will eventually become equal to the amount of mass loss from the disk (Clarke et al. 2001). After this point, matter is solely lost through the disk wind and is not replenished, meaning that as material from the inner regions continues to accrete the inner regions begin to clear of material. As photoevaporation continues the inner hole can continue to grow as the rim is irradiated (Alexander & Armitage 2007). This model predicts low mass-accretion rates and disk masses and is therefore considered an unlikely mechanism for the formation of low-mass transition disks, however this has not been considered for MYSOs where the relative mass of the disk compared to the star is much smaller than in low-mass cases (for our model of G305 the disk is 5% of the mass of the central MYSO).
massive protostellar outflows at varying scales and as such we note that this mechanism may also present an explanation for the cleared inner regions.
Another mechanism discussed in the context of the cause of the hole in transition disks around low-mass stars is the presence of planets. The detections of planets around higher mass stars are few and tenuous. The NASA Exoplanet archive2provides a com-prehensive list of companions detected around other stars. 3826 companions are listed in total and of those objects 3053 have listed stellar masses. From that subset, only 7 objects (0.229%) are 7 solar masses or larger and the error bars on the determi-nation of these stellar mass are vast and they could, in fact, be low-mass stars. Given that massive forming stars are thought to reach the main sequence in ∼105 yr and that planets were not thought to form around low-mass until the late stages of their formation (between∼106 and 107 yr) it would seem that plan-ets could not form around massive stars. However, more studies are appearing that observe gaps and rings in low-mass proto-planetary disks at the Class 0/I stages. For example,Sheehan & Eisner(2018) find that the low-mass Class I protostar GY 91 has multiple rings within its disk and conclude that if planets were sweeping out these rings that they must be able to form within 0.5 Myrs of the disk appearing. Harsono et al.(2018) find this implied through the absence of carbon monoxide isotopologues. They conclude that shielding by millimetre-size grains is respon-sible for the lack of emission and suggests that grain growth and millimetre-size dust grains can be spatially and temporally coincident with a mass reservoir sufficient for giant planet for-mation.Manara et al.(2018) note that the protoplanetary disks observed around young stars do not have enough mass to form the observed exoplanet population and propose that one implied solution to this problem is that the cores of planets must form in less than 0.1–1 Myrs. If the implications of these works are cor-rect, then planets may be able to at least begin to form around massive forming stars and therefore disrupt the disk at small radii. It is unlikely that these protoplanets would survive once the central YSO reached the main sequence, therefore explaining the lack of confirmation of exoplanets around massive stars.
A potential scenario that perhaps translates better to the mas-sive star formation scenario is the possibility that a forming com-panion star could be sweeping out the inner regions of the disk instead of a planet. The multiplicity fraction for massive form-ing stars is estimated to be large, although the specific formation mechanisms of these binaries/multiple systems is not confirmed.
Pomohaci et al. (2019) include G305 in their pilot survey of binaries and do not class it as a multiple, but their method is suited to detecting wide binaries (separations of 400–46000 au) and as such a companion star could be forming within the deter-mined 60 au radius which they do not detect. Ilee et al.(2018) detected a body orbiting around MM1 within the G11.92-0.61 high-mass clump using ALMA observations. They conclude that this object, MM1 b, could be one of the first observed compan-ions forming via disk fragmentation based on the extreme mass ratio and orbital properties of the system. Meyer et al. (2018) present 3D gravitation-radiation-hydrodynamic numerical sim-ulations of massive pre-stellar cores. They find that accretion discs of young massive stars violently fragment without prevent-ing accretion onto the protostars and that the migration of some of the disc fragments migrate on to the central massive protostar with dynamical properties comparable to a close massive proto-binary system. Given that the mass of the potential disk around G305 is not well constrained by our infrared observations and
2 https://exoplanetarchive.ipac.caltech.edu/
that the disks observed around other massive stars (e.g.Johnston et al., 2015) have the potential to be very massive, a forming binary companion could therefore constitute a more realistic body to disrupt the disk at small radii.Meyer et al.(2018) postu-late that FU-Orionis-type bursts could happen at the same time as close massive binary formation, withCaratti o Garatti et al.
(2017) detecting such a burst around the MYSO S255 NIRS 3. The secondary source, G305B2, mentioned in Sect.5.1, appears point-like in the single-dish images ofLiu et al.(2019) and could potentially be a forming “proto-companion”. If disk fragmen-tation is occurring, a piece of dusty material expelled from a fragmenting disk could also cause the presence of G305B2 and explain the poor fitting of Configuration A. Obtaining ALMA data for G305 could assist in confirming whether similar sig-natures to those observed around MM1a/b exist for G305 and therefore whether companion formation and disk fragmentation could be occurring.
Another possibility is that the winds arising from the MYSO itself could clear the dust within the inner 60 au. While these winds would be a result of the luminosity and temperature of the object, which are input parameters within the Hochunk code, such winds are not a component of the models we use.Parkin et al.(2009) present hydro-dynamical models investigating how disk and stellar winds interact with envelope material and that reverse-shocks can occur at scales less than 500 au. The work does not look at the 20–100 au scales relevant to this work and given the limits of our model we cannot explain why the out-flows expected to disrupt material at 500 au would only disrupt material out to 60 au as is the case for G305.
Given the uncertainty as to the similarity of low-mass and massive star formation we cannot conclude whether one of the discussed mechanisms or a combination of the effects is a more likely culprit for the cleared dust within the inner disk regions of G305. Further observations and study will allow for a more detailed discussion of this subject.
6. Conclusions
Through the combination of multiple baselines of MIDI interfer-ometric data, VISIR imaging data and an SED we constrain the characteristics of the massive YSO G305.20+0.21 with a 2.5D radiative transfer model. The best-fitting model indicates that the MYSO is surrounded by a large extended dusty envelope with bipolar cavities and a dusty disk, as per the Class I specification of protostars. Throughout the fitting process the following obser-vations were made in regards to the diagnostic abilities of each type of observation:
– the N-band visibilities trace the warm material within the inner regions of the disk and emission from the cavity walls; – the emission at 20 µm traces mostly cavity emission and
is negligibly affected by changing disk parameters (for a distance of 4 kpc);
– in order to successfully reproduce the observed weak sili-cate absorption feature in the SED a low-density protostellar environment is required.