3
1
7
KS-A
Q-03-001-3A-C
eur
ostat
Landwirtschaft — Statistisches Jahrbuch —
Daten 1992-2001
Agricultur
e
—
Statistical yearbook —
Data 1992-2001
Agricultur
e
—
Annuair
e statistique —
Données 1992-2001
5
2002 EDITION
Landwirtschaft
Statistisches Jahrbuch
D a t e n 1 9 9 2 - 2 0 0 1
Agriculture
Statistical yearbook
D a t a 1 9 9 2 - 2 0 0 1
Agriculture
Annuaire statistique
D o n n é e s 1 9 9 2 - 2 0 0 1
∀
Preis in Luxemburg (ohne MwSt.) • Price (excluding VAT) In Luxembourg • Prix au Luxembourg (TVA exclue): 31 EUR
ISBN 92-894-4374-X
Eurostat hat den Auftrag, der
Europäischen Union
einen
qualitativ hochwertigen statistischen Informationsdienst
bereitzustellen
Eurostat-Reihen:
ein an den Bedarf aller Nutzer angepasstes Angebot.
Pressemitteilungen:
Sie enthalten die Schlüsselzahlen zur EU,
zu ihren Mitgliedstaaten und ihren Partnern. Die Pressemitteilungen
werden kostenlos zur Verfügung gestellt. Unmittelbar nach ihrer
Veröffentlichung sind sie auch im Internet zu finden:
www.europa.eu.int/comm/eurostat/
Statistik kurz gefasst:
aktuelle Zusammenfassungen der
wichtigsten Ergebnisse von statistischen Erhebungen, Studien und
Analysen.
Pocketbooks:
Diese Reihe enthält in einem handlichen Buch
von maximal 100 Seiten die wichtigsten Indikatoren zu einem
Themenbereich oder einem Teilbereich.
Panorama der Europäischen Union:
In dieser Reihe geht
es um die Merkmale und Trends in multisektoralen
Themenbereichen oder sektoralen Teilbereichen.
Methoden und Nomenklaturen:
Diese Veröffentlichungen
richten sich an Fachleute; sie beschreiben die Methoden und
Nomenklaturen, die für einzelne Themen, Themenbereiche oder
Sektoren verwendet werden.
Detaillierte Tabellen:
Diese Veröffentlichungen richten sich an
Fachleute; darin sind ein Teil oder die Gesamtheit der statistischen
Angaben zu einem Thema, Themenbereich oder Sektor zu finden.
Kataloge:
Die kostenlosen Kataloge informieren rasch und genau
über das Produkt- und Dienstleistungsangebot von Eurostat.
Press releases:
key figures on the EU, the Member States and
their partners. They are provided free of charge. They are also
available on the Internet as soon as they are published:
www.europa.eu.int/comm/eurostat/
Statistics in focus:
up-to-date summaries of the main results
of statistical surveys, studies and analyses.
Pocketbooks:
the main indicators on a theme or sub-theme in
an easy-to-carry booklet.
Panorama of the European Union:
highlights the features
and trends of a multi-sectoral theme or a sectoral sub-theme.
Methods and nomenclatures:
intended for specialists who
want to consult the methodologies and nomenclatures used for a
theme, a sub-theme or a sector.
Detailed tables:
statistical data for specialists compiled on a
theme, sub-theme or sector.
Catalogues:
free of charge rapid access to concise information
on Eurostat´s products and services.
Our mission is to provide the
European Union
with a
high-quality statistical information service
Eurostat's collections
are adapted to the needs of all users.
Communiqués de presse:
les chiffres clés sur l'UE, les États
membres et leurs partenaires. Ils sont distribués gratuitement
et sont également disponibles sur l’internet dès leur publication:
ww.europa.eu.int/comm/eurostat/
Statistiques en bref:
synthèses actualisées des principaux
Méthodes et nomenclatures:
les méthodologies et les
nomenclatures relatives à un thème, un sous-thème ou un secteur.
Tableaux détaillés:
des données statistiques élaborées
concernant un thème, un sous-thème ou un secteur, destinées
aux spécialistes.
Notre mission est de fournir à
l'Union européenne
un service
d'information statistique de qualité
Les
collections d'Eurostat
sont une offre adaptée aux besoins de tous les utilisateurs.
DE
#
∀
EN
#
∀
FR
5
2002 EDITION
Landwirtschaft
Statistisches Jahrbuch
D a t e n 1 9 9 2 - 2 0 0 1
Agriculture
Statistical yearbook
D a t a 1 9 9 2 - 2 0 0 1
Agriculture
Annuaire statistique
D o n n é e s 1 9 9 2 - 2 0 0 1
E u r o s t a t D a t a S h o p s
bieten ein umfassendes Angebot an
„maßgeschneiderten”
Dienstleistungen:
∃
eine unmittelbare Bearbeitung von Informationsanfragen;
∃
eine garantiert schnelle und individuelle Antwort;
∃
Wahl des Trägers, auf dem die statistischen Daten geliefert
werden.
Informationen können telefonisch, schriftlich, per Fax oder per
E-Mail angefordert werden.
I n t e r n e t
Die wesentlichen statistischen Nachrichten aus der
Gemeinschaft:
∃
Euro-Indikatoren: über 100 harmonisierte, vergleichbare
und kostenlose Indikatoren der Euro-Zone;
∃
Pressemitteilungen: direkter Zugriff auf alle
Pressemitteilungen von Eurostat.
Weitere Informationen finden sich auf der Internet-Site unter:
www.europa.eu.int/comm/eurostat/
Unmittelbarer Zugriff auf
harmonisierte statistische Daten
E u r o s t a t D a t a S h o p s
provide a wide range of
tailor-made services:
∃
immediate information searches,
∃
rapid and personalised response,
∃
choice of data carrier.
Information can be requested by phone, mail, fax or e-mail.
I n t e r n e t
Essentials on Community statistical news:
∃
euro indicators: more than 100 indicators on the
euro zone; harmonised, comparable, and free of charge,
∃
press releases: direct access to all Eurostat press releases.
For further information, visit us on the Internet:
www.europa.eu.int/comm/eurostat/
Immediate access to
harmonised statistical data
E u r o s t a t D a t a S h o p s
un large éventail de prestations
«sur mesure»:
∃
la prise en charge immédiate de toute recherche d'information,
∃
la garantie d'une réponse rapide et personnalisée,
∃
le choix du support de fourniture des données.
Les informations peuvent être demandées par téléphone, par courrier,
par télécopie ou par courrier électronique.
I n t e r n e t
l'essentiel de l'actualité statistique communautaire:
∃
euro-indicateurs: plus de 100 indicateurs sur la zone euro
(harmonisés, comparables et disponibles gratuitement),
∃
communiqués de presse: accès direct à tous les
communiqués de presse d'Eurostat.
Pour plus d'informations, visitez le site internet d'Eurostat:
www.europa.eu.int/comm/eurostat/
Accès immédiat à des
données statistiques harmonisées
Zahlreiche weitere Informationen zur Europäischen Union sind verfügbar über Internet, Server Europa (http://europa.eu.int).
A great deal of additional information on the European Union is available on the Internet.
It can be accessed through the Europa server (http://europa.eu.int).
De nombreuses autres informations sur l'Union européenne sont disponibles sur l’internet via le serveur Europa (http://europa.eu.int).
Bibliografische Daten befinden sich am Ende der Veröffentlichung.
Cataloguing data can be found at the end of this publication.
Une fiche bibliographique figure à la fin de l'ouvrage.
Luxembourg: Office des publications officielles des Communautés européennes, 2002
ISBN 92-894-4374-X
ISSN 1681-4711
DE
#
∀
EN
#
∀
FR
L-2920 Luxembourg — Tél. (352) 43 01-1 — Télex COMEUR LU 3423
Rue de la Loi 200, B-1049 Bruxelles — Tél. (32-2) 299 11 11
Eurostat ist das Statistische
Amt der Europäischen
Gemeinschaften. Es hat den Auftrag,
die Europäische Union mit
euro-päischen Statistiken zu versorgen, die
Vergleiche zwischen Ländern und
Regionen ermöglichen. Eurostat
konsolidiert und harmonisiert die in
den Mitgliedstaaten erhobenen
Daten.
Um die weite Verbreitung der
gewaltigen verfügbaren Datenmenge
zu gewährleisten und den einzelnen
Nutzern zu helfen, diese
Informationen richtig zu verwenden,
hat Eurostat sein
Veröffentlichungs-und Dienstleistungsprogramm
geschaffen. Um sich gezielt an das
breite Publikum oder an Fachleute
wenden zu können, wurden für die
einzelnen Nutzergruppen spezielle
Reihen entwickelt.
Im Rahmen des neuen Programms
hat Eurostat eine Web-Site
entwickelt. Sie umfasst ein breites
Angebot von Online-Informationen
über die Erzeugnisse und
Dienstleistungen, Pressemitteilungen,
Kataloge, Online-Veröffentlichungen
sowie Indikatoren für die Euro-Zone.
Yves Franchet
Generaldirektor
Eurostat is the Statistical Office
of the European Communities.
Its task is to provide the European
Union with statistics, at a European
level, that allow comparisons to be
made between countries and
regions. Eurostat consolidates and
harmonises the data collected by the
Member States.
To ensure that the vast quantity of
accessible data is made widely
available and to help each user make
proper use of the information,
Eurostat has set up a publications
and services programme.
As part of the new programme,
Eurostat has developed its web site.
It includes a broad range of online
information on Eurostat products and
services, newsletters, catalogues,
online publications as well as
indicators on the euro zone.
Yves Franchet
Director-General
Eurostat est l'office statistique
des Communautés
européennes. Il a pour tâche de
fournir à l'Union européenne des
statistiques au niveau européen
qui permettent des comparaisons
entre pays et régions. Eurostat
consolide et harmonise les données
collectées par les États membres.
Pour assurer que l’ensemble des
données disponibles soit largement
accessible et pour aider chaque
utilisateur à faire bon usage de
toute cette information, Eurostat a
mis en place un programme de
publications et de services.
Dans le cadre du nouveau
programme, Eurostat a développé
son site internet. Celui-ci comprend
toute une série d'informations
en ligne sur les produits et les
services d'Eurostat, ses bulletins
d'information, ses catalogues et ses
publications en ligne ainsi que des
indicateurs sur la zone euro.
Cataloguing data can be found at the end of this pubblication.
Une fiche bibliographique figure à la fin de l’ouvrage.
DE: Deutscher Text ab Seite 3.
EN: English text begins on page 9.
DE
VORWORT
Das vorliegende Jahrbuch umfaßt die wichtigsten Angaben aus Eurostats
Spezialveröffentlichungen über Landwirtschaft, Forstwirtschaft und Fischerei in gekürzter
Form.
Das Jahrbuch bezieht sich im wesentlichen auf die Entwicklung in den Jahren 1992-2001,
soweit diese zum Redaktionsschluß am 30. November 2002 vorlagen. Im übrigen wird auf
die Spezialveröffentlichungen von Eurostat verwiesen (siehe Anhang, Seite 192).
Die Angaben wurden von den nationalen statistischen Ämtern bzw. den statistischen
Diensten der Ministerien auf der Grundlage gemeinschaftlicher Konzepte und Methoden
ermittelt. Eine Kurzfassung der wichtigsten angewandten gemeinschaftlichen Methoden
enthalten die einzelnen Kapitel.
Die in den Tabellen angeführten Gesamtzahlen für EU-15 entsprechen der Summe der 15
Mitgliedstaaten, unabhängig davon, ob einige Mitgliedstaaten für den entsprechenden
Zeitraum bereits Mitglied der Union waren oder nicht.
Vorwort...
3
Abkürzungen...
8
Zeichenerklärung ...
8
1. Allgemeiner Teil
Schaubilder
1.1
Aufgliederung der Gesamtfläche nach Hauptkategorien 2001 ...
23
1.2
Ausgewählte pflanzliche Erzeugung in der EU und in der Welt 2001 ...
32
1.3
Tierbestand in der EU und in der Welt...
33
1.4
Fleischerzeugung in der EU und in der Welt ...
34
Tabellen
1.1
Gesamtfläche und landwirtschaftliche Fläche 1991 und 2001...
23
1.2
Zivil Erwerbstätige nach Wirtschaftsbereichen 1991 und 2001 ...
24
1.3
Bruttowertschöpfung zu Faktorkosten nach Wirtschaftsbereichen
1990 und 2000 ...
25
1.4
EU-Handel mit landwirtschaftlichen Produkten 2000 und 2001...
26
1.5
Intra-Handel mit Nahrungsmitteln und lebenden Tieren in der
Europäischen Union 2001...
28
1.6
Außenhandel der Mitgliedstaaten
Nahrungsmittel und lebende Tiere 2001 ...
29
1.7
Außenhandel der Europäischen Union
Nahrungsmittel und lebende Tiere 2001 ...
30
1.8
Außenhandel der Mitgliedstaaten
Nahrungsmittel und lebende Tiere 1992-2001...
31
1.9
Ausgewählte pflanzliche Erzeugung in der EU und in der Welt,
1991 und 2001 ...
32
1.10
Tierbestand in der EU und in der Welt, 1991 und 2001...
33
1.11
Fleischerzeugung in der EU und in der Welt, 1991 und 2001 ...
34
2. Fläche und pflanzliche Erzeugung
Tabellen
2.1
Gesamtfläche und landwirtschaftliche Fläche nach Hauptkategorien
1992-2001 ... 3
7
2.2 Ackerland nach Kategorien 2001 ... 3
9
2.3 Flächen für Dauerkulturen nach Kategorien 2001 ... 3
9
2.4
Wichtige pflanzliche Erzeugnisse, geerntete Fläche und Erzeugung
1992-2001 ...
40
2.5 Wichtige Getreidearten, geerntete Fläche und Erzeugung 2001... 4
8
2.11 Versorgungsbilanz, Hülsenfrüchte 1991/92-2000/2001 ... 6
3
2.12 Versorgungsbilanz, Zucker 1991/92-2000/2001 ... 6
5
2.13 Versorgungsbilanz, Wein 1991/92-2000/2001... 6
8
2.14
Pflanzliche Erzeugnisse, Selbstversorgungsgrad und
Bruttonahrungs-verbrauch 1991/92-2000/2001 ...
70
Text
Methodische Erläuterungen über Anbauflächen und
Versorgungs-bilanzen ... 7
1
3. Tierische Erzeugung
Tabellen
3.1. Rinderbestand im Dezember 1992-2001 ... 7
5
3.2 Rinderbestand nach Kategorien 2001... 7
6
3.3 Struktur der Rinderhaltung insgesamt 1999 ... 7
7
3.4 Struktur der Milchkuhhaltung 1999 ... 7
8
3.5 Struktur der Haltung von sonstigen Kühen 1999 ... 7
9
3.6 Schweinebestand im Dezember 1992-2001 ...
80
3.7 Schweinebestand nach Kategorien 2001...
81
3.8 Struktur der Schweinehaltung, insgesamt 1999 ... 8
2
3.9 Struktur der Mastschweinhaltung 1999... 8
3
3.10 Struktur der Sauenhaltung 1999 ... 8
4
3.11 Schaf- und Ziegenbestand im Dezember 1992-2001 ... 8
5
3.12 Versorgungsbilanz, Fleisch 1991-2000... 8
6
3.13 Selbstversorgungsgrad und Nahrungsverbrauch, Fleisch 2001 ... 8
9
3.14
Vollmilch auf dem Hof, Erzeugung und wichtigste Verwendungen
1991-2000 ...
90
3.15
Aktivität in den Molkereien, verfügbare Milch und wichtigste
Erzeugnisse 1991-2000 ...
92
3.16
Selbstversorgungsgrad und Nahrungsverbrauch, Milcherzeugnisse
2000 ... 9
3
3.17 Versorgungsbilanz, Eier insgesamt 1992-2001 ... 9
4
Text
Methodische Erläuterungen zu Flächenkonzept und ...
Versorgungsbilanzen ... 9
5
4. Struktur der landwirtschaftlichen Betriebe – 1979/80 - 1999/2000
Schaubilder
4.1 Landwirtschaftlich genutzte Fläche je Betrieb... 10
3
4.2 Anteil der Betriebe unter 5 ha LF…… ... 10
6
4.1 Betriebe und landwirtschaftlich genutzte Fläche ... 10
3
4.2 Besitzverhältnisse ... 10
4
4.3 Betriebe nach Größenklassen der landwirtschaftlich genutzten Fläche 10
5
4.4
Betriebe nach Größenklassen der landwirtschaftlich
genutzten Fläche... 10
7
4.5 Betriebe nach wirtschaftlichen Betriebsgrößenklassen (EGE) ... 10
9
Betriebe nach betriebswirtschaftlicher Ausrichtung
4.6 Ackerbaubetriebe ... 1
11
4.7 Gartenbaubetriebe ... 1
12
4.8 Dauerkulturbetriebe ……….. 1
13
4.9 Weideviehbetriebe ... 11
4
4.10 Veredlungsbetriebe
... 11
5
4.11 Pflanzenbauverbundbetriebe ... 11
6
4.12 Viehhaltungsverbundbetriebe ... 11
7
4.13 Pflanzenbau/Viehhaltungsbetriebe ... 11
8
Arbeitskräfte
4.14 Arbeitskräfte (1000 JAE)... 11
9
4.15 Arbeitskräfte (1000 Personen) ... 1
20
4.16 Betriebsleiter die gleichzeitig Betriebsinhaber sind (1000 Personen) .. 1
21
4.17
Betriebe und landwirtschaftlich genutzte Fläche in benachteiligten
Gebieten... 12
3
4.18 Betriebe und landwirtschaftlich genutzte Fläche in Berggebieten... 12
4
Text
Methodische Erläuterungen über betriebswirtschaftliche Ausrichtung,
Standarddeckungsbeitrag, Betriebsgröße und Jahresarbeitseinheit ... 12
5
5. Preise und Preisindizes
Tabellen
5.1 Verkaufspreise pflanzlicher Produkte 1992-2001 ... 1
31
5.2 Verkaufspreise tierischer Produkte 1992-2001... 13
7
5.3 Einkaufspreise landwirtschaftlicher Betriebsmittel 1992-2001... 1
42
5.4
EU Index der Erzeugerpreise landwirtschaftlicher Produkte, nominale
Preisindizes, 1992-2001... 14
5
5.5
EU Index der Erzeugerpreise landwirtschaftlicher Produkte,
deflatio-nierte Preisindizes, 1992-2001... 14
6
5.6
EU Index der Erzeugerpreise landwirtschaftlicher Produkte nach
wichtigen Produkten, nominale Preisindizes, 1992-2001... 14
7
5.7
EU Index der Erzeugerpreise landwirtschaftlicher Produkte nach
wichtigen Produkten, deflationierte Preisindizes, 1992-2001... 14
9
5.8
EU Index der Einkaufspreise landwirtschaftlicher Betriebsmittel,
nominale Preisindizes, 1992-2001 ... 1
51
5.9
EU Index der Einkaufspreise landwirtschaftlicher Betriebsmittel,
indizes ... 15
9
6. Landwirtschaftliche Gesamtrechnung
Tabellen
6.1
Landwirtschaftliche Erzeugung, Vorleistungen und Wertschöpfung ...
1992-2001 ... 1
65
6.2
Volumenindizes landwirtschaftliche Erzeugung, Vorleistungen ...
und Wertschöpfung 1992-2001 ... 1
70
6.3
Bedeutende Positionen von landwirtschaftlicher Erzeugung ...
und Vorleistungen 1992-2001 ... 1
72
6.4.
Indizes der realen Faktoreinkommens in der Landwirtschaft je...
Jahresarbeitseinheit 1992-2001... 1
77
Text
Methodische Erläuterungen zur Gesamtrechnung ... 17
8
7. Forstwirtschaft
Schaubild
7.1 Wald und andere Holzflächen in Prozent der Gesamtfläche ... 1
85
Tabellen
7.1 Waldfläche und andere Holzflächen ... 1
86
7.2 Rundholzproduktion 1992-2001 ... 18
7
7.3 Produktion und Aussenhandel für Rundholz 1992-2001... 18
8
Text
Methodische Erläuterungen über Forstflächen und Produktion und ...
Aussenhandel für Rohholz ... 18
9
8. Fischerei
Schaubild
8.1 Fischereierzeugung
1992-2001 ... 1
93
Tabellen
8.1 Fischereierzeugung insgesamt 1992-2001 ... 1
94
8.2 Fänge insgesamt 1992-2001 ... 1
95
8.3 Aquakulturerzeugung 1992-2001... 1
96
Text
Methodische Erläuterungen zu den Fängen ... 1
97
9. Anhang
9.1
Eurostats Veröffentlichungen über Landwirtschaft, Forstwirtschaft
Einheiten :
BT
=
Bruttoregistertonnen
ECU
=
Europäische Währungseinheit
EGE
=
Europäische Größeneinheit
ha
=
Hektar = 10.000 m²
hl
=
Hektoliter = 100 l
JAE
=
Jahresarbeitseinheit
kg
=
Kilogramm
l
=
Liter
m³
=
Kubikmeter
Mio
=
Million
Mrd
=
Milliarde
t
=
Tonne
Mitgliedstaaten :
B
=
Belgien
DK
=
Dänemark
D
=
Deutschland
EL
=
Griechenland
E
=
Spanien
F
=
Frankreich
IRL
=
Irland
I
=
Italien
L
=
Luxemburg
NL
=
Niederlande
A
=
Österreich
P
=
Portugal
FIN
=
Finnland
S
=
Schweden
UK
=
Vereinigtes Königreich
Andere Abkürzungen :
EFTA
=
Europäische Freihandelszone
EG
=
Europäische Gemeinschaften
EU
=
Europäische Union
EU-12/EU-15 =
Alle EU-Mitgliedstaaten
Eurostat
=
Statistisches Amt der Europäischen Gemeinschaften
FAO
=
Ernährungs- und Landwirtschaftsorganisation der Vereinten
Nationen
MwSt
=
Mehrwertsteuer
OECD
=
Organisation für wirtschaftliche Zusammenarbeit und Entwicklung
SITC
=
Internationales Warenverzeichnis für den Außenhandel
UEBL/BLEU =
Belgisch-Luxemburgische Wirtschaftsunion
Z
EICHENERKLÄRUNG
–
Nichts
0
è
Weniger als die Hälfte der verwendeten Einheit
0,0
æ
.
Fragestellung trifft nicht zu
..
Vertrauliche Angabe
:
Kein Nachweis vorhanden
EN
PREFACE
This Yearbook sets up a synthetic view of the main figures from Eurostat's special
publications on agriculture, forestry and fisheries.
The Yearbook describes generally the developments during the period from 1992-2001, as
far as the data were available the 30 November 2002, as the publication went to the press.
The reader is also referred to the specialised Eurostat publications (see annex, page 194) for
more detailed information.
The data were produced by the National Statistics Institutes or the Statistical Services of the
Ministries on the basis of harmonised methodologies which are briefly summarised in each
chapter.
The overall figures for EU-15 are the sums for the fifteen Member States, whether some
Member States were already members of the Union for the period in question or not.
Preface ...
9
Abbreviations used ...
14
Symbols used ...
14
1. General
Figures
1.1
Distribution of total area by main category 2001 ...
23
1.2
Selected crop production in the World 2001 ...
32
1.3
Livestock numbers in the World ...
33
1.4
Meat production in the World ...
34
Tables
1.1
Total and agricultural area 1991 and 2001 ...
23
1.2
Civilian employment by sector of activity 1991 and 2001...
24
1.3
Gross value added at factor cost by economic branches
1990 and 2000 ...
25
1.4
EU trade in agricultural commodities 2000 and 2001 ...
26
1.5
Intra trade in the European Union, food and live animals 2001 ...
28
1.6
External trade of the Member States, food and live animals 2001 ...
29
1.7
External trade of the European Union, food and live animals 2001 ...
30
1.8
External trade of the Member States, food and live animals
1992-2001 ...
31
1.9
Selected crop production in EU and in the World, 1991 and 2001 ...
32
1.10
Livestock numbers in EU and in the World, 1991 and 2001...
33
1.11
Meat production in EU and in the World, 1991 and 2001 ...
34
2. Area and crop production
Tables
2.1 Total and agricultural area by main category 1992-2001... 3
7
2.2 Arable land by category 2001... 3
9
2.3 Areas under permanent crops by category 2001 ... 3
9
2.4 Important crops, harvested area and production 1992-2001 ...
40
2.5 Important cereal crops, harvested area and production 2001 ... 4
8
2.6
Important fresh vegetables, harvested area and production
1992-2001 ... 4
9
2.7 Harvested production of selected fresh vegetables 2001 ... 5
2
2.14
Crop products, self sufficiency and human consumption
1991/92-2000/2001 ...
70
Text
Methodological notes : area and supply balance sheets ... 7
1
3. Animal production
Tables
3.1. Bovine livestock, December 1992-2001 ... 7
5
3.2 Bovine livestock by category 2001 ... 7
6
3.3 Structure of cattle holders, total 1999 ... 7
7
3.4 Structure of dairy cows holders 1999... 7
8
3.5 Structure of non-dairy cow holders 1999 ... 7
9
3.6 Pig population, December 1992-2001...
80
3.7 Pig population by category, 2001 ...
81
3.8 Structure of pig holders, total 1999 ... 8
2
3.9 Structure of holders of pigs for fattening 1999 ... 8
3
3.10 Structure of sow holders 1999 ... 8
4
3.11 Sheep and goat population, December 1992-2001 ... 8
5
3.12 Supply balance sheet, meat 1991-2000... 8
6
3.13 Self sufficiency and human consumption - meat 2001 ... 8
9
3.14 Whole milk on farms. Production and main uses 1991-2000 ...
90
3.15
Dairies' activities, whole milk available and main production
1991-2000 ...
91
3.16 Self sufficiency and human consumption - dairy products 2000... 9
3
3.17 Supply balance sheet, eggs total 1992-2001 ... 9
4
Text
Methodological notes: area concept and supply balance sheets... 9
7
4. Structure of agricultural holdings – 1979/80 - 1999/2000
Figures
4.1 Agricultural area by holding... 10
3
4.2 Percentage of holdings with less then 5 ha AA... 10
6
4.3 Family labour force as percentage of total labour force... 1
20
4.4 Average agricultural area by holding in less-favoured areas ... 12
3
4.5 Average agricultural area by holding in mountain areas ... 12
4
Tables
4.1 Holdings and agricultural area ... 10
3
4.8 Permanent crops ……….. ... 11
3
4.9 Grazing
livestock... 11
4
4.10 Granivores... 11
5
4.11 Mixed cropping... 11
6
4.12 Mixed livestock... 11
7
4.13 Mixed crops/livestock ... 11
8
Labour force
4.14 Labour force (1000 AWU)... 11
9
4.15 Labour force (1000 persons)... 1
20
4.16 Holders being also the manager (1000 persons)... 1
21
4.17 Holdings and agricultural area in less-favoured areas ... 12
3
4.18 Holdings and agricultural area in mountain areas... 12
4
Text
Methodological notes : type of farming, standard gross margin,
economic size of holdings and annual work units ... 1
26
5. Prices and price indices
Tables
5.1 Selling prices of crop products 1992-2001... 1
31
5.2 Selling prices of animal products 1992-2001 ... 13
7
5.3 Purchase prices of the means of agricultural production 1992-2001.. 1
42
5.4
EU index of producer prices of agricultural products, nominal price
indices, 1992-2001... 14
5
5.5
EU index of producer prices of agricultural products, deflated price
indices, 1992-2001... 14
6
5.6
EU index of producer prices of agricultural products by important
products, nominal price indices, 1992-2001 ... 14
7
5.7
EU index of producer prices of agricultural products by important
products, deflated price indices, 1992-2001 ... 14
9
5.8
EU index of purchase prices of the means of agricultural production,
nominal price indices, 1992-2001 ... 1
51
5.9
EU index of purchase prices of the means of agricultural production,
deflated price indices, 1992-2001 ... 1
52
5.10
EU index of purchase prices of the means of agricultural production
by important means, nominal price indices, 1992-2001... 1
53
5.11
EU index of purchase prices of the means of agricultural production
by important means, deflated price indices, 1992-2001 ... 15
5
5.12 Consumer prices index for food, 1992-2000... 15
7
Text
Methodological notes : agricultural prices and EC indices of
agricultural prices ... 1
60
6. Agricultural accounts
1992-2001 ... 1
72
6.4.
Indices of real income of factors in agriculture per annual work unit ...
1992-2001 ... 17
7
Text
Methodological notes : Economic Accounts for Agriculture ... 17
9
7. Forestry
Figure
7.1 Forest and other wooded area in percentage of total area ... 1
85
Tables
7.1 Forest area and other wooded area... 1
86
7.2 Roundwood production 1992-2001 ... 18
7
7.3 Production and trade for roundwood 1992-2001... 18
8
Text
Methodological notes : Wooded area and production and trade ...
for raw wood... 18
9
8. Fisheries
Figure
8.1 Fisheries production 1992-2001... 1
93
Tables
8.1 Total fisheries production 1992-2001... 1
94
8.2 Total catches 1992-2001 ... 1
95
8.3 Total aquaculture production 1992-2001 ... 1
96
Text
Methodological notes on catches... 1
97
9. Annex
9.1 Eurostat publications on agriculture, forestry and fisheries ...
203
Units :
AWU
=
Annual work unit
ECU
=
European currency unit
ESU
=
European size unit
GT
=
Gross tonnage
ha
=
Hectare = 10.000 m²
hl
=
Hectolitre = 100 l
kg
=
Kilogram
l
=
Litre
m³
=
Cubic metre
Mio
=
Million
Mrd
=
Milliard
t
=
Tonnes
Member states :
B
=
Belgium
DK
=
Denmark
D
=
Germany
EL
=
Greece
E
=
Spain
F
=
France
IRL
=
Ireland
I
=
Italy
L
=
Luxembourg
NL
=
Netherlands
A
=
Austria
P
=
Portugal
FIN
=
Finland
S
=
Sweden
UK
=
United Kingdom
Other abbreviations :
EC
=
European Communities
EFTA
=
European Free Trade Association
EU
=
European Union
EU-12/EU-15 =
Total of the member countries of the EU
Eurostat
=
Statistical Office of the European Communities
FAO
=
Food and Agriculture Organisation of the United Nations
OECD
=
Organisation for Economic Cooperation and Development
SITC
=
Standard International Trade Classification
UEBL/BLEU =
Belgo-Luxembourg Economic Union
VAT
=
Value added tax
S
YMBOLS USED
–
Nil
0
è
Less than half the final digit shown
0,0
æ
.
Not applicable
..
Confidential data
:
Data not available
FR
AVANT-PROPOS
Le présent annuaire reprend sous une forme synthétique les principales informations des
publications spécialisées d'Eurostat dans les domaines de l'agriculture, de la sylviculture et
de la pêche.
L'annuaire retrace pour l'essentiel et au cours de la période 1992-2001 l’évolution des
données disponibles au moment de la rédaction, le 30 novembre 2002. Pour de plus amples
informations, il est fait référence aux publications spécialisées d'Eurostat (cf. annexe, page
196).
Les informations ont été recueillies par les Instituts Nationaux de Statistiques et les Services
Statistiques des Ministères concernés sur la base de méthodologies harmonisées, dont les
principales sont présentées succinctement aux différents chapitres.
Les chiffres globaux indiqués dans les tableaux pour EU-15 correspondent à la somme des
quinze Etats membres, même si certains d'entre eux ne faisaient pas encore partie de l'union
au cours de la période observée.
Avant-propos ...
15
Abréviations ...
20
Signes employés...
20
1. Partie générale
Graphiques
1.1
Répartition de la superficie totale par grandes catégories 2001 ...
23
1.2
Production végétale sélectionnée dans l’UE et dans le monde 2001 ...
32
1.3
Effectif animal dans l’UE et dans le monde ...
33
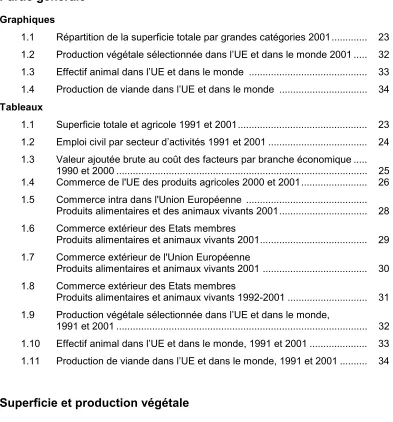
[image:20.595.114.507.141.563.2]1.4
Production de viande dans l’UE et dans le monde ...
34
Tableaux
1.1
Superficie totale et agricole 1991 et 2001...
23
1.2
Emploi civil par secteur d’activités 1991 et 2001 ...
24
1.3
Valeur ajoutée brute au coût des facteurs par branche économique ...
1990 et 2000 ...
25
1.4
Commerce de l'UE des produits agricoles 2000 et 2001...
26
1.5
Commerce intra dans l'Union Européenne ...
Produits alimentaires et des animaux vivants 2001...
28
1.6
Commerce extérieur des Etats membres
Produits alimentaires et animaux vivants 2001...
29
1.7
Commerce extérieur de l'Union Européenne
Produits alimentaires et animaux vivants 2001 ...
30
1.8
Commerce extérieur des Etats membres
Produits alimentaires et animaux vivants 1992-2001 ...
31
1.9
Production végétale sélectionnée dans l’UE et dans le monde,
1991 et 2001 ...
32
1.10
Effectif animal dans l’UE et dans le monde, 1991 et 2001 ...
33
1.11
Production de viande dans l’UE et dans le monde, 1991 et 2001 ...
34
2. Superficie et production végétale
Tableaux
2.1 Superficie totale et agricole par grande catégorie 1992-2001 ... 3
7
2.2 Terres arables par catégorie 2001... 3
9
2.3 Superficies des cultures permanentes par catégorie 2001... 3
9
2.4 Cultures importantes, superficie et production récoltée 1992-2001...
40
2.5
Cultures céréalières importantes, superficie et production récoltée
2001 ... 4
8
2.6
Principales cultures légumières, superficie et production récoltée
2.11 Bilan d'approvisionnement, légumes secs 1991/92-2000/01... 6
3
2.12 Bilan d'approvisionnement, sucre 1991/92-2000/01 ... 6
5
2.13 Bilan d'approvisionnement, vin 1991/92-2000/01 ... 6
8
2.14
Produits végétaux, auto-approvisionnement ...
1991/92-2000/01 ...
70
Texte
Notes méthodologiques concernant les bilans d'approvisionnement ... 7
1
3. Production animale
Tableaux
3.1 Effectifs bovins en décembre 1992-2001... 7
5
3.2 Effectifs bovins par catégorie 2001... 7
6
3.3 Structure des élevages de bovins, total 1999 ... 7
7
3.4 Structure des élevages de vaches laitières 1999... 7
8
3.5 Structure des élevages de vaches non laitières 1999... 7
9
3.6 Effectifs porcins en décembre 1992-2001 ...
80
3.7 Effectifs porcins par catégorie 2001...
81
3.8 Structure des élevages porcins, total 1999 ... 8
2
3.9 Structure des élevages de porcs à l'engraissement 1999 ... 8
3
3.10 Structure des élevages de truies 1999... 8
4
3.11 Effectifs des ovins et caprins en décembre 1992-2001 ... 8
5
3.12 Bilan d'approvisionnement, viande 1991-2000 ... 8
6
3.13 Auto-approvisionnement et consommation humaine, viande 2001 ... 8
9
3.14
Lait entier à la ferme, production et principales utilisations
1991-2000 ...
90
3.15
Activités des laiteries, lait entier disponible et principales productions
1992-2001 ...
91
3.16
Auto-approvisionnement et consommation humaine, produits
laitiers 2000... 9
3
3.17 Bilan d'approvisionnement, œufs total 1992-2001... 9
4
Texte
Notes méthodologies concernant le concept de superficie ...
et les bilans d'approvisionnement ... 9
5
4. Structure des exploitations agricoles – 1979/80 - 1999/2000
Graphiques
4.1 SAU par exploitation ... 10
3
4.2 Pourcentage des exploitations ayant moins de 5 ha de SAU ... 10
6
4.3
Pourcentage de la main d’œuvre familiale dans le total de la
main d’œuvre agricole... 1
20
4.4 Exploitations par classe de grandeur de la SAU (1000 ha) ... 10
7
4.5 Exploitations par classe de dimension économique (UDE) ... 10
9
Exploitations par orientation technico-économique
4.6 Exploitations spécialisées à grandes cultures ... 1
11
4.7 Exploitations horticoles spécialisées... 1
12
4.8 Exploitations herbivores cultures permanentes ... 1
13
4.9 Exploitations herbivores spécialisées ... 1
14
4.10 Exploitations granivores spécialisées ... 11
5
4.11 Exploitations de polyculture... 11
6
4.12 Exploitations de polyélevage... 11
7
4.13 Exploitations avec cultures mixtes/polyélevage ... 11
8
La main d’œuvre agricole
4.14 Main d’œuvre (1000 UTA)... 11
9
4.15 Main d’œuvre (1000 personnes) ... 1
20
4.16 Exploitants qui sont en même temps chefs d’exploitation ... 1
21
4.17
Exploitations et superficie agricole utilisée dans les zones défavorisées
... 12
3
4.18
Exploitations et superficie agricole utilisée dans les zones de
montagne ... 12
4
Texte
Notes méthodologiques concernant l'orientation
technico-économique, la marge brute standard, la dimension économique ...
d'une exploitation et l'unité travail/année... 12
7
5. Prix et indices de prix
Tableaux
5.1 Prix de vente des produits végétaux, 1992-2001... 1
31
5.2 Prix de vente des produits animaux, 1992-2001... 13
7
5.3 Prix d'achat des moyens de production agricole, 1992-2001 ... 1
42
5.4
Indices UE des prix à la production des produits agricoles, indices
des prix nominaux, 1992-2001... 14
5
5.5
Indices UE des prix à la production des produits agricoles, indices
des prix déflatés, 1992-2001... 14
6
5.6
Indices UE des prix à la production des produits agricoles importants,
indices des prix nominaux, 1992-2001 ... 14
7
5.7
Indices UE des prix à la production des produits agricoles importants,
indices des prix déflatés, 1992-2001 ... 14
9
5.8
Indices UE des prix d'achat des moyens de production agricole,
indices des prix nominaux, 1992-2001 ... 1
51
5.9
Indices UE des prix d'achat des moyens de production agricole,
indices des prix déflatés, 1992-2001 ... 1
52
5.10
Indices UE des prix d'achat des moyens de production agricole
importants, indices des prix nominaux, 1992-2001... 1
53
5.11
Indices UE des prix d'achat des moyens de production agricole
Tableaux
6.1
Production agricole, consommation intermédiaire et valeur ajoutée
1992-2001 ... 1
65
6.2
Indices de volume production agricole, consommation intermédiaire
et valeur ajoutée 1992-2001 ... 1
70
6.3
Principaux postes de la production agricole et de la consommation
intermédiaire, 1992-2001 ... 1
72
6.4
Indices du revenu réel des facteurs dans l’agriculture par unité de...
travail annuel, 1992-2001... 17
7
Texte
Notes méthodologiques sur les comptes de l'agriculture...
181
7. Sylviculture
Graphique
7.1
Forêts et autres superficies boisées en pourcentage de la superficie
totale ... 1
85
Tableaux
7.1 Forêts et autres superficies boisées ... 1
86
7.2 Production de bois rond, 1992-2001 ... 18
7
7.3 Production et commerce pour le bois rond, 1992-2001 ... 18
8
Texte
Notes méthodologiques sur les superficies boisées et sur la ...
production et le commerce pour le bois brut... 1
90
8. Pêche
Graphique
8.1 Production de la pêche : EEE, 1992-2001 ... 1
93
Tableaux
8.1 Production de la pêche totale, 1992-2001 ... 1
94
8.2 Captures totales, 1992-2001... 1
95
8.3 Production aquacole totale, 1992-2001 ... 1
96
Texte
Notes méthodologiques sur les captures... 1
97
9. Annexes
9.1 Publications d'Eurostat sur l'agriculture, la sylviculture et la pêche ...
205
9.2
Liste des adresses des Instituts statistiques nationaux et des
Unités :
ECU
=
Unité monétaire européenne
ha
=
Hectare = 10.000 m²
hl
=
Hectolitre = 100 l
kg
=
Kilogramme
l
=
Litre
m³
=
Mètre cube
Mio
=
Million
Mrd
=
Milliard
t
=
Tonne
TJ
=
Tonnage de jauge brut
UDE
=
Unité de dimension européenne
UTA
=
Unité travail/année
Etats membres :
B
=
Belgique
DK
=
Danemark
D
=
Allemagne
EL
=
Grèce
E
=
Espagne
F
=
France
IRL
=
Irlande
I
=
Italie
L
=
Luxembourg
NL
=
Pays-Bas
A
=
Autriche
P
=
Portugal
FIN
=
Finlande
S
=
Suède
UK
=
Royaume Uni
Autres abréviations :
AELE
=
Association européenne de libre échange
CE
=
Communautés européennes
EUR 12 / 15
=
Ensemble des pays membres de l'UE
Eurostat
=
Office statistique des Communautés européennes
FAO
=
Organisation des Nations unies pour l'alimentation et l'agriculture
OCDE
=
Organisation de coopération et de développement économique
SITC
=
Classification standard du commerce international
TVA
=
Taxe à la valeur ajoutée
UE
=
Union européenne
UEBL
=
Union économique belgo-luxembourgeoise
S
IGNES EMPLOYES
–
Néant
0
è
Donnée inférieure à la moitié de l'unité utilisée
0,0
æ
.
Non applicable
..
Donnée secrète
:
Donnée non disponible
Gesamtfläche und landwirtschaftliche Fläche
Total and agricultural area
Superficie totale et agricole
Gesamtfläche Landwirtschaftliche Fläche Ackerland
Total area Utilised agricultural area Arable land
Superficie totale Superficie agricole utilisée Terres arables
1991 2001 1991 2001 1991 2001
1000 ha
EU-15 323 529 323 430 140 799 125 723 76 741 72 978
Belgique/België 3 052 3 053 1 375 1 390 781 845
Danmark 4 309 4 309 2 786 2 694 2 563 2 498
Deutschland 35 697 35 703 17 136 17 038 11 559 11 810
Ellada 13 196 13 196 5 169 3 913 2 329 2 796
España 50 599 50 488 30 054 25 428 15 185 13 019
France 54 909 54 909 30 369 29 678 17 838 18 317
Ireland 7 029 7 030 4 444 4 458 754 960
Italia 30 132 30 134 16 946 15 355 9 025 8 172
Luxembourg 259 259 126 128 55 61
Nederland 3 551 3 552 1 971 1 933 888 1 005
Österreich 8 386 8 386 3 477 3 375 1 427 1 379
Portugal 9 191 9 191 4 121 3 791 2 445 1 610
Suomi/Finland 33 815 33 815 2 539 2 216 2 521 2 185
Sverige 44 996 44 997 3 358 2 966 2 790 2 592
United Kingdom 24 410 24 410 16 928 11 360 6 580 5 729
1.1
Aufgliederung der Gesamtfläche nach Hauptkategorien
Distribution of total area by main category
Répartition de la superficie totale par grandes catégories
EU-15 / 2001
Übrige Fläche Other area Autre superficie
20% Dauerkulturen
Permanent crops Cultures permanentes
4%
Gewässer Water
Eaux 4% Ackerland
Arable land Terres arables
23%
Zivile Erwerbstätige nach Wirtschaftsbereichen
Civilian employment by sector of activity
Emploi civil par secteur d'activités
Insgesamt Landwirtschaft, Industrie Dienstleistungen Forstwirtschaft, Fischerei
Total Agriculture, forestry and Industry Services fisheries
Total Agriculture, sylviculture Industrie Services et pêche
1991 2001 1991 2001 1991 2001 1991 2001
(1000)
EU-15 : 160 947 : 6 701 : 46 152 : 108 094
Belgique/België 3 719 4 039 101 56 1 135 1 029 2 483 2 954 Danmark 2 619 2 712 149 96 723 689 1 746 1 927 Deutschland 37 007 36 528 1 554 956 14 915 11 974 20 539 23 598 Ellada 3 632 3 918 807 627 933 894 1 892 2 397 España 12 6221 15 877 1 3761 1 025 4 171 5 023 7 0761 9 828 France 22 050 23 672 1 332 964 6 625 6 163 14 093 16 546 Ireland 1 130 1 709 158 120 328 498 644 1 092 Italia 21 520 21 373 1 825 1 113 6 933 6 783 12 763 13 477 Luxembourg 162 185 6 3 47 40 110 142 Nederland 6 381 7 621 279 238 1 632 1 644 4 470 5 739
Österreich : 3 697 215 1 086 2 396
Portugal 4 8321 4 984 8421 645 1 643 1 697 2 3471 2 642
Suomi/Finland : 2 396 : 140 : 649 : 1 607
Sverige : 4 330 : 114 : 1 028 : 3 187
United Kingdom 25 963 27 908 593 390 8 106 6 956 17 263 20 563
EFTA : 6 268 : 276 : 1 489 : 4 503
Iceland : 158 : 12 : 36 : 109
Norway : 2 274 : 93 : 495 : 1 687
Switzerland :: 3 836 :: 171 : 958 : 2 707
USA : : : : : : : :
Nippon : : : : : : : :
%
EU-15 100 100 : 4,2 : 28,7 : 67,2
Belgique/België 100 100 2,7 1,4 30,5 25,5 66,8 73,1
Danmark 100 100 5,7 3,5 27,6 25,4 66,7 71,1
Deutschland 100 100 4,2 2,6 40,3 32,8 55,5 64,6
Ellada 100 100 22,2 16,0 25,7 22,8 52,1 61,2
España 100 100 10,9 6,5 33,0 31,6 56,1 61,9
France 100 100 6,0 4,1 30,0 26,0 63,9 69,9
Ireland 100 100 14,0 7,0 29,0 29,1 57,0 63,9
Italia 100 100 8,5 5,2 32,2 31,7 59,3 63,1
Luxembourg 100 100 3,6 1,6 29,0 21,6 67,9 76,8
Nederland 100 100 4,4 3,1 25,6 21,6 70,1 75,3
Österreich 100 100 0,0 5,8 0,0 29,4 0,0 64,8
Portugal 100 100 17,4 12,9 34,0 34,0 48,6 53,0
Suomi/Finland 100 100 : 5,8 : 27,1 : 67,1
Sverige 100 100 : 2,6 : 23,7 : 73,6
United Kingdom 100 100 2,3 1,4 31,2 24,9 66,5 73,7
EFTA 100 100 :: 4,4 : 23,8 : 71,8
Iceland 100 99 : 7,6 : 22,8 : 69,0
Norway 100 100 : 4,1 : 21,8 : 74,2
Switzerland 100 100 :: 4,5 : 25,0 : 70,6
Bruttowertschöpfung zu Faktorkosten nach Wirtschaftsbereichen
Gross value added at factor cost by economic branches
Valeur ajoutée brute au coût des facteurs par branche économique
Insgesamt Landwirtschaft, Industrie Dienstleistungen Forstwirtschaft, Fischerei
Total Agriculture, forestry and Industry Services fisheries
Total Agriculture, sylviculture Industrie Services et pêche
1990 2000 1990 2000 1990 2000 1990 2000
(Mrd EURO)
EU-15 125: 7 902 209 : 167 3 : 1 769 : 5 966
Belgique/België 146 228 3 3 38 50 105 175 Danmark 95 154 4
4
19 33 72 117Deutschland : 1 889 : 22 : 458 : 1 409
Ellada : 112 : 8 : 15 : 89
España 394 571 21 20 97 118 276 433 France 895 1 302 33 36 203 261 659 1 005 Ireland 33 93 3 3 10 32 20 58 Italia 831 1 080 28 30 217 251 586 799 Luxembourg 9 21 0 0 2 3 7 18 Nederland 218 371 10 10 52 76 156 285 Österreich 120 195 4 4 30 45 86 146 Portugal 53 104 4 4 13 22 36 78 Suomi/Finland 97 117 6 4 24 32 67 81 Sverige 172 227 6 4 41 53 142 170 United Kingdom 727 1 437 13 14 198 319 513 1 104
%
EU-15 : : : : : : : :
Belgique/België 100 100 2,1 1,3 26,0 21,9 71,9 76,8
Danmark 100 100 4,2 2,6 20,0 21,4 75,8 76,0
Deutschland : 100 : 1,2 : 24,2 : 74,6
Ellada : 100 : 7,1 : 13,4 : 79,5
España : 100 5,3 3,5 24,6 20,7 70,1 75,8
France 100 100 3,7 2,8 22,7 20,0 73,6 77,2
Ireland : 100 : 3,2 : 34,4 : 62,4
Italia 100 100 3,4 2,8 26,1 23,2 70,5 74,0
Luxembourg : 100 : : : 14,3 : 85,7
Nederland : 100 4,6 2,7 23,9 20,5 71,6 76,8
Österreich 100 100 3,3 2,1 25,0 23,1 71,7 74,9
Portugal : 100 7,5 3,8 24,5 21,2 67,9 75,0
Suomi/Finland 100 100 6,2 3,4 24,7 27,4 69,1 69,2
Sverige : 100 : 1,8 : 23,3 : 74,9
EU Handel in landwirtschaftlichen Produkten
EU trade in agricultural commodities
Commerce de l'UE des produits agricoles
S
I
T
C
0-9 GESAMTHANDEL TOTAL TRADE
0 Nahrungsmittel und lebende Tiere Food and live animals
01 Fleisch und Zubereitungen von Fleisch Meat and meat preparations
011 Fleisch von Rindern, frisch oder gefroren Meat of bovine animals, fresh, chilled or frozen 012 Anderes Fleisch und geniessb. Schlachtnebenerz. frisch, Other meat and edible meat offal, fresh, chilled or frozen
gekühlt oder gefroren
02 Milch und Milcherzeugnisse; Vogeleier Dairy products and bird's eggs
022 Milch und Rahm, Milcherzeugnisse Milk and crean and milk products other than butter and cheese 024 Käse und Quark Cheese and curd
03 Fische, Krebstiere, Weichtiere u.s.w.; Zubereitungen daraus Fish, crustaceans and molluscs and preparations thereof
034 Fische frisch, gekühlt oder gefroren Fish, fresh, chilled or frozen
04 Getreide und Getreideerzeugnisse Cereals and cereal preparations
041 Weizen und Mengkorn, nicht gemahlen Wheat and meslin, unmilled
042 Reis Rice
043 Gerste, nicht gemahlen Barley unmilled 044 Mais, nicht gemahlen Maize unmilled
048 Zuber. aus Getreide, Mehl, Fruchtenstärke oder Gemüsestärke Cereal preparations and preparations of flour or fruit or vegetable starches
05 Gemüse und Früchte Vegetables and fruit
054 Gemüse, frisch, gekühlt, gefroren oder in einfacher Weise Vegetables, fresh, chilled, frozen or simply preserved and haltbar gemacht und andere geniessbare Gemüsen other edible vegetable products
057 Geniessbare Früchte, frisch oder getrocknet Fruits and nuts, fresh or dried
06 Zucker, Zuckerwaren und Honig Sugars, sugar preparations and honey
07 Kaffee, Tee, Kakao, Gewürze und Waren daraus Coffee, tea, cocoa, spices and manufactures thereof
071 Kaffee und Kaffeeersatz Coffee and coffee substitutes
073 Schokolade und kakaohaltige Lebensmittelzubereitungen Chocolate and other food preparations containing cocoa n.e.s.
08 Tierfutter Feeding stuff for animals
(ausgenommen ungemahlenes Getreide) (not including unmilled cereals)
09 Verschiedene geniessbare Waren und Zubereitungen Miscellaneous edible products and preparations
1 Getränke und Tabak Beverages and tobacco
112 Alkoholhaltige Getränke Alcoholic beverages 122 Tabak, verarbeitet Tobacco, manufactured
2 Rohstoffe (ausgn. Nahrungsmittel und mineralische Crude materials, inedible, except fuels Brennstoffe)
EU Handel in landwirtschaftlichen Produkten
EU trade in agricultural commodities
Commerce de l'UE des produits agricoles
(MIO EURO)
Import
Export
S
Insgesamt
I
Intra Extra Extra
T
Total C
2000 2001 2000 2001 2000 2001 2000 2001
1.486.959 1.506.837 1.033.436 1.028.014 2.520.395 2.534.850 942.044 985.331 COMMERCE TOTAL 0-9
112.275 115.088 49.191 52.213 161.465 167.300 35.485 36.597 Produits alimentaires et animaux vivants 0
17.638 17.603 3.690 4.318 21.328 21.921 4.449 4.247 Viandes et préparations de viande 01
4.632 3.345 930 729 5.561 4.074 639 565 Viande bovine, fraîche, réfrigérée ou congelée 011 9.215 10.014 1.838 2.279 11.053 12.293 3.115 3.043 Autres viandes, abats comestibles, frais, 012
réfrigérés ou congelés
16.923 17.090 995 1.161 17.918 18.251 5.185 5.197 Produits laitiers et oeufs d'oiseaux 02
7.554 7.584 204 237 7.758 7.821 2.899 2.726 Lait, crème de lait et produits laitiers ex. beurre et fromages 022 6.600 6.928 528 646 7.128 7.574 1.727 1.891 Fromage et caillebotte 024
9.365 9.987 11.554 12.593 20.919 22.580 1.921 2.087 Poissons, crustacés, mollusques etc. et préparations 03
4.688 5.018 5.123 5.715 9.811 10.734 1.248 1.396 Poissons frais, réfrigérés ou congelés 034
12.552 13.268 2.108 2.400 14.661 15.668 6.208 5.846 Céréales et préparations de céréales 04
2.658 2.739 653 948 3.311 3.686 1.338 1.265 Froment et méteil non moulus 041
644 684 434 434 1.078 1.119 146 110 Riz 042
628 762 11 46 640 808 1.288 629 Orge non moulue 043
1.388 1.410 483 422 1.871 1.832 75 90 Maïs non moulu 044 6.682 7.085 416 464 7.098 7.549 2.503 2.900 Préparations de céréales, farines, fécules de fruits 048
ou légumes
26.627 27.043 14.102 14.793 40.729 41.836 5.176 5.757 Légumes et fruits 05
8.938 9.322 2.522 2.702 11.460 12.024 1.347 1.507 Légumes et plantes potagères, frais, réfrigérés, ou congelés 054 ou conservés et autres produits végétaux, n.d.a., frais 9.008 9.298 7.494 8.155 16.502 17.453 1.615 1.858 Fruits, frais ou secs 057
3.938 4.520 1.585 1.762 5.523 6.282 2.387 2.616 Sucres, préparations à base de sucre et miel 06
7.047 6.917 7.408 6.626 14.454 13.543 2.791 3.100 Café, thé, cacao, épices et produits dérivés 07
1.633 1.448 4.413 3.385 6.046 4.833 817 900 Café et succédanés du café 071 3.757 3.833 320 352 4.077 4.185 1.198 1.381 Chocolat et préparations alimentaires contenant du cacao, 073
n.d.a.
5.393 5.727 5.449 6.188 10.842 11.915 1.935 2.000 Nouriture dest. aux animaux 08 (à l'excl. des céréales non moulues)
9.061 9.926 1.425 1.416 10.486 11.342 4.460 4.891 Produits et préparations alimentaires divers 09
20.410 21.838 5.617 6.187 26.027 28.025 14.432 14.967 Boissons et tabacs 1
11.758 11.796 2.838 3.416 14.596 15.212 10.972 11.511 Boissons alcooliques 112 5.462 6.546 186 186 5.648 6.731 2.004 1.894 Tabacs fabriqués 122
42.984 40.222 47.769 46.268 90.753 86.490 16.206 15.773 Matières brutes non comestibles, à l'exception des 2 carburants
Intra-Handel in der Europäischen Union
Intra trade in the European Union
Commerce intra dans l'Union Européenne
2001 (Mio EURO)
Nahrungsmittel und lebende Tiere Food and live animals Produits alimentaires et animaux vivants
Gesamt handel Insgesamt Lebende Tiere Fleisch usw. Molkerei- erzeug-nisse usw. Fische usw. Getreide usw. Gemüse und Früchte Tierfutter Andere Total trade Total Live animals Meat etc. Dairy products etc. Fish etc. Cereals etc. Vegetables
and fruits Fodder Other
Commerce total Total Animaux vivants Viandes etc. Produits laitiers etc. Poissons etc. Céréales etc. Légumes et fruits Nourriture animaux Autres
SITC ¹ 0-9 0 00 01 02 03 04 05 08 06+07+09
Intra Einfuhr ² • Intra imports ² • Imports intra ²
EU-15 1.506.837 115.088 3.006 17.603 17.090 9.987 13.268 27.043 5.727 21.363 Belgique/België 133.272 10.000 252 888 2.118 633 1.536 1.746 731 2.095 Danmark 34.508 2.878 11 456 301 287 379 634 226 585 Deutschland 307.253 21.303 388 2.921 3.040 1.193 1.720 7.700 1.075 3.267 Ellada 17.002 2.275 34 635 509 131 282 244 142 298 España 115.662 7.750 284 634 1.227 1.613 1.142 1.072 271 1.507 France 239.197 16.707 233 2.611 2.233 2.068 1.687 4.219 818 2.838 Ireland 37.050 2.641 131 365 266 130 482 517 176 575 Italia 146.945 13.092 972 2.900 2.603 1.838 1.362 1.707 505 1.205
Luxembourg 10.662 792 14 119 149 55 70 161 33 190
Nederland 120.354 11.905 257 1.196 1.718 543 1.576 2.011 518 4.085 Österreich 56.797 3.357 68 371 393 178 407 803 258 878 Portugal 33.072 3.224 133 516 371 555 584 531 145 388 Suomi/Finland 23.137 1.213 3 81 111 46 168 371 104 330 Sverige 46.114 2.738 4 387 230 165 281 866 160 645 United Kingdom 185.812 15.213 222 3.523 1.819 553 1.592 4.461 566 2.477
Intra Ausfuhr ² • Intra exports ² • Exports intra ²
EU-15 1.594.903 120.090 3.234 19.426 17.516 10.358 13.197 27.998 5.949 22.413 Belgique/België 154.793 14.561 264 2.713 1.980 569 1.387 4.104 837 2.708 Danmark 37.915 7.703 165 2.580 896 2.453 370 198 369 671 Deutschland 351.490 15.736 329 2.241 4.126 846 2.072 1.911 961 3.249
Ellada 4.680 1.086 0 10 104 214 85 634 6 32
España 92.976 12.616 263 1.403 663 1.495 681 7.056 231 823 France 219.565 19.511 1.115 2.661 3.222 898 4.182 3.182 1.098 3.154 Ireland 58.179 4.359 153 1.519 910 329 286 229 128 806 Italia 144.731 8.460 15 936 832 336 1.458 3.529 155 1.199
Luxembourg 10.105 389 21 33 152 20 30 72 3 57
Nederland 202.878 24.628 574 4.135 2.938 1.438 736 5.740 1.652 7.415 Österreich 48.609 2.256 47 458 530 5 311 471 76 357
Portugal 21.893 907 14 11 137 266 64 263 47 104
Suomi/Finland 25.925 328 0 31 126 2 47 18 6 98
Sverige 46.121 1.306 4 71 157 475 213 93 15 278
United Kingdom 175.045 6.245 271 623 743 986 1.273 500 364 1.460