White Rose Research Online URL for this paper:
http://eprints.whiterose.ac.uk/146384/
Version: Accepted Version
Article:
Ivson, P, Moreira, A, Queiroz, F et al. (2 more authors) (2019) A Systematic Review of
Visualization in Building Information Modeling. IEEE Transactions on Visualization and
Computer Graphics. ISSN 1077-2626
https://doi.org/10.1109/TVCG.2019.2907583
(c) 2018 IEEE. Personal use of this material is permitted. Permission from IEEE must be
obtained for all other uses, in any current or future media, including reprinting/republishing
this material for advertising or promotional purposes, creating new collective works, for
resale or redistribution to servers or lists, or reuse of any copyrighted component of this
work in other works.
[email protected] https://eprints.whiterose.ac.uk/ Reuse
Items deposited in White Rose Research Online are protected by copyright, with all rights reserved unless indicated otherwise. They may be downloaded and/or printed for private study, or other acts as permitted by national copyright laws. The publisher or other rights holders may allow further reproduction and re-use of the full text version. This is indicated by the licence information on the White Rose Research Online record for the item.
Takedown
If you consider content in White Rose Research Online to be in breach of UK law, please notify us by
IEEE TRANSACTIONS ON VISUALIZATION AND COMPUTER GRAPHICS, VOL. X, NO. X, DECEMBER 2018 1
A Systematic Review of Visualization in
Building Information Modeling
Paulo Ivson, Andr ´e Moreira, Francisco Queiroz, Wallas Santos, Waldemar Celes
Abstract—Building Information Modeling (BIM) employs data-rich 3D CAD models for large-scale facility design, construction, and operation. These complex datasets contain a large amount and variety of information, ranging from design specifications to real-time sensor data. They are used by architects and engineers for various analysis and simulations throughout a facility’s life cycle. Many techniques from different visualization fields could be used to analyze these data. However, the BIM domain still remains largely unexplored by the visualization community. The goal of this article is to encourage visualization researchers to increase their
involvement with BIM. To this end, we present the results of a systematic review of visualization in current BIM practice. We use a novel taxonomy to identify main application areas and analyze commonly employed techniques. From this domain characterization, we highlight future research opportunities brought forth by the unique features of BIM. For instance, exploring the synergies between scientific and information visualization to integrate spatial and non-spatial data. We hope this article raises awareness to interesting new challenges the BIM domain brings to the visualization community.
Index Terms—Visualization techniques and methodologies, information visualization, computer-aided design, building information modeling, survey.
F
1
I
NTRODUCTIONB
UILDINGInformation Modeling (BIM) is a set of meth-ods and tools to improve management of large-scale construction projects [1], [2]. These enterprises require mil-lions in investments and tight coordination among expert teams across several years of design, construction, and operation. BIM employs data-rich 3D CAD models as a central database for all physical, functional, and life-cycle information of a facility [3]. This integrated environment enables automated work processes and virtual simulations that increase productivity and reduce costs.Visualization plays a key role in several kinds of analysis in BIM: calling attention to inconsistencies in designs [4], combining spatial and temporal information for virtual construction planning [5], [6], highlighting hazardous work areas [7], and even plotting energy performance to evaluate environmental sustainability [8], [9], [10].
In all these use cases, the 3D CAD model acts as the main connector of information throughout the building life cycle. It represents a high-fidelity virtual replica of the physical world: geometry shapes, sizes, and locations accurately identify real components. Moreover, complex designs can amount to gigabytes of interdependent, quantitative, and qualitative metadata. The 3D CAD model also acts as an intuitive interface for architects and engineers to understand data patterns together with spatial context. This has lead to an increasing demand for visualization techniques based on richer BIM datasets, called nD models [11]. Despite all these challenges and opportunities, the BIM domain still remains largely unexplored by the visualization community.
• P. Ivson, A. Moreira, F. Queiroz, W. Celes are with Tecgraf Institute/PUC-Rio. E-mail:{psantos, asouza, chico, celes}@tecgraf.puc-rio.br
• W. Santos is with IBM. E-mail: [email protected] Manuscript received July XX, 2018; revised December XX, 2018.
The goal of this article is to encourage researchers of various visualization fields to increase their involvement with BIM. To this end, we present a comprehensive domain characterization to help understand the goals and motiva-tions of current practice. We hope this opens-up BIM as an interesting test bed for different kinds of visualization research. Solving its unique challenges can lead to new and interesting techniques that would also benefit other do-mains. Therefore, this survey aims to answer the following research questions:
Q1. What are the main use cases of BIM that employ visualization?
Q2. What are the project life-cycle phases where each use case applies?
Q3. What kinds of information are required by each use case?
Q4. What are the pros and cons of the current methods for visualizing this information?
Q5. What are the unique aspects of BIM that challenge visualization research?
Q6. How can the visualization community get more in-volved with BIM?
We have organized the results and contributions of our review in five sections. Section 4 first proposes a taxonomy to classify previous BIM research using four dimensions: Life Cycle Phases, Use Cases, Information, and Visualiza-tions. Section 5 then identifies the main application areas of visualization in BIM (Q1, Q2). Afterwards, Section 6 presents a critical analysis of the visualization techniques employed in these selected use cases (Q3,Q4). Based on our findings, Section 7 highlights unique challenges for visual-ization research in BIM (Q5). Finally, Section 8 concludes our research and gives advice on increasing the cooperation between visualization and BIM communities (Q6).
This is the author's version of an article that has been published in this journal. Changes were made to this version by the publisher prior to publication. The final version of record is available at http://dx.doi.org/10.1109/TVCG.2019.2907583
2
R
ELATEDW
ORKPrevious surveys on BIM have focused either on industry adoption or on specific visualization applications. The cur-rent article builds upon these results to conduct a rigorous categorization of visualization across an entire facility’s life cycle. To the best of our knowledge, no previous work has assembled such a comprehensive analysis.
2.1 BIM Adoption in Industry
Early surveys found that BIM applications focused mainly on design coordination and review [12], [13]. Later years showed growing interest in construction planning [14], sus-tainable design [15], and facility management [16]. Still, researchers highlighted many barriers and unexplored ap-plications in later project phases [17], [18].
Around 2015, case studies indicated BIM was being used for clash detection, construction scheduling, and mainte-nance management [19]. Meanwhile, practitioners identi-fied emerging areas related to energy management, safety management, and code checking [20], [21]. During 2016 and 2017, surveys in the UK found BIM use mainly in construction scheduling [22], [23]. At the same time, imple-mentations in the Middle East still focused more on design review and clash analysis [24]. In 2018, a survey in the US indicated BIM had greater potential for adoption in facility management [25].
2.2 BIM Visualizations
Seminal research found that time animations within the 3D CAD model (4D animations) improved comprehension and highlighted inconsistencies in construction plans [26], [27], [28]. Later reports investigated the benefits of coordinated-multiple-views for these kinds of analysis [29], [30], [31].
User studies and interviews have been employed to improve thermal analysis [32], 4D animations [33], [34], and facility operation [35]. Many of these works criticized traditional 4D animations that changed geometry visibility since it hindered the users’ judgment and lowered their understanding of the construction sequence. Meanwhile, another approach augmented traditional Gantt charts and network diagrams with annotations and highlights [36]. More recent surveys indicated emerging challenges related to visual analysis and exploration of large datasets [37], [38].
3
S
YSTEMATICR
EVIEWM
ETHODSystematic literature reviews have been successfully em-ployed in numerous areas of science [39], [40], [41], [42]. They provide a means to present a fair evaluation of a re-search topic by using a trustworthy, rigorous, and auditable methodology. We adopted this scheme to maximize our sur-vey’s reach while also enabling future work to build upon our findings. Nevertheless, covering the tens of thousands of articles in the entire BIM literature simply is not feasible. Therefore, we focused this first major survey on the more common desktop visualizations applied throughout a facility’s life cycle. We also required sufficient evidence that the techniques were used in real-world practice. More specific topics such as immersive visualizations or BIM for historic buildings (HBIM) have been left for future surveys.
This way, we aim to present an introductory overview of current state of affairs for the visualization community.
We selected academic full papers published in peer-reviewed international journals using the Scopus digital library [43]. It not only features a powerful search mech-anism but also covers a wide journal range, especially in Engineering fields [44]. Initial search results consisted of 372 articles, which were then filtered down to 140 using our inclusion and exclusion criteria. In the end, we applied the proposed classification taxonomy and proceeded to an in-depth analysis of each work. A more detailed description of our systematic method is available as supplementary material to this paper. The complete dataset of reviewed articles is available at IEEE DataPort [45].
4
C
LASSIFICATIONT
AXONOMYWe propose a taxonomy to analyze current visualization practice in BIM using 4 dimensions: Life Cycle Phases (Sec-tion 4.1), Use Cases (Sec(Sec-tion 4.2), Informa(Sec-tion (Sec(Sec-tion 4.3), and Visualizations (Section 4.4). They were designed to clarify the motivation of previous solutions as well as to provide common ground for comparing their visualization techniques. The following subsections detail each of these dimensions.
4.1 Life Cycle Phases
The first dimension identifies the phases of a facility’s life cycle. Each phase consists of different activities geared towards common goals. Most of the information produced in one phase is consumed in the others afterwards. This dimension should help a visualization researcher understand the temporal sequencing of different BIM analysis. We reuse the same organization of 3 main phases, with 3 sub-phases each, first proposed by Succar [46]:
Design
• Conceptualization, Programming and Cost Planning:
ini-tial draft of construction scope for bidding.
• Architectural, Structural and Systems Design: designs
are produced by various engineering disciplines.
• Analysis, Detailing, Coordination and Specification:
inte-gration and verification of produced designs.
Construction
• Construction Planning and Construction Detailing:
planning of activities to be conducted in the field.
• Construction, Manufacturing and Procurement:
compo-nents are purchased, fabricated, and assembled.
• Commissioning, As-Built and Handover: systems testing
and certification for facility operation.
Operation
• Occupancy and Operations: monitoring of facility use
and systems performance.
• Asset Management and Facility Maintenance: life
ex-pectancy and maintenance of components.
• Decommissioning and Major Re-Programming:
IEEE TRANSACTIONS ON VISUALIZATION AND COMPUTER GRAPHICS, VOL. X, NO. X, DECEMBER 2018 3
4.2 Use Cases
From previous work (Section 2), we have assembled 35 different use cases that employ visualization. These use cases are organized around themes that follow the terminology commonly used in the BIM domain [11]. Within each theme, use cases share common goals and are typically interrelated (e.g. the results of one analysis affect the inputs of others).
Design Review
• Requirements Analysis: verification if the design meets
the defined engineering specifications.
• Structural and Mechanical Analysis: numerical
compu-tations to validate the facility’s physical integrity.
• Regulatory Compliance Checking: verification of
build-ing codes and other technical/legal regulations.
• Clash Detection: identification and correction of
spa-tial interferences among facility components.
• Change Management: tracking of sources and
conse-quences of changes in design.
• Constructability Analysis: assessment of the ease of
constructing a given design.
Work Planning
• Site Layout Planning: spatial organization of
work-force, materials, machinery, and structures.
• Quantity Take Off: computation of materials totals for
procurement and fabrication.
• Risk Management: analysis of safety, quality, schedule,
cost, environmental, and social risk factors.
• Cost Management: budgeting and tracking of
ex-penses related to activities, resources, and others.
• Task Scheduling: programming of activities in time.
• Workspace Conflict Analysis: inconsistencies in work
plans due to physical overlap of activities.
• Field Work Simulation: detailed animations and
nu-merical simulations of construction activities.
Work Execution
• Digital Fabrication: automated fabrication of
compo-nents from geometric designs.
• Resource Management: available, allocated, and free
workforce, materials, machinery, and structures.
• Field Management: detailed coordination and live
feedback of work in the field.
• Positioning and Navigation: use of digital drawings to
locate areas and components of interest in the field.
• Progress Tracking: monitoring of task execution status.
• Productivity Monitoring: metrics to compute and
com-pare actual productivity with original benchmarks.
• Quality Management: defect inspection and tracking.
• Procurement and Expediting: purchase of goods and
tracking their shipping.
• Logistics Management: storage and routing of
work-force, materials, machinery, and structures.
Sustainability Analysis
• Lighting Analysis: degree of illumination from natural
lighting and artificial fixtures.
• Thermal Analysis: heat absorbed and emitted by
indi-vidual components and areas.
• Ventilation Analysis: air circulation, speed, and
move-ment around and across internal areas a facility.
• Energy Analysis: amount of electrical energy
pro-duced and consumed by the building’s installations.
• Emission Analysis: environmental impact in water, air,
soil, thermal, radioactive, noise, light, and waste.
• Natural Resource Use: amount of resources necessary
to conduct activities.
Facility Management
• Remote Operation: monitoring and electronic control
of a facility’s equipment and automation systems.
• Maintenance Management: component physical
in-tegrity and maintenance plans.
• Damage Assessment: structural resistance and failure
against sources of physical damage.
• Emergency Management: simulation of disaster
scenar-ios, evacuation, and contingency plans.
• Security Management: isolation from outside threats.
• Signage Placement: best locations to place signs to
inform occupants and improve circulation.
• Space Management: space ownership and occupancy.
4.3 Information
This taxonomy dimension consolidates all information we found to be visualized in the 140 surveyed papers. We organized them in a two-level hierarchy inspired by basic principles of Object-Oriented design [47]. The higher level (in bold) represents “packages” of information pertaining to the same kinds of BIM analysis. The lower level (in
italic) represents “classes” of information about the same
conceptual entities. Each class lists some examples of the actual information visualized in BIM. For instance, “Schedule (task)” identifies information related to tasks within a Schedule analysis, such as task start and finish dates.
Scope
• Item: id, type, relationships.
• Quantity: counts, lengths, areas, weight.
• Spatial: component size, position, distances.
• Technical: engineering specifications, standards. Schedule
• Task: id, start, finish, duration, progress, workspace. Cost
• Total: cost per component, task, resource.
Sustainability
• Ambient: lighting, temperature, humidity.
• Material: heat transmission and absorption.
• Use: usage of energy, water, gas, fuel.
• Emission: emissions of pollutants in air, water, soil.
• Level: degree of environmental sustainability.
Facility
• Occupancy: management of occupants across spaces.
• Degradation: efficiency loss and remaining lifetime.
• Sensor: id, type, readings, automation control.
This is the author's version of an article that has been published in this journal. Changes were made to this version by the publisher prior to publication. The final version of record is available at http://dx.doi.org/10.1109/TVCG.2019.2907583
• Problem: type, causes, consequences.
• Work Log: staff id, actions taken, access routes. Risk
• ID: risk id, type.
• Quantity: probability, impact, count, rate. • Relationships: causes and effects.
• Action: prevention and contingencies.
Resource
• ID: resource id, type.
• Quantity: total capacity, available, allocated.
• Manufacturing: fabrication capacity.
Supply Chain
• Procurement: supplier orders, shipping, delivery.
• Logistics: storage areas, transportation, capacities. Security
• Access Control: access points, perimeter protection.
• Sensor: coverage, operating status, detection status. • Assessment: thread probability, impact, security level. Mechanical
• Physical: force/stress over component.
• Damage: structural integrity, physical damage.
Quality
• Inconsistency: inconsistency type and amount.
4.4 Visualizations
The last dimension organizes the visualization techniques in BIM using two categorizations. First, we distinguish the display of information either through spatial views (2D/3D CAD) or abstract views (Charts). The former should follow the precepts of spatial and scientific visualization. The latter should tap into the field of information visualization. Our goal here is to understand which kinds of BIM analysis are more appropriate to each graphical display.
View
• 2D CAD: schematic drawings, blueprints, maps.
• 3D CAD: actual shapes of physical entities.
• Chart: tables, hierarchies, graphs, diagrams, plots.
The second categorization describes how each visual-ization technique displays information within each view. We employ the concept of Marks and Channels from Mun-zner [48]. Marks represent graphical entities while Channels correspond to their visual properties. We combined some of the author’s original Marks/Channels with new ones designed to facilitate analysis of the BIM domain.
The first new Marks are: original geometry, 2D geometry, and 3D geometry. These help evaluating the pros and cons of using the actual building components to convey infor-mation. These original geometries can best take advantage of the user’s familiarity with the virtual design. However, some information such as hazard areas may require addi-tional 2D/3D geometries to be displayed properly. In this case, care must be taken to avoid increasing visual clutter and occlusion in complex 3D scenes.
We also indicate other graphical entities common in BIM, such as: lines, glyphs, icons, and text. The first two are already established Marks in the visualization literature. Meanwhile, icons in BIM typically mimic traffic signs that vary in shape and color Channels. Finally, the text Mark helps to identify missed opportunities of adopting more intuitive graphical displays.
Regarding Channels, we reuse some already proposed by Munzner: color, shape, size, orientation, and position. In addition, some BIM applications preserve geometry colors but change their outline color/weight/stipple, shading (illumination model), or texture. For example, a different outline color and shading can be used to highlight components of interest [49]. We also observed a handful of visualizations that varied the degree of geometry transparency according to a numerical quantity. On the other hand, visibility is often used to indicate categorical information, such as construction status. We also propose an ordering Channel to make evident when relative positioning between Marks is more important than absolute.
Mark
• Original Geometry: original facility components.
• 2D Geometry: additional planar objects.
• 3D Geometry: additional 3D objects.
• Line: straight lines and curves.
• Text: identifiers, annotations, strings in general. • Icon: image that represents a logical concept.
• Glyph: abstract graphical symbols.
Channel
• Color: hue used to fill the surface of a graphical entity.
• Shading: surface illumination model.
• Outline Color: hue used for contour lines.
• Outline Weight: thickness of contour lines.
• Outline Stipple: dashed patterns on contour lines.
• Visibility: whether a graphical entity is drawn.
• Transparency: degree of blending with background.
• Shape: geometric form of a graphical entity.
• Size: length, width, height of a graphical entity. • Orientation: tilt angles of graphical entities. • Position: absolute spatial location.
• Texture: surface color patterns. • Ordering: relative spatial location.
5
A
PPLICATIONA
REAS OFV
ISUALIZATIONThis section presents the results of our literature review regarding the frequency of use of visualization in BIM. From the 140 articles returned by the systematic search procedure, we have identified 248 different visualization applications. This is because many research articles apply their solutions in more than one use case and project phase. We identify the main application areas of visualization, how they are related, and what are the trending topics in recent history.
5.1 Statistical Distribution
IEEE TRANSA CTIONS ON VISU ALIZA TION AND COMPUTER GRAPHICS , V OL. X, NO . X, DECEMBER 2018 5
Clash Detection 0 0 8 1 0 0 0 0 0 Requirements Analysis 1 4 3 0 0 0 0 0 0 Structural and Mechanical Analysis 0 1 1 1 0 0 0 0 0 Regulatory Compliance Checking 0 1 1 0 0 0 0 0 0 Change Management 0 0 1 0 0 0 0 0 0 Constructability Analysis 0 0 1 0 0 0 0 0 0 Task Scheduling 0 0 0 31 2 0 0 0 0 Risk Management 0 0 1 12 7 0 0 0 0 Workspace Conflict Analysis 0 0 0 16 0 0 0 0 1 Cost Management 1 3 1 6 4 0 0 0 0 Field Work Simulation 0 0 0 12 1 0 0 0 1 Site Layout Planning 0 0 0 13 0 0 0 0 0 Quantity Take Off 0 0 1 4 0 0 0 0 0 Progress Tracking 0 0 0 2 27 1 0 0 0 Productivity Monitoring 0 0 0 1 5 0 0 0 0 Quality Management 0 0 0 0 5 0 0 0 0 Logistics Management 0 0 0 2 2 0 0 0 0 Procurement and Expediting 0 0 0 0 3 0 0 0 0 Field Management 0 0 0 0 3 0 0 0 0 Digital Fabrication 0 0 0 0 2 0 0 0 0 Resource Management 0 0 0 1 2 0 0 0 0 Positioning and Navigation 0 0 0 0 1 0 0 0 0 Energy Analysis 0 1 6 1 0 0 3 1 0 Thermal Analysis 0 1 2 0 0 0 3 0 0 Lighting Analysis 1 1 3 0 0 0 0 1 0 Emission Analysis 1 2 0 2 1 0 0 0 0 Ventilation Analysis 0 1 0 0 0 0 0 0 0 Natural Resource Use 0 0 0 1 0 0 0 0 0 Maintenance Management 0 1 1 0 0 0 0 5 0 Emergency Management 0 0 2 0 0 0 0 1 0 Remote Operation 0 0 0 0 0 0 1 1 0 Damage Assessment 0 0 0 0 0 0 0 2 0 Security Management 0 0 0 1 0 0 1 0 0 Signage Placement 0 0 0 0 0 0 1 0 0 Space Management 0 0 0 0 0 0 1 0 0
Conceptualization, Programming and Cost
Planning Architectural, Structural and Systems Design Analysis, Detailing, Coordination and Specification Construction Planning and Construction Detailing Construction, Manufacturing and Procurement Commissioning, As-Built and Handover
Occupancy and Operations Asset Management and Facility Maintenance Decommissioning and Major Re-Programming
Design Construction Operation
W o rk E x e cu ti o n S u st a in a b il it y A n a ly si s F a ci li ty Ma n a g e m e n t D e si g n Re v ie w W o rk P la n n in g 4 16 32 107 65
1 10 11 2
[image:6.612.93.750.79.480.2]9 8 3 2 1 1 33 20 17 15 14 13 5 30 6 5 4 3 3 2 3 1 12 6 6 6 1 1 7 3 2 2 2 1 1
Fig. 1: Heat map and histograms showing the statistical distribution of the 248 surveyed applications of visualization in BIM. The horizontal axis contains life cycle phases from Section 4.1 and the vertical axis follows the use cases from Section 4.2. Each heat map cell indicates its corresponding number of visualization applications. Darker cells indicate higher quantities.
This is the author's version of an article that has been published in this journal. Changes were made to this version by the publisher prior to publication.
The final version of record is available at
http://dx.doi.org/10.1109/TVCG.2019.2907583
cycle phases from Section 4.1. The right part of the figure presents another histogram that follows the use cases from Section 4.2. The central part of the figure consists of a 2D histogram (heat map) that correlates these two frequencies in a single view. Each cell indicates its corresponding num-ber of visualization applications and is colored accordingly (darker cells indicate higher quantities).
The histogram on the top of Fig. 1 has maximum values
at “Construction Planning and Construction Detailing”. This
sub-phase alone covers 107 (43%) of all 248 visualization applications. The second most frequent sub-phase corre-sponds to “Construction, Manufacturing and Procurement”. These probably follow from the success of 4D animations since very early BIM research. Note a significant gap in the last construction sub-phase, probably due to limitations already identified by previous work [19].
Remaining visualization applications tend towards the
“Design”phase. The increasing frequency through each
sub-phase reflects the increasing usefulness of the 3D CAD model as design evolves. Curiously, the heat map shows significant interest in using BIM for“Sustainability Analysis”
still during design. Indeed, the heat map reveals that these applications are relatively spread throughout all life cycle phases and sub-phases. Regarding the “Operation” phase, we observed no research in the last “Decommissioning and
Major Re-Programming”sub-phase.
The use case histogram to the right of Fig. 1 indicates the highest frequencies at “Task Scheduling” and “Progress
Tracking” use cases. In contrast, the “Facility Management”
theme contains the lowest number of research overall. We have also observed a significant difference in the distri-butions between “Work Planning” and “Work Execution”
themes. In the former, almost all use cases show relatively high frequencies. In the latter, the “Progress Tracking” use case greatly overwhelms the others. This indicates that BIM visualizations for construction planning are relatively more mature and widespread. Meanwhile, visualizations for managing work execution remain largely unexplored.
5.2 Historical Development
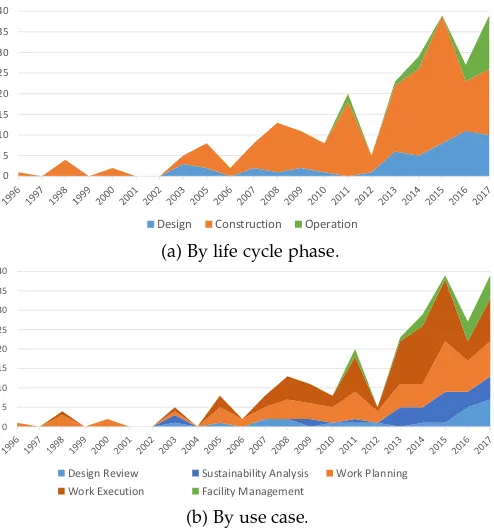
Fig. 2 displays stacked area charts with the frequency of visualization applications in the past years. Fig. 2a summa-rizes the works in life cycle phases from Section 4.1. Fig. 2b organizes the results by use cases from Section 4.2. We have chosen a color scheme that follows the natural correlation of use cases and life cycle phases, as discussed in Section 5.1.
Overall, the figures show a growing trend of visualiza-tion applicavisualiza-tions in BIM: from 1 article in 1996 to 39 articles in 2017. According to Fig. 2a,“Construction”has always been the major area. As expected, it closely follows research in
“Work Planning”and “Work Execution” in Fig. 2b. Another
natural correlation is found between “Operation” phase in Fig. 2a and“Facility Management”theme in Fig. 2b.
The charts indicate that, from 2012 onward, the“Design”
phase saw a great increase in published works. Looking at Fig. 2b, we find a strong correlation with the sudden growth in“Sustainability Analysis”during the same period. It is curious to note that this movement started around the same year as “Facility Management” research also gained momentum.
0 5 10 15 20 25 30 35 40
Design Construction Operation
(a) By life cycle phase.
0 5 10 15 20 25 30 35 40
Design Review Sustainability Analysis Work Planning Work Execution Facility Management
[image:7.612.313.560.44.308.2](b) By use case.
Fig. 2: Number of visualization applications in BIM over the years.
We hypothesize the increase in both these subject areas has been motivated mainly by the United Kingdom (UK). First, the UK is the second largest source of BIM research, only after the US. Second, sustainability was a key con-sideration in the London 2012 Olympic Games. Third, the UK government disclosed in 2013 an industrial strategy to promote the use of BIM for sustainable design [50].
Until 2012, “Construction” held an average of 85% of all research. Just 5 years later, research in “Construction”
decreased to 41%, with an increase to 33% for“Operation”
and 26% for “Design”. Indeed, 2017 saw a fairly balanced interest among each use case. We expect research to main-tain this trend, with visualization applications in BIM spread uniformly across all use cases and life cycle phases.
5.3 Research Opportunities
The preceding analysis suggests three main avenues for the visualization community to approach the BIM domain. The first possibility is to explore already established use cases, such as“Work Planning”and“Work Execution”themes. Re-searchers could validate and propose improvements to ex-isting visualizations through design studies and user evalu-ations [42], [51].Another option is to participate in the rising interest for“Sustainability Analysis”[10] and “Facility
Man-agement” [16]. We refer to our analysis in Sections 6.4, 6.5,
IEEE TRANSACTIONS ON VISUALIZATION AND COMPUTER GRAPHICS, VOL. X, NO. X, DECEMBER 2018 7
research could also work towards generalizing existing so-lutions for other use cases. For instance, “Work Planning”
and “Work Execution” techniques, typically applied to the
“Construction” phase, could be adapted for similar
analy-sis during“Operation”. Moreover, visual analytics tools for
“Sustainability Analysis” could be employed during
“Con-struction”phase.
6
C
RITICALA
NALYSIS OFV
ISUALIZATIONT
ECH-NIQUES
This section presents a detailed analysis of the visualization techniques employed in the main use cases from Fig. 1:
• Design Review: Clash Detection.
• Work Planning: Task Scheduling.
• Work Execution: Progress Tracking.
• Sustainability Analysis: Energy Analysis.
• Facility Management: Maintenance Management.
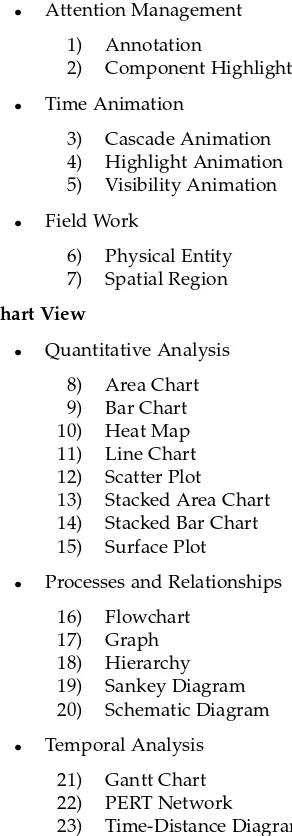
These use cases alone involve 70 of the 140 reviewed articles. From this subset, we identified 25 different visualizations, as follows:
2D/3D CAD View
• Attention Management
1) Annotation
2) Component Highlight
• Time Animation
3) Cascade Animation 4) Highlight Animation 5) Visibility Animation
• Field Work
6) Physical Entity 7) Spatial Region
Chart View
• Quantitative Analysis
8) Area Chart 9) Bar Chart 10) Heat Map 11) Line Chart 12) Scatter Plot
13) Stacked Area Chart 14) Stacked Bar Chart 15) Surface Plot
• Processes and Relationships
16) Flowchart 17) Graph 18) Hierarchy 19) Sankey Diagram 20) Schematic Diagram
• Temporal Analysis
21) Gantt Chart 22) PERT Network
23) Time-Distance Diagram
• Text-Based
24) List 25) Table
The majority of techniques (18) are based on the more traditional Chart view. Note the fairly large diversity of charts, plots, and diagrams. These help with analysis of numerical data, relationships among CAD components, and temporal information. Meanwhile, lists and tables present BIM information mainly using text.
[image:8.612.55.201.328.746.2]Only 7 visualization techniques are used within 2D/3D CAD views. The first two employ visual effects to call the user’s attention: Annotation and Component Highlight. Typically, the former overlays 2D geometries and text while the latter changes original geometries’ color and/or trans-parency Channels. Highlight, Visibility, and Cascade Ani-mations also change visual attributes of CAD objects but to convey time information. The remaining 2 visualizations en-rich the 3D CAD model with additional geometries: Physical Entities or Spatial Regions. These indicate the locations and affected areas of heavy machinery, temporary structures, and other field work in general.
Table 1 describes how these visualization techniques were applied to the main BIM use cases. The third column indicates associated information classes using the taxonomy from Section 4.3. Note that the same visualization is used to convey different information in varying scenarios. More-over, some articles are referenced multiple times, indicating a greater variety of visualizations within the same work.
In the next subsections, we analyze the pros and cons of these visualizations within each use case. We make use of Alluvial/Sankey diagrams to better understand and com-pare the techniques [123], [124]. Unlike other approaches, such as Parallel Coordinates, Alluvial diagrams enable us to make evident which Views, Marks, Channels, and Informa-tion are more frequently used.
6.1 Clash Detection
Designing facilities with 3D CAD models enables auto-mated checking of physical inconsistencies. For example, geometry overlaps can cause severe delays and rework during construction, also increasing overall project costs. BIM systems should help engineers locate these physical overlaps using some kind of visual feedback over the 3D CAD model. In addition, the experts need to identify which components are involved, their degree of inconsistency, and corresponding engineering specifications.
Fig. 3 describes how BIM applications visualize infor-mation related to “Clash Detection”. The second and third columns indicate major use of the 3D CAD model through Annotations, Component Highlights, and Spatial Regions. These are often supplemented by two common Chart views: Hierarchies and Tables. Both display context-sensitive in-formation such as CAD component IDs and engineering specifications mainly through text.
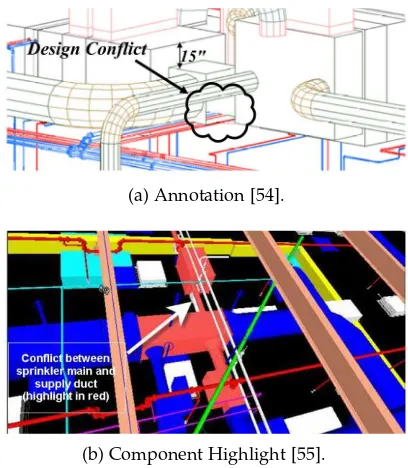
The Annotation visualization uses overlay 2D geome-tries whose color and shape together indicate the type of design inconsistency (Fig. 4a). These are often accompanied by texts with distance values, component IDs, and other technical information [125]. Glyphs of varying sizes are also This is the author's version of an article that has been published in this journal. Changes were made to this version by the publisher prior to publication.
The final version of record is available at http://dx.doi.org/10.1109/TVCG.2019.2907583
TABLE 1: Visualization techniques and related information organized by the main BIM use cases.
Visualization View Information Classes Reviewed Work
Clash Detection
Annotation 3D CAD Scope (spatial, technical), Quality(inconsistency) [54], [55], [56], [57], [58], [59] Hierarchy Chart Scope (item, technical), Quality (inconsistency) [57], [60]
Component Highlight 3D CAD Quality (inconsistency) [57], [61], [62]
Spatial Region 3D CAD Scope (spatial), Quality (inconsistency) [57]
Table Chart Scope (item), Quality (inconsistency) [60]
Task Scheduling
Gantt Chart Chart, 3D CAD Scope (item), Schedule (task) [57], [61], [63], [64], [65], [66], [67], [68], [69], [70], [71], [72]
Visibility Animation 3D CAD Schedule (task)
[54], [57], [59], [62], [63], [64], [65], [66], [68], [69], [70], [71], [73], [74], [75], [76], [77], [78], [79], [80], [81], [82], [83], [84], [85]
Table Chart Scope (item, technical), Schedule (task),
Resource (quantity) [63], [69], [72], [73], [82], [83], [86], [87] Annotation 2D/3D CAD Scope (item, technical), Schedule (task) [63], [64], [72], [76], [80], [88]
Hierarchy Chart Scope (item), Schedule (task) [63], [64], [66], [69], [87]
Highlight Animation 2D/3D CAD Schedule (task) [86], [88], [89], [90]
PERT Network Chart Schedule (task), Resource (quantity) [87]
Component Highlight 3D CAD Schedule (task) [72]
Time-Distance Diagram Chart Schedule (task) [74]
Cascade Animation 3D CAD Schedule (task) [72]
Progress Tracking
Table Chart Scope (quantity, item), Schedule (metric, task),Resource (ID, quantity) [49], [67], [75], [78], [86], [91], [92], [93], [94]
Gantt Chart Chart Schedule (task) [95], [96], [97], [98], [99], [100]
Highlight Animation 2D/3D CAD Scope (item), Schedule (task) [49], [70], [75], [83], [86], [93], [94], [96], [97], [98], [101], [102], [103], [104]
Visibility Animation 3D CAD Schedule (task) [67], [71], [76], [91], [92], [95], [99], [100],
[105], [106] Time-Distance Diagram Chart Schedule (task), Resource (ID, quantity) [67], [75], [105]
Bar Chart Chart Schedule (metric, task) [75], [91]
Graph Chart Scope (item), Schedule (task) [97]
Spatial Region 3D CAD Schedule (task) [94]
Annotation 3D CAD Scope (technical), Schedule (task) [76], [98], [104]
Physical Entity 2D CAD Facility (sensor) [91]
Hierarchy Chart Scope (item) [75]
Energy Analysis
Line Chart Chart Scope (item, technical), Sustainability (use),Facility (sensor) [88], [107], [108], [109], [110], [111], [112]
Table Chart Scope (item, quantity, technical), Sustainability(use, metric), Facility (sensor) [109], [113], [114]
Bar Chart Char Scope (item), Sustainability (use), Facility
(sensor, work log) [89], [108], [112], [114]
Component Highlight 2D CAD Scope (item), Sustainability (ambient, emission,
use) [111], [112]
Hierarchy Chart Scope (item), Facility (sensor), Sustainability
(metric) [110], [115]
Sankey Diagram Chart Scope (item), Sustainability (use), Facility
(sensor) [112]
Stacked Bar Chart Chart Scope (item), Sustainability (use) [111]
Heat Map Chart Sustainability (use) [111]
Scatter Plot Chart Quality (inconsistency) [111]
Spatial Region 3D CAD Sustainability (ambient) [89]
Maintenance Management
Annotation 2D/3D CAD Scope (item, technical), Facility (degradation,
problem, sensor) [116], [117]
Table Chart Scope (item, technical), Facility (problem,
sensor, work log) [110], [118], [119]
Component Highlight 2D/3D CAD Scope (item), Facility (degradation, problem,
sensor), Schedule (task), Quality (inconsistency) [110], [116], [118], [120], [121]
Schematic Diagram Chart Scope (item), Facility (sensor, problem) [116]
Spatial Region 3D CAD Schedule (task), Quality (inconsistency),
Facility (work log) [120], [122]
Hierarchy Chart Scope (item) [118]
IEEE TRANSACTIONS ON VISUALIZATION AND COMPUTER GRAPHICS, VOL. X, NO. X, DECEMBER 2018 9
Clash Detection
3D CAD
Chart
Annotation
Hierarchy
Component Highlight
Table
Spatial Region
2D Geometry
Text
Original Geometry
Glyph
Icon
Line
Color
Value
Shape
Size
Position
Transparency
Outline Stipple
Inconsistency Type
Distance Between Components
Technical Annotation
Component ID
Inconsistency Amount
Related Components
[image:10.612.75.534.51.272.2]Technical Standard
Fig. 3: Correlations among Views, Visualizations, Marks, Channels, and Information in “Clash Detection”. Flow widths indicate frequency of use and colors distinguish visualization techniques.
(a) Annotation [54].
(b) Component Highlight [55].
Fig. 4: Examples of visualizations in“Clash Detection”.
used to indicate distances between CAD components [126], [127]. The main limitation we observed in our survey is that Annotations had to be manually inserted by the user.
Works that use Component Highlights change the color, outline stipple, and/or transparency of original geome-tries to indicate inconsistency type. Although colors can accurately indicate this categorical data, they may not ad-equately emphasize a 3D CAD geometry against other colored components (see Fig. 4b). Likewise, transparency seems inappropriate for these purposes. The faded geom-etry blends with background objects and makes it harder for the user to distinguish shapes and sizes [128], [129].
Finally, we found several examples of clashes that
in-volved 3D CAD geometries surrounded by many others. However, there were no mechanisms implemented to re-duce visual clutter and/or overcome occlusion. This forces engineers to spend too much time navigating around the scene to accurately identify and analyze inconsistencies.
6.2 Task Scheduling
As demonstrated in Section 5.2, virtual construction plan-ning has always been the major use case of BIM. It consists of 4D animations (3D + time) that indicate the sequence of activities in the job site. Combining temporal with spa-tial information allows engineers to avoid many schedul-ing problems, such as inconsistent assembly orderschedul-ing and workspace conflicts. It also improves understanding of work plans among designers, planners, and field personnel.
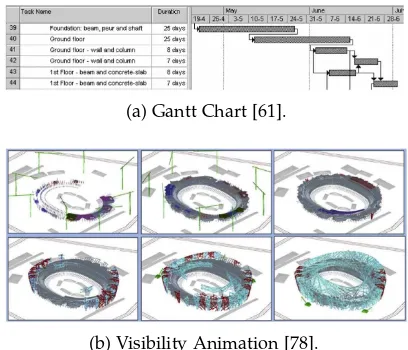
Figure 5 indicates a large variety of visualizations used for“Task Scheduling”. Slightly more information is displayed in Chart views than 3D CAD views, with only a few ex-ceptions using a 2D CAD view. Main techniques include: Gantt Chart, Visibility Animation, Table, and Annotation. As shown in (Fig. 6a), Gantt charts plot time using a spatial dimension in an intuitive graph-like view [130].
Regarding the 3D CAD view, the most popular 4D visualization is the Visibility Animation (Fig. 6b). In this scheme, facility components not yet built remain invisi-ble. As simulation time progresses, geometries suddenly turn visible to indicate their construction has commenced. However, these discrete snapshots make it impossible to overview the entire schedule: parts of the 3D model that correspond to future tasks remain hidden. Moreover, no Mark/Channel is used to display activity duration: it must be inferred from the length of time that 3D objects are colored as “in-progress”. Similarly, predecessor/successor relationships must be deduced by the sequence of appearing geometries. For these reasons, previous research have long criticized this spatio-temporal visualization [33], [34], [86]. This is the author's version of an article that has been published in this journal. Changes were made to this version by the publisher prior to publication.
The final version of record is available at http://dx.doi.org/10.1109/TVCG.2019.2907583
[image:10.612.71.275.322.556.2]Task Scheduling
Chart
3D CAD
2D CAD
Gantt Chart
Visibility Animation
Table
Annotation
Hierarchy
Highlight Animation
PERT Network Time-Distance Diagram Component Highlight Cascade Animation
Text
Line
Original Geometry
2D Geometry
Icon
Glyph
3D Geometry
Value
Position
Color
Visibility
Size
Ordering
Transparency Shape Outline Color Outline Weight Outline Stipple
Task Execution Status
Task Start and Finish
Task ID
Task Duration
Task Predecessors/Successors
Task Sequencing
[image:11.612.78.538.45.262.2]Component ID Task Type Task in Critical Path Related Components Component Type Task Free and Total Float Current Schedule Date Required Amount of Resources Component Technical Specification Technical Annotation Nature of Relationship Task Delay Amount
Fig. 5: Correlations among Views, Visualizations, Marks, Channels, and Information in“Task Scheduling”. Flow widths indicate frequency of use and colors distinguish visualization techniques.
(a) Gantt Chart [61].
(b) Visibility Animation [78].
Fig. 6: Examples of visualizations in“Task Scheduling”.
An alternative 4D animation is the Highlight Animation. It changes several color-related Channels associated with original 3D geometries to display task execution status. However, quantitative information such as task durations are indicated by Tables or must be deduced from when the 3D geometries change in appearance. This results in many of the same limitations found in the Visibility Animation described above.
A more recent method of displaying spatio-temporal in-formation is the Cascade Animation [72]. It uses the vertical direction to plot time as a spatial dimension within the 3D CAD model, similar to a space-time cube [131]. In this approach, continuous animations highlight task sequencing while preserving relative positioning of nearby tasks [132]. The technique overcomes previous limitations by combining several Marks/Channels to display schedule-related data directly within the 3D scene.
6.3 Progress Tracking
Project managers need to closely follow construction exe-cution to make sure activities remain in accord with the original schedule. Main challenges include tracking many ongoing activities and calling attention to problems and delays. Traditionally, project management uses the same methods and tools for planning and controlling work ex-ecution. Many schedule analysis systems already have the ability to track task delays by enriching their visualizations. It was expected that Fig. 7 would show similar visu-alization techniques as the previous use case. Although Chart and 3D CAD views are still predominant, we observe many differences in the ranking of visualizations in the third column. Tables are now the most prominent mechanism of conveying information, closely followed by Gantt Charts, Highlight, and then Visibility Animations.
Tables continue to convey mostly textual information related to task execution (Fig. 8a). Meanwhile, Gantt Charts are seldom employed in the current use case. One reason could be a lack of adequate progress tracking tools within BIM visualization systems [36].
In the 3D CAD view, most information is visualized using Highlight Animations (Fig. 8b). These are more fre-quent when compared to“Task Scheduling”. This is probably because task delays can be easily highlighted using colors. Unfortunately, this creates a very ambiguous visualization. The color Channel of original 3D geometries now conveys both categorical (task type and execution status) and quan-titative (task progress and delay amount) information.
6.4 Energy Analysis
[image:11.612.71.275.317.492.2]IEEE TRANSACTIONS ON VISUALIZATION AND COMPUTER GRAPHICS, VOL. X, NO. X, DECEMBER 2018 11
Progress Tracking
Chart
3D CAD
2D CAD
Table
Gantt Chart
Highlight Animation
Visibility Animation
Time-Distance Diagram
Bar Chart Graph Annotation Spatial Region Physical Entity Hierarchy
Text
Original Geometry
Line
2D Geometry
3D Geometry
Icon
Value
Color
Size
Position
Ordering
Visibility Outline Color Shape Outline Weight Transparency Orientation Texture Outline Stipple
Task Execution Status
Task Progress
Task ID
Task Delay Amount
Task Duration Task Start and Finish Task Sequencing Task Predecessors/Successors Component ID Task Type Resource Type
[image:12.612.72.276.317.583.2]Required Amount of Resources Related Components Productivity Level Component Type Allocated Resources Component Count Sensor Type Resource ID Technical Annotation Total Resource Capacity Available Resources
Fig. 7: Correlations among Views, Visualizations, Marks, Channels, and Information in“Progress Tracking”. Flow widths indicate frequency of use and colors distinguish visualization techniques.
(a) Table [67].
(b) Highlight Animation [98].
Fig. 8: Examples of visualizations in“Progress Tracking”.
forcing construction companies to improve their practice. Certificates systems such as the Leadership in Energy and Environmental Design (LEED) were created to promote and award efficient buildings [9]. As an added benefit, energy-efficient designs also contribute with cost savings during operation phase.
Fig. 9 shows that the overwhelming majority of“Energy
Analysis”information is displayed using a Chart view. The
second most frequent view is 2D CAD, followed by 3D CAD in last place. This is very different from previously
analyzed use cases, where 3D CAD and Chart views shared the highest ranks. As described below, we hypothesize this is due to the specific nature of energy-related information.
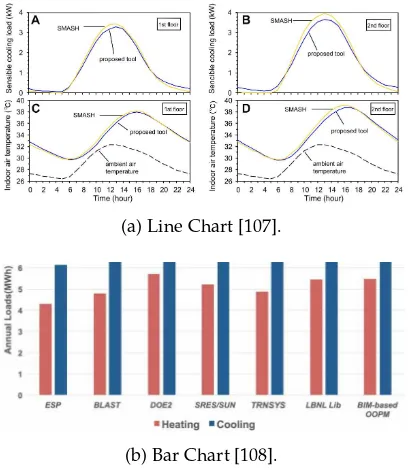
The main technique, Line Chart, shows simulated or actual energy use over time (Fig 10a). Displaying continuous data as a time series is a well-known and intuitive visual-ization technique [133]. The predominance of quantitative information also leads to the frequent use of Bar Charts (Fig. 10b) to display and compare numeric values [134]. Many other kinds of charts are used for these same pur-poses: Sankey Diagrams, Stacked Bar Charts, Heat Maps, and Scatter Plots.
Looking at the right of Fig. 9, we see a great diversity of categorical and quantitative information. Note how the Ta-ble visualization relates to almost all of them: it is very easy to simply present everything in tabular form. Unfortunately, this makes it harder to understand important data patterns when compared to graphical displays.
The “Energy Analysis” use case brings a rather unique
set of visualization challenges. The main information is quantitative in nature and understanding their change over time is one of the main user tasks. This is probably the principal reason why Chart views are so popular: many established techniques already meet these demands. Linked 2D CAD views are then only employed to provide associ-ated geometry highlights. Nevertheless, displaying energy performance within a 3D CAD view could make evident hidden patterns and relationships among nearby areas.
6.5 Maintenance Management
One of the main activities during“Operation”is maintaining a facility’s physical integrity. Structures suffer continuous degradation from exposure to elements. Hydraulic, mechan-ical, and electronic systems lose efficiency and can malfunc-tion over time. Facility managers employ several different This is the author's version of an article that has been published in this journal. Changes were made to this version by the publisher prior to publication.
The final version of record is available at http://dx.doi.org/10.1109/TVCG.2019.2907583
Energy Analysis
Chart
2D CAD
3D CAD
Line Chart
Table
Bar Chart
Component Highlight
Hierarchy
Stacked Bar Chart
Sankey Diagram
Scatter Plot Spatial Region Heat Map
Line
Text
Original Geometry
2D Geometry
Icon
Size
Color
Value
Position
Shape
Energy Use
Component ID
Sensor Historical Reading Component Type Sensor ID Sensor Type
Component Technical Specification Related Components Ambient Temperature Ambient Humidity Sustainability Level Air Emission Ambient Lighting Sensor Current Reading Inconsistency Amount Sensor Warning Status Component Length Component Width Ambient Wind Speed Event Timestamp Technical Standard Component Weight Automation Dependencies Component Area
Fig. 9: Correlations among Views, Visualizations, Marks, Channels, and Information in“Energy Analysis”. Flow widths indicate frequency of use and colors distinguish visualization techniques.
(a) Line Chart [107].
[image:13.612.77.542.52.270.2](b) Bar Chart [108].
Fig. 10: Examples of visualizations in“Energy Analysis”.
maintenance strategies [135]. Each has varying task and data requirements, as well as different implementation costs.
Fig. 11 describes how BIM is used for facility mainte-nance. Information are visualized mainly with 3D CAD and Chart views, with a few exceptions using 2D CAD. This distribution is very similar to previous use cases, except for
“Energy Analysis”.
Within the 3D CAD view, Annotation is the main vi-sualization. It conveys three major types of information: maintenance problems, sensor readings, and component specifications. Once again, applications tend to display too much textual data, overwhelming the user’s perception.
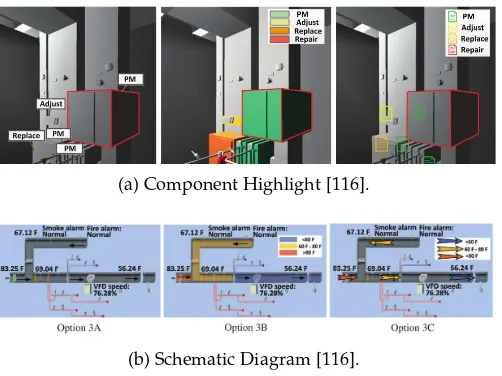
As with previous use cases, Tables are the main Chart visualization. They often provide context-sensitive informa-tion from Component Highlights in 2D/3D CAD views (Fig. 12a). Meanwhile, Schematic Diagrams are specific
to “Maintenance Management”(Fig. 12b). This visualization
combines several Marks and Channels to make evident the logical relationships among facility components.
Overall, we have found that many visualization tech-niques in “Maintenance Management” are quite similar to
“Clash Detection”. Both use Annotations and Component
Highlights over the 3D CAD model to call attention to problems and inconsistencies. The current use case is also similar to “Energy Analysis”: both investigate quantitative measurements from sensors. However, BIM applications for maintenance simply show these information as text within Tables or Annotations. For further details, we refer to our previous analysis of these techniques in Sections 6.1 and 6.4.
6.6 Research Opportunities
According to the preceding analysis, the visualization com-munity could help to improve several limitations in current BIM practice. One of the main problems is the abundance of textual displays that hinder analysis of complex datasets. Replacing these with Charts combined with 2D/3D CAD views could bring forth yet unexplored data patterns and relationships [48], [136], [137], [138].
[image:13.612.72.276.325.560.2]IEEE TRANSACTIONS ON VISUALIZATION AND COMPUTER GRAPHICS, VOL. X, NO. X, DECEMBER 2018 13
Maintenance Management
3D CAD
Chart
2D CAD
Annotation
Table
Component Highlight
Schematic Diagram Spatial Region Hierarchy Physical Entity
Text
Original Geometry
Glyph Icon Line 3D Geometry
Value
Color
Shape Position Shading Transparency Orientation Outline Color
Problem Type Sensor Current Reading Component ID
Component Technical Specification Component Type
Component Set Point Sensor ID Inconsistency Type Component Physical Integrity Sensor Type
Related Components Component Lifetime Component Efficiency Loss FM Staff
Nature of Relationship Workspace Type Workspace Shape FM Action Result Component Control Command Task Cost
[image:14.612.74.538.52.261.2]Task Type FM Action Taken Event Timestamp Automation Dependencies Problem Description Technical Standard FM Travel Route Task Execution Status
Fig. 11: Correlations among Views, Visualizations, Marks, Channels, and Information in“Maintenance Management”. Flow widths indicate frequency of use and colors distinguish visualization techniques.
(a) Component Highlight [116].
(b) Schematic Diagram [116].
Fig. 12: Examples of visualizations in“Maintenance Manage-ment”.
Regarding the 3D CAD view, existing applications could improve on their use of colors in Highlight An-imations and Component Highlights. Typical approaches mix qualitative and quantitative information using the same Marks/Channels. Visualization best practices can help choosing adequate color schemes for different analysis in the BIM domain [148], [149], [150].
Many of the surveyed 4D animations employ discrete visibility changes that fail to convey important temporal information. Instead, researchers could use animations to call attention to objects of interest [151] and also to preserve context during smooth transitions between views [152], [153], [154]. We also did not observe any mechanism to im-prove user perception in complex 3D CAD models. Several techniques are already available to manage occlusion [155], [156], reduce clutter [157], [158], [159], and highlight features of interest [160].
7
V
ISUALIZATIONC
HALLENGES INBIM
This section describes the unique features of BIM that bring forth interesting challenges for the visualization community. BIM datasets contain large amounts of varied information, produced and consumed by diverse experts throughout the entire facility’s life cycle. Many techniques from the areas of visual analytics and data visualization could help ana-lyzing these complex datasets. In addition, the importance of the 3D CAD model open up interesting opportunities for integrating spatial and non-spatial visualization. This correlation between digital and physical worlds also enables the use of immersive techniques. Table 2 identifies which visualization fields could best explore these opportunities.
Scientific and information visualization. In BIM, the 3D CAD model acts as the main connector between all relevant data throughout the facility’s life cycle. Our review has shown that some data are more suitable to scientific visualization and others to information visualization. There-fore, BIM provides a unique opportunity to investigate the possible synergies between these two fields [161], [162]. Per-haps traditional information visualization techniques could be somehow embedded in the 3D CAD model, like Gantt charts in the Cascade Animation [72]. Other research have explored a similar strategy to provide spatial context to building performance data [163], [164]. An interesting chal-lenge would be to adapt traditional interaction techniques to the 3D environment [165], [166]. Another possibility is to use transparency to highlight 3D objects with relevant meta-data, similar to transfer functions in volume rendering [167].
Multidimensional visualization. Visual data analytics is a yet unexplored field in BIM that could help extract valuable knowledge from complex datasets [136], [168], [169], [170]. Section 4.3 identified 31 “classes” of informa-tion with an average of 5 attributes each. This amounts to more than 150 structured/non-structured and categor-ical/quantitative data. Many BIM activities could benefit from multidimensional visualization, such as: problem root This is the author's version of an article that has been published in this journal. Changes were made to this version by the publisher prior to publication.
The final version of record is available at http://dx.doi.org/10.1109/TVCG.2019.2907583
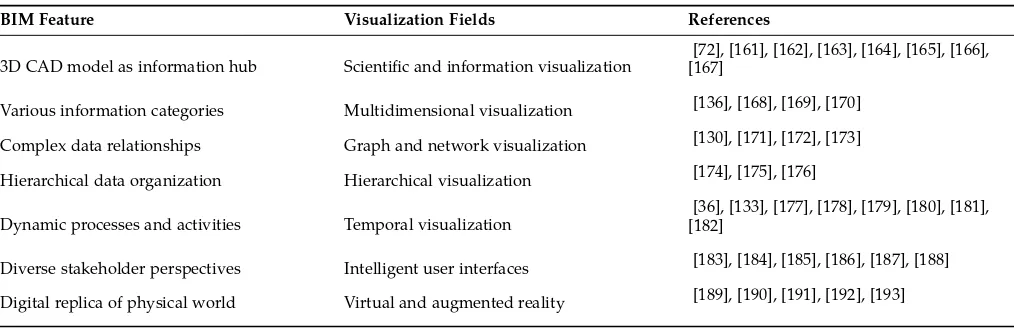
[image:14.612.51.302.312.500.2]TABLE 2: Challenging features of BIM and corresponding visualization fields that could explore them.
BIM Feature Visualization Fields References
3D CAD model as information hub Scientific and information visualization
[72], [161], [162], [163], [164], [165], [166], [167]
Various information categories Multidimensional visualization [136], [168], [169], [170]
Complex data relationships Graph and network visualization [130], [171], [172], [173]
Hierarchical data organization Hierarchical visualization [174], [175], [176]
Dynamic processes and activities Temporal visualization
[36], [133], [177], [178], [179], [180], [181], [182]
Diverse stakeholder perspectives Intelligent user interfaces [183], [184], [185], [186], [187], [188]
Digital replica of physical world Virtual and augmented reality [189], [190], [191], [192], [193]
cause finding, process optimization, resource allocation, and cost reduction.
Graph and network visualization. BIM information is highly interdependent in nature. Facility components share many design relationships, such as dimensional and struc-tural constraints. Moreover, the control logic of building automation systems interconnects sensors and mechanical equipment. Many other kinds of BIM data have cause and effect relationships. For instance, task durations depend on the size of work crews, both of which contribute to project costs. We believe graph and network visualizations could make evident these interdependencies to better inform de-cision makers [130], [171], [172], [173].
Hierarchical visualization.The product hierarchy is one of the main artifacts generated in the“Design”phase. This classification helps engineers navigate and filter building components according to engineering disciplines, systems, and types. Different kinds of BIM analysis operate at differ-ent levels within this hierarchy. Some queries may inspect individual building components, while others may consol-idate and compare information across different systems. Presenting relevant BIM information in these drill down and zoom out operations should be interesting challenges for hierarchical visualization research [174], [175], [176].
Temporal visualization. BIM requires coordinating the activities of various teams that use different systems across all life cycle phases. Tools such as Information Delivery Manuals (IDM) have been devised to control the flow of data in these processes [177]. Temporal visualizations could bring new insights into the evolution of BIM datasets and help managing changes in project scope, durations, and costs [178], [179]. There is also opportunity to investigate new approaches related to task scheduling [36], [180] and time series analysis [133], [181], [182].
Intelligent user interfaces. Construction projects in-volve several engineering disciplines: structural, mechani-cal, electrimechani-cal, etc. Many stakeholders participate in these enterprises: project managers, construction planners, facility managers, etc. Each of these actors performs different anal-ysis using different information from the same BIM dataset. Visual analytics tools could intelligently adapt to different task requirements and goals [183], [184], [185]. For example, focus+context techniques could highlight features of interest
according to the needs of each user profile [186], [187], [188].
Virtual and Augmented reality. In its essence, BIM uses the 3D CAD model as a high-fidelity digital replica of the physical world. There are many opportunities for visualization research to explore the inherent connection between these virtual and real environments. Virtual reality allows building designers to find problems and collaborate on improvements [189]. Augmented reality applications range from tracking construction progress to assisting in maintenance works [190], [191]. Emerging research areas such as immersive analytics can also help BIM professionals explore and understand complex datasets [192], [193]. We suggest conducting a more specific literature review about this visualization field in BIM to provide detailed guidance.
8
C
ONCLUSIONSThis work described the findings of a systematic literature review of visualization in BIM. We analyzed previous work using a taxonomy of Life Cycle Phases, Use Cases, Informa-tion, and Visualizations. This scheme enabled identifying the main application areas of visualization in BIM and the critical analysis of currently employed techniques. Based on these findings, Sections 5.3, 6.6, and 7 highlighted many unexplored opportunities for future visualization research.
We suggest four different strategies for the visualization community to approach BIM. First, governments committed to BIM adoption regularly make available research grants in this theme [194]. Second, construction companies could create research partnerships to develop innovative solutions and gain competitive advantage. Third, major hardware and software vendors on the cutting edge of BIM technology of-ten work together with academia [195]. Finally, several open BIM datasets in the IFC format [196] are readily available for download [197], [198], [199], [200], [201], [202].