PREDICTION OF STUDENT ACHIEVEMENT AT
A.N.U. FROM A.C.T. COLLEGE ASSESSMENTS
by
WARREN JOHN MULLER
A case study submitted to the Australian National
University as part of the requirement for the
degree of Master of Science.
i
-CONTENTS
CONTENTS
i
ACKNOWLEDGMENTS
iii
SUMMARY
iv
CHAPTER
1 :
INTRODUCTION
1
CHAPTER
2 :
THE NATURE OF THE DATA
6
2.1
College Data
6
2.2 Students Entering A.N.U.
72.3 A.N.U. Data
8
Tables 2.1 - 2.8
.
13
CHAPTER
3 :
RELATIONSHIPS BETWEEN COLLEGE VARIABLES 21
3.1
Correlations
21
3.2 Principal Components Analyses
21
3.3 Principal's Recommendations 23
3.4 Use of Principal Components Analyses in
24
Regressions
Tables 3.1 - 3.5 27
CHAPTER 4 : PREDICTION OF MARKS IN A.N.U. UNITS 32 4.1 Correlations with College Variables 32 4.2 Correlations with Principal Component
3^-Scores
4.3 Comparison of Regressions 35
4.4 Percent Variation Explained by College 36
Variables
4.5 Effect of SEX 38
4.6
Percent Variation Explained
by Principal
39
Component Scores
CHAPTER 5 : GRADE SCORES AND T H E I R P R E D I C T I O N 5 . 1 G r a d e S c o r e s
5 . 2 C o r r e l a t i o n s w i t h C o l l e g e V a r i a b l e s 5 . 3 P e r c e n t V a r i a t i o n E x p l a i n e d b y C o l l e g e
V a r i a b l e s
5 . 4 C o r r e l a t i o n s f o r M a r g i n a l S t u d e n t s T a b l e s 5 . 1 - 5 . 1 3
CHAPTER 6 ; COMPARISONS BETWEEN A . C . T . COLLEGES 6 . 1 G r a d e S c o r e s a n d P a s s R a t e s
6 . 2 R e g r e s s i o n A n a l y s e s
6 . 3 R e p r e s e n t a t i o n o f R e l a t i v e A c h i e v e m e n t T a b l e s 6 . 1 - 6 . 6
F i g u r e s 6 . 1 - 6 . 6
CHAPTER 7 : D I S C U S S I O N AND RECOMMENDATIONS 7 . 1 D i s c u s s i o n
7 . 2 I m p l i c a t i o n s f o r A . N . U . A d m i s s i o n P r o c e d u r e s
7 . 3 P o s s i b l e F u r t h e r S t u d i e s REFERENCES
APPENDIX 1 : TES PERCENTILE FREQUENCIES FOR
A . C . T . COLLEGES
APPENDIX 2 : FREQUENCIES OF GRADES I N IN D IV ID U A L U N IT S
APPENDIX 3 : FORTRAN PROGRAMS
APPENDIX 4 : GENSTAT PROGRAMS
54
3 4 3 8 6 062 6 4 8 2 8 2 8 4 86 9 0 9 9 1 0 6 I 0 6 1 1 0
I I 2 1 1 3 119
1 2 2
iii
A C K N O WL E D G M E N TS
I w i s h to t h a n k m y two s u p e r v i s o r s , Dr D.M. Paton, B o t a n y
D e p a r t m e n t , a n d D r D.F. N i c h o l l s , S t a t i s t i c s D e p a r t m e n t ,
for the e n c o u r a g e m e n t a n d a d v i c e t h e y g a v e me at all
stages of the study. M u c h a d v i c e a n d i n f o r m a t i o n was
s u p p l i e d b y the A . N . U . A d m i s s i o n s O f f i c e r , M r C l i v e
J o h n s o n , a n d b y M s H.R. H a m i l t o n o f the A d m i s s i o n s O f f i c e .
M r P.B. T e l f o r d , the A.N . U . S t a t i s t i c a l O f f i c e r , m a d e
a v a i l a b l e r e c o r d s o f A . N . U . r e s u l t s a n d i n f o r m a t i o n on
f i r s t y e a r c o u r s e s at A . N . U . , a n d p a r t i c i p a t e d i n u s e f u l
d i s c u s s i o n s o n this a s p e c t o f the work. M i s s A l y s o n
S t i b b a r d o f the S t a t i s t i c a l O f f i c e d i d all the d a t a
p r e p a r a t i o n a n d m u c h o f the c h e c k i n g n e c e s s a r y to e n s u r e
the a c c u r a c y o f the r e s u l t s . F i n a l l y , the A . C . T . S c h o o l s
A c c r e d i t i n g A g e n c y s u p p l i e d l i s t i n g s o f r e s u l t s o f A . C . T .
Y e a r 12 s t u d e n t s , w i t h o u t w h i c h the s t u d y w o u l d n o t h a v e
SUMMARY
R elationships between measures of“ student
performance in A.C.T. colleges and results achieved in
first year at A.N.U. are investigated. The college
variables are those produced by the A.C.T. Schools
Accrediting Agency and made available to A.N.U. for
admission purposes, n a m e l y Tertiary Entrance Score ( T E S ) ,
Australian Scholastic Aptitude Test (ASAT) and
Principal's Recommendations. There are three A S A T
variables, Verbal, Quantitative and Total, and three
Principal's Recommendations, Academic, Personal and
Overall. Sex and college attended are also considered as
possible variables to predict A.N.U. results.
Analyses were performed on three years of data;
students entering A.N.U. from A.C.T. colleges in 1978,
1979 and 1980. There were 241, 258 and 272 such students,
respectively, in these years. Results of all of these
students in all first year units att e m p t e d were available,
as well as actual marks obtained in the m a j o r i t y of cases.
Correlations and regressions of marks in individual
A.N.U. units against college variables showed that, for all
faculties except Law, TES was the best predictor of m ark
obtained. Add i t i o n of other college variables significantly
improved the regressions for some units, h o w e v e r not
consistently over the three years. Sex was significant in
a few instances. In the Faculty of Law, A S A T was generally
V
-Grade scores were defined to summarise results
obtained by students in large groups of units, based
either on faculty or subject area. As for marks, TES was
the best p r e d ictor of grade score, and addition of other
variables s i g n i ficantly improved the r e lationship in very
few cases. Sex was still significant for a few grade
scores and A S A T was still a b etter predictor than TES in
the Facu l t y of Law.
The larger nu m b e r of student results summarised
by grade score meant that the effect of A.C.T. college
attended could be tested. There were substantial
differences be t w e e n colleges in 1978 and 1979, when
addition of college as a variable signif i c a n t l y improved
regressions w i t h grade score. Ho w e v e r no such differences
were obtained in 1980, and the i n c o n s i s t e n c y of results
over the three years means no general inferences can be
made on relative performances in rela t i o n to college
attended.
Imp l i c a t i o n s of the results for A.N.U. admission
procedures and possible further studies in this general
CHAPTER
1
INTRODUCTION
Before 1977» students in Year 12 in A.C.T. high
schools and colleges sat for the N.S.W. Higher School
Certificate examination.
The score obtained from this
examination was then used as the sole criterion for entry
into the Australian National University (hereafter 'A.N.U.*)
or any other Australian university.
However a few years
earlier, changes had been recommended to this system of
public examinations at the terminal secondary school stage
in the A.C.T. Full details of the proposed new system are
contained in Campbell (1972) and Thomson (197^)» and a
synopsis of the system as it presently operates is given
in the A.C.T. Schools Accrediting Agency booklet (1980).
The fundamental change to assessment in this new
system was that continuous internal assessment would replace
external examinations.
This introduced the need for
standardising and scaling marks obtained in each course to
adjust for differences between assessments from different
schools and colleges.
The procedures adopted to do this are
detailed by the A.C.T. Schools Accrediting Agency booklet
2
best m i nor subject scaled score, or 0.6 of the next best
m a j o r subject scaled score, w h i c h e v e r is the greater. Few
individual subject scaled scores are grea t e r than 100,
hence only a small nu m b e r of o u t s t a n d i n g students obtain
a TES greater than
360
.To achieve the scaling on w h i c h the TES depends,
the Austr a l i a n Scholastic Aptitude Test (hereafter ' ASAT')
is used. The v a l i d i t y of A S A T as a m o d e r a t o r variable has
been discussed exten s i v e l y (Lees, 1979). For example, the
papers from the A u s t r a l i a n Council for Educational Research
1978 conference (Research Papers ...., 1978) deal w ith m a n y
general aspects and C o o n e y (1975) gives a good account of
theoretical considerations in standardisation. With
particular reference to the effectiveness of A S A T in the
A.C.T. system, studies have been made b y Keeves (1977» 1980)
and M o r g a n (1978, 1981a, 1981b) w h i c h show that A S A T results
are s u fficiently well r e l a t e d to college assessment measures.
It is not the purpose of the present study to q u estion the
v a l i d i t y of A S A T as a moderator, so these earlier studies
will not be discussed further.
I n c o n s idering students from A.C.T. Colleges who
apply for a d m ission to A.N.U., the A.N.U. Admissions
Committee thus has available the TES and the A S A T result,
which is in three parts :
V ERBAL - a score ass e s s i n g "verbal reasoning"
QUAN T I T A T I V E - a score a s s e s s i n g "quantitative thinking"
TOTAL - an overall score of "scholastic aptitude".
The verbal and qua n t i t a t i v e scores are made up from relevant
items in the A S A T tests, and all three scores are scaled to
deviation of 1 5- i n addition each student receives a
P r i n c i p a l ’s Recommendation, which is a set of three scores
from 1 to 6 :
ACADEMIC - the r e c o m m endation on academic grounds
PERSONAL - the r e c o m m endation on p ersonal grounds
OVERALL - the overall r e c o m m endation
and within each of these recommendations the actual scores
denote the subjective attitudes :
1 s not r e c o mmended 4 : fairly strong support
2 : without enthusiasm 5 : v e r y strong support
3 : m i l d support 6 : e n t h u s i a s t i c .
W hen cons i d e r i n g student admission, the Admissions
Committee first decides on an 'upper* TES level, above
which all students are au t o m a t i c a l l y admitted, and a ’lower'
TES level, b e l o w w h i c h all students are rejected. For
students in the b a n d b e t w e e n these upp e r and lower levels,
c onsideration is given add i t i o n a l l y to the Principal's
R ecommendations and, to a m i nor extent, the A S A T scores.
Thus it is in this m a rginal area, w h i c h in the years u n d e r
study corresponded a p p r o x i m a t e l y to students w i t h TES
between 260 and 240, where the predictive abilities of the
Principal's Reco m m e n d a t i o n s and A S A T are of parti c u l a r interest.
M a n y previous studies have examined h o w well
student assessment variables at the end of secondary
education predict student achievement at the tertiary level.
A n u m b e r of these are d e s c ribed b r i e f l y by Lees (1979). Hie
more general issues of the v a l i d i t y of various methods of
usi n g s e c ondary assessments for tertiary entrance are
discussed b y M c G a w (1977a, 1977b) and Cooney (1974), the
4
Specific relationships between secondary and tertiary
achievement are given for Queensland engineering students
b y O 'Connor (1974), for some overall tertiary grade point
averages in Queensland by M c G a w (1977b)» for Victorian
first y ear u n i v e r s i t y success by Smurthwaite (1973)» and
for Arts and Science students at the U n i v e r s i t y of Adelaide
b y Otto (1 9 7 6 ). I n all of these studies correlations
be t w e e n secondary assessment variables and u n i v e r s i t y
results were greater than those b e t ween A S A T and u n i v e r s i t y
r e s u l t s .
Two studies involving performance at A.N.U. yield
similar results. Sutherland (1973) examined first year
performance at A.N.U. in 1969 anc* at the U n i v e r s i t y of W.A.
in 1969 and 1971 in relation to TEEP and A S A T scores. Both
TEEP and A S A T were i nferior predictors to Higher School
Certificate results in most instances. The Tert i a r y
Education Entrance Project (1975) examined TEEP scores as a
p r e dictor of first y ear law results at A.N.U. in 1971-1973»
and concluded that n e i t h e r TEEP no r the Higher School
Certificate examination was a good predictor of success in
the A.N.U. F a c u l t y of Law.
In the present study we examine the achievement in
their first year at A.N.U. of all students who came from
A.C.T. colleges in the first three years of operation of the
n e w system. O n l y immediate school leavers are included, hence
our three years of data, each w i t h app r o x i m a t e l y 250 students,
are for 1977 Year 12 at college, 1978 first y ear A.N.U.;
1978 Y ear 12 college, 1979 first y ear A.N.U.; 1979 Year 12
college, 1980 first y ear A.N.U. The only variables that are
Admissions Committee, na m e l y T E S , A S A T and Principal's
Recommendations, together with sex of the student and
college at which the student studied. Relationships are
obtained firstly b e t ween these variables, as predictors,
and actual marks obtained in A.N.U. units or groups of units.
Secondly, measures of A.N.U. achievement based on grades
obtained in A.N.U. units are defined, and relationships
between these and the predictive variables are obtained.
Within this study, no attempt has been made to
compare the first y ear A.N.U. results of the A.C.T. college
students with those of other first y ear A.N.U. students.
This could yield i n t e r e s t i n g results, but was r e garded as
outside the scope of the present study. Secondly, no
attempt has been made to relate scaled scores of
individual college subjects to A.N.U. performance. The
derivation of such relationships could provide a useful
supplement to the present work, but the m a g nitude of the
6
CHAPTER 2
THE NATURE OF THE DATA
2,1
College Data
Each year, the A.C.T. Schools Authority supplies
A,N.U. with the detailed results obtained by all students
who attempt a tertiary entrance package and hence obtain a
TES,
Attached to these records is a table giving frequencies
of each TES and its rank by Year 12 candidature and by 18 year
old age cohort.
For Year 12 1977 and Year 12 1978 the following
information was extracted from the detailed file for each
college student with a TES :
TES
ASAT Verbal
ASAT Quantitative
ASAT Total
Principals Recommendation - Academic
Principal’s Recommendation - Personal
Principal's Recommendation - Overall
College attended.
From the ranks in the frequency tables the TES percentile
of each student was also known.
'Percentile', throughout
this study, means the percent of students obtaining the
1977 Year 12 - 1701 students
1978 Year 12 - 1759 students
U s i n g the above data certain p reliminary information
could be obtained. In particular the n u mber of students from
each college in each 5% percentile band of TES was readily
obtainable. Students from each college g e n erally were spread
fairly evenly over the whole TES range in each of the two
years. If this had not been the case, problems m a y have
arisen in m a k i n g comparisons b e t ween colleges of A.N.U.
results achieved. The full frequency counts for TES
percentiles are p r e s ented in Appe n d i x 1.
Full infor m a t i o n was not extracted for Year 12 1979
students as had b een for the first two years, primarily
because the enormity of the task would not have justified
the extra i n f o rmation thus available. Reasons for this
become apparent in Chapter 3» There were :
1979 Year 12 - 2003 students
and whilst the numbers in each TES percentile were known from
the frequency table supplied b y the Authority, no break-up
by college was possible.
2.2 Students E n t e r i n g A.N.U.
In the three years of the study the following
numbers of students entered A.N.U. d i rectly in the year
following their final college y ear :
1977 Year 12/1978 A.N.U. - 241 students
1978 Year 12/1979 A.N.U. - 258 students
These numbers exclude mature age students, whose TES is
calculated in a different way, preven t i n g them from being
i ncluded in the study.
Proportions of eligible students entering A.N.U.
overall and w ithin each 5/4 percentile band of TES are given
in Tables 2.1, 2.2 and 2.3. For the three years, a steady
figure of about 28^4 of eligible students took up a place at
A.N.U. However proportions varied m a r k e d l y over TES
percentiles, with g e n erally h i g h proportions in the top 15/4
of students and a gradual decline down to the 40-50-4 range
where g e n erally less than 20?4 of eligible students took up
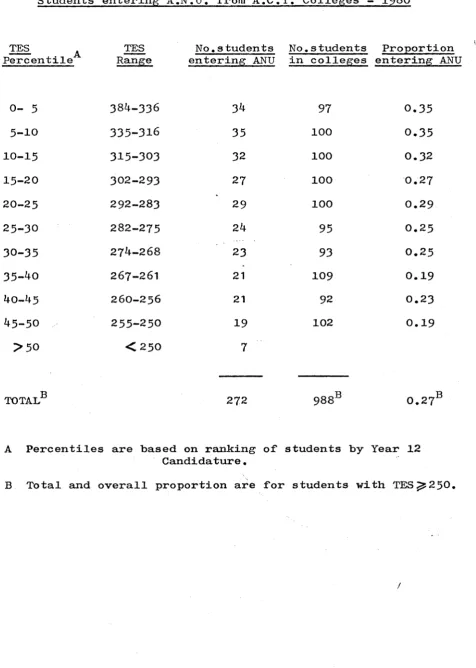
a place. The range of proportions in the third year, 1980,
seems less than that for the first two years, but it would
be difficult to a ttach significance to this observation.
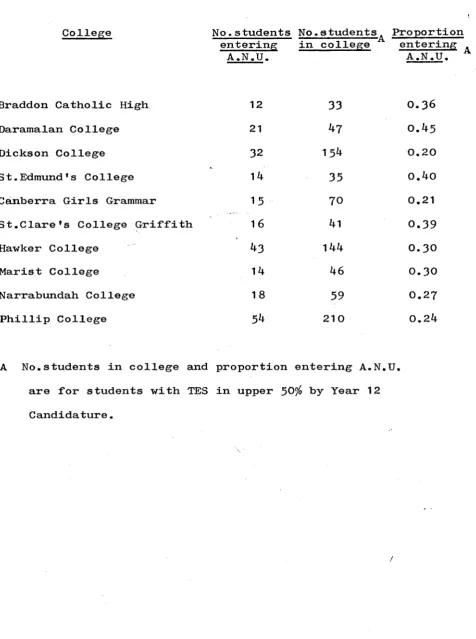
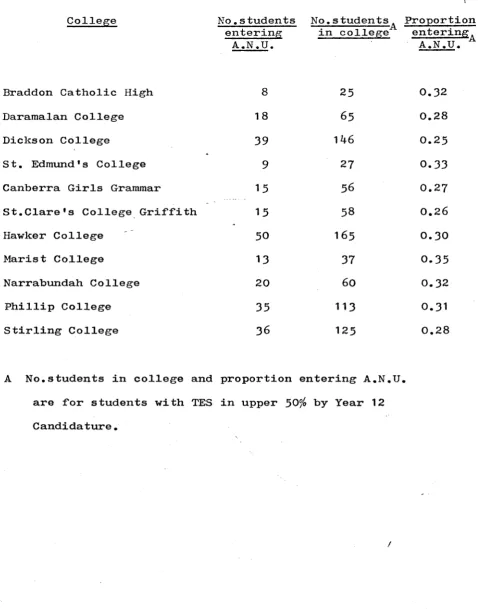
For the first two years of data, proportions of
eligible students entering A.N.U. can. also be o b tained for
each A.C.T. college. These proportions are p r e sented in
Tables 2.4 and 2.5. The range of proportions is m uch larger
in 1978 than 1 9 7 9 , but otherwise there are no consistent
patterns. Further years of data wou l d be n e e d e d to see if
entrance to A.N.U. is s i g n i ficantly affected b y college
attended.
2.3 A.N.U. Data
The f o l l o w i n g i n f o rmation was obtained for each
Course area
Full-time or Part-time
Sex
Results obtained in all units attempted.
Course area is the actual faculty or combination
of faculties in which the student is enrolled.
There are
thirteen possible course areas; Arts, Arts/Law, Law,
Economics, Asian Studies, Science, Science (Forestry),
Economics/Law, Asian Studies/Law, Economics/Asian Studies,
Economics/Science, Economics/Forestry and Science/Law.
A
number of these attract very low student numbers, and
students often choose units outside their faculty of
enrolment.
Thus in the study, course area in which the
student is enrolled has been ignored.
Rather, any grouping
of student results is based on faculty in which the A.N.U.
unit is based, or on general subject area.
Whilst whether a student is full-time or
part-time may affect that student’s achievement, no attempt was
made in the study to allow for this due to very low numbers
of part-time students amongst immediate school leavers.
In
our sample there was only
2 0part-time out of 241 in
1 9 7 8,
35
out of
2 5 8in
1 9 7 9, and
31out of
2 7 2in
1 9 8 0.
For each unit attempted by a student, the following
information was recorded :
Point value of unit
Grade obtained
Actual mark obtained.
The point value is 2 for full-year units and 1 for semester
units or full-year units with half weight.
All units
one of these. There were ten grades o b tained by students,
these being :
HD - H igh Distinction
D - Distinction
HM - Pass w ith High Merit (awarded in Economics 1
only; regarded equivalent to D)
CR - Credit
PM - Pass w ith Merit (awarded in Economics 1 only;
r e garded equivalent to CR)
P - Pass
P1 - Pass level 1 (used o nly in Science faculty
units and equivalent to P)
P2 - Pass level 2 (used o nly in Science faculty
units; a 'terminating* pass where the student
is prevented from proce e d i n g to hi g h e r units
in that subject)
N - Failure
W - Withdrawal
Summaries of numbers of students a c h i eving various grades
in various groupings of units b y faculty or subject area
are given in Tables 2.6, 2.7 and 2.8. I n 1978 the 241
students attempted 1 1 0 6 units, in 1 9 7 9 the 2 5 8 students
a t t empted 1 1 9 1 units and in 1980 the 2 7 2 students
att e m p t e d 1281 units. No attempt has b een made in these
tables to discrim i n a t e b e t ween units w o r t h 1 or 2 points,
each simply b e i n g counted as a unit attempted. The right
h a n d column in these tables, xo/o N+W* , could be called a
/
•wastage' rate. W a s tage values conform w ith already k n o w n
in Mathematical Sciences and the tendency in this group
to award much higher numbers of HD and D grades.
In the three years of the study, 89 A.N.U. units
were attempted by at least one student in one year.
Almost
all of these were units generally available to first year
students, the exceptions being Italian 2 and Modern
Chinese 2, each attempted in 1979 by a student with special
language qualifications, and Pure Maths B03H, Pure Maths B06H,
Physics B06, attempted by one outstanding student in 1979.
Not all 89 units were attempted by students in all years,
mainly due to restructuring of courses by terminating units
and introducing others. In 1978, 67 units were attempted by
one or more student in the study; in 1979, 74 units were
attempted; in 1980, 67 units were attempted.
However in
many units numbers of students were very low, with only 26
units in 1978 having at least 20 students, only 24 units in
1979 and only 23 units in 1980.
Pull details of numbers of
students in each unit and the distribution of grades
obtained are given for each of the three years in Appendix 2.
Actual marks obtained were generally available for
all results where a student achieved P2 or better.
The main
exception to this was in some Pure Maths units where the
assessment system prevented an actual mark being assigned to
the student. In addition marks were also available for some
students who failed (graded N), but naturally none for
withdrawals. Marks were generally in the range 0 to 100 with
/
- 1 2
-units), D at 75 (70 in Statistics units, 72 in Law units)
and HD at
85
(80 in Statistics units).
Where marks were
not in this general range they were rescaled.
The marks
were obtained from A.N.U. records of student results or
in some instances were supplied by individual Departments.
TABLE 2.1
Students entering A.N.U. from A.C.T. Colleges - 1978
TES
Percentile
TES Range
No. students No.
entering A N U in
students colleges
Proportion entering ANU
0- 5 360-332 24 83 0.29
0
H
1
m
331-313 37 87 0.43
10-15 3 1 2 - 3 0 2 33 79 0.42
1 5 - 2 0 301-292 27 84 0.32
2 0 - 2 5 291-284 . 25 8 8 0.28
25-30 283-277 21 8 6 0.24
30-35 2 7 6 - 2 7 0 19 83 0 . 2 3
35-40 269-265 2 0 8 1 0.25
40-45 264-259 1 6 93 0.17
45-50 2 5 8 - 2 5 3 1 1 74 0.15
> 3 0 < 253 6
T O T A L0 239C 8 3 8B O • C\{ 00
A Percentiles are based on r a n k i n g of students by Year 12
C a n d i d a t u r e .
B Total and overall pr o p o r t i o n are for students w i t h T E S ^ 253.
C There were 24l students from 1978 in the study, but two
[image:20.561.47.528.174.804.2]14
[image:21.561.44.527.136.796.2]TABLE 2.2
S tudents entering A.N.U. from A.C. T. Colleges - 1979
TES TES N o .s tudents N o .students Proportion
Percentile Range entering A M U in colleges entering A N U
0- 5 412-334 37 89 0.42
3 - 1 0 3 3 3 - 3 1 6 30 8 6 0.35
10-15 315-302 38 8 8 0.43
1 5 - 2 0 301-293 2 2 95 0.23
20-25 292-285 23 84 0.27
25-30 284-278 24 82 0.29
30-35 277-271 25 92 0.27
35-40 270-264 21 96 0 . 2 2
40-45 263-258 15 84 0 . 1 8
45-50 257-253 17 90 0.19
> 50 < 253 6
T O T A L13 2 5 8 8 8 6B 0 . 2 8 B
A Percentiles are bas e d on r a n k i n g of students b y Year 12
C a n d i d a t u r e .
TABLE 2.3
Students entering A. N.U. from A.C, T. Colleges ■- 1 9 8 0
TES A TES N o .s tudents N o .s tudents Propor t i o n
Percentile Range e n tering A N U in colleges e n t e r i n g A N U
0- 5 384-336 34 97 0.35
o
H
m
3 3 5 - 3 1 6 35 1 0 0 0.35
10-15 315-303 32 1 0 0 0.32
1 5 - 2 0 302-293 27 1 0 0 0.27
20-25 292-283 29 1 0 0 0.29
25-30 282-275 24 95 O. 2 5
30-35 274-268 23 93 0.25
35-^0 2 6 7 - 2 6 1 21 109 0.19
40-45 2 6 0 - 2 5 6 21 92 O. 2 3
45-50 255-250 19 102 0.19
> 5 0 < 2 5 0 7
T 0 T A L B 2 7 2 988B 0 . 2 7 B
A Percentiles are bas e d on r a n k i n g of students by Year 12
C a n d i d a t u r e .
[image:22.561.46.523.135.803.2]16
TABLE 2.4
College of origin of students entering A.N.U. - 1978
College N o .s tudents
entering A.N.U.
N o .students ^ in college
P r oportion entering
A.N.U.
B r a d d o n Catholic High 12 33 0.36
D a r a m a l a n College 21 47 0.45
D i c k s o n College 32 1 54 0.20
S t . E d m u n d ’s College 14 33 0.40
C a n b e r r a Girls Grammar 15 70 0.21
S t . C l a r e ’s College Gri f f i t h 16 41 0.39
H a wker College 43 144 0.30
Marist College 14 46 0.30
N a r r a b u n d a h College 1 8 59 0.27
P h i l l i p College 54 21 0 0.24
A No.students in college and propor t i o n ente r i n g A.N.U.
are for students w i t h TES in upper 50% by Year 12
[image:23.561.55.532.164.803.2]TABLE 2 . 5
College of origin of students entering A . N . U , - 1 9 7 9
College N o.s tudents
entering
A . N . U .
N o.s t u d e n t s .
..— .... —--\
in college*
Proportion entering
A . N . U . *'
Braddon Catholic High 8 2 5 0 . 3 2
D a r a m a l a n College 1 8 6 5 0 . 2 8
D i c k s o n College 3 9 1 4 6 0 . 2 5
St. E d m u n d ’s College 9 2 7 0 . 3 3
Can b e r r a Girls Grammar 1 5 5 6 0 . 2 7
St.Clare's College Griffith 1 5 5 8 0.26
Hawker College 5 0 165 0.30
Marist College 1 3 3 7 0 . 3 5
N a r r a b u n d a h College 20 60 0 . 3 2
Phillip College 3 5 113 0 . 3 1
S t i r l i n g College 3 6 1 2 5 0 . 2 8
A No.students in college and p r oportion entering A.N.U.
are for students w i t h TES in upper 50% by Year 12
[image:24.561.57.536.177.786.2]F r e q u e n c i e s o f g r a d e s o b t a i n e d b y s t u d e n t s f r o m A , C . T . C o l l e g e s -1 9 7 8 18
5= T— cn o n CM 00 MO CM rH
+ • t • • • • • • • •
r - C r — o On On MO O n -
-d-C\i CM CM CM CM cn CM H CM
ON
< 00 cn c - -3‘ On 00 H m n - ON
T— cn On m T— On ON ■cf CM cn
8
Cn CM CM -3- cn CMt * i n MO i n MO 00 r — -3- MO r“ CM
-3- -©• H r— i n CM
2 CM cn o m MO 00 CM -a- m
Cvl CM -©■ CM cn cn r
-CM I o O o o o O o n- cn J t
f t l H r—
1“ l o O o o o o o CM MO MO
o 00 H
CM H
m MO H o 00 On cn CO n - O
f t l H H H On -©■ in in
H H
•
2 1 O O O • O cn cn o o o O
PhI
« 1 ON MO c - MO MO On n- MO H
u l ON 00 H cn CM ON 00
-J-H
M o o o O o o O o o O
Q l CM MO r - H H H CM MO in
m CM H H CM CM
Q l o cn CO in O T— O cn
K l H T - r
-in T3
p G
in G ©
© <1 ©
•rl in o
T3 G p •H ©
♦H in U © © P ©
-P ID < o O © Ü
CO in *rl •H •H -rl © G m
in P T3 G E E -P o © ©
p G •H 0 •rl m O O © G •H 0
•H in S © G G +> © O G
c p •H 3 co in •H 0 O CO •H CO ©
£ U m p TO o Ü © O •H
< © G •H P f t f t cud f t CO H O
<H fcüO © G p G © CO
0 <H <H © -H 3 CO «H <H "H <h f t o 0 0 p m o O TJ O o •H 1—1
tic 5b <1 © G • 3 P ©
G G cud © >s f t f t © o
*rl P p © TJ © •H P P Ü P p E •rl 0. rH H G P in H H X H r-| © u
0 0 0 i © tlD <J G P © P P f t •H
0 o o c G o O Ü o p f t
u © <0 o to id © © © © E
Ü f t f t f t f t f t f t f t 2 f t Al
F r e q u e n c i e s of g r ad es o b t a i n e d by s t ud en ts fr o m A«C. T. C o l l e g e s — 1 9 7 9
52 O N pj- O O i n H c n 00
+ • • • • • • • •
55 m 0 m m OM m n - O
1— c n H CM CM p f CM
vO
h)
< m c n p f p t r — CM r — T—
Sn r — CM M O n - CM O 00
c n CM CM r- p f
£ m o On P± M O r— p f
cn CM r — CM CM m
£ -a - 0 CM CM p ± p f MO
r— T— m c n p f
Cvll O O 0 O O 0 O p f
CM
»“ O O 0 O O 0 O m
p f
r—
00 MO cn CM m 0
H T— CM m MO CM
T— H 1
P
M
0 O O - O m m 0 O
PC cn cn cn cn 0 t '- 0 n
-O OM 00 t— p f CM 00
H
M 0 O 0 CM CM 0 0
Q 0 p f CM CM CO r— MO 0
p f cn T— H MO
Q p f cn m CM m 0 CM m
CO T- r~ p f
CO
-p
CO p
0 C w
•H CO ü
CO r0 Ö 4-> •H
-p 53 •rl CO U co to CO 4-1
•rl -P 0 <J 0 0 0 CO
C C/D CO *rl •H •rl •H -rl 0
4-1 TO 0 TD E E -P 0
0 •rl 53 •H P O 0 0 0
«H co 0 0 -P -P 0 0 -P 0
0 -p •H P C/D to C/D 0 O C/D £ •H
CO 4-> Ü O 0 O
to < <J 0 0 •H 0 W W to kH C/D
c tD 0 0 0 0
•H Ch <H 0 -rl P -H Ch Ch *rl Ch Ch
& 0 O p co CO O 0 V 0 O
to < 0 < p
0 0 to In In S
P -p -P 0 td 0 TO 4-1 +> O 4-> 4J
O rH H H 0 3 P H H X iH H
3 0 ' i 0 tD 0 P P 0 P P
0 0 0 0 O O O 0
0 0 C 0 0 0 0 0
Co Co 55 h—< Co Co Co Co M
F r e q u e n c i e s o f g r a d e s o b t a i n e d b y s t u d e n t s f r o m A . C » T . C o l l e g e s — 1 9 8 0 20
> m o n o T— r— r— c n
+ • • • • • • • •
a r - 7“- -3* r — 7— m ON NO
CM NO CM CM c n r—
*“
a
< VO T— m CM On CM CN NO
b T— CM NO O - 3 ‘ CO -3*
8
c n CM c n r— m
CO c n CM o ON ON m
m r - - c t CM m
r— m m r — NO i n CO
-3-T— r~ i n c n c n
cm| O o o o o o O NO
b \ CM
r - | o o o o o o o cn
b \ ON
H
o o c n r - T— 00 -3- O
b \ c n T— T— -3" NO m
X \ o o o o •3* -3 ’ o O
Ph|
ß CM CM 00 NO CM m c n -3’
o ON n - r— - 3 T— c n
r—
S o o o o O o o o
a
c n cn -3* CM O H m
-3-Q CM r - CM f
-a c n cn CM -3- NO O o o
a c n
CO -P
to 3
o <! CO
•H CO ü
to 73 3 -P •H
-p 3 •H CO 3 co (0 CO -P
•H -P 0 <J 0 0 O CD
£ C/3 CO -H •H •H •H *H 0
p •P 73 3 73 E E -P o
3 •H 3 •H 3 O O 3 3
a to 3 3 +» -p 3 3 -P 0
0 -p •H 3 co CO CO 0 O C/3 £ •H
3 10 -p o o 3 O
far c 0 3 •H 3 W faD b C/3
3 faD 3 3 3 3
•H <H 3 -H 3 *H <H <h »H <H <H
a 0 0 3 co to o O 73 0 O
3 fab <j 0 <! 3
o In 3 far In In H In In
3 -p -p 3 73 3 73 -p -P o -p ■P
Ü H H H Ö 3 3 H H X H H
3 3 1 3 far 3 3 3 0 3 3
ü o 3 3 ü ü o 0
3 3 o 3 3 3 3 3
fe a a E3 fa a fe-i
CHAPTER 3
R E L A TIONSHIPS BETWEEN C O L L E G E VARIABLES
3.1 Carrelations
Relationships b e t ween the seven quantitative college
variables were i n vestigated for all college students in the
first two years. Details of the data are given in section 2.1.
C o r r elation matrices for the two years are given in
Table 3.1. All correlations are positive and hi g h l y
significant ( P < 0 . 0 0 1 ) . The highest correlations are between
the three P r i n c i p a l ’s Recommendations, \vith values greater
than 0.9 between the overall r e c o m m endation and both the
academic and personal. Correlations between TES and
P r i n c i p a l ’s Recommendations are h i gher than those between TES
and the A S A T scores. Within ASAT, correlations are very high
b e t ween the total score and each of verbal and quantitative.
The overall pattern of correlations is v e r y consistent for
the two y e a r s .
3.2 Principal Components Analyses
From the correlation matrices it was clear that the
seven variables could not in any w a y be regarded as
independent i.e. the d i m e n s i o n a l i t y of the space of
independent variables was m u c h less than seven. Thus to
22
analysis was run on the correlation matrices for each of the
first two years.
Results of these principal components analyses are
presented in Table
3 , 2 .
In 1977, the first 3 principalcomponents accounted for
9 k . k%
of the variation, and in 1978the first 3 principal components accounted for
9 k .O c/o
of thevariation. Thus there were only e f f e ctively about 3
dimensions for the independent variables. However the most
important aspects of the results from the analyses were the
r e a dily interpretable latent vectors and the consistency of
results for the two years.
In each analysis the first component, a c counting
for about 73% of' the variation, simply gives the magnitude
of student ’ability', as contributed to by all variables
w ith roug h l y equal loadings. This is h a r d l y a surprising
result given the nature of the variables. The second
component, a c counting for about 1 6'% of the variation, gives
a contrast b e t ween scores obtained in A S A T and scores
awarded b y Principals in their recommendations. Loadings
within A S A T and Principal's R e c o m mendations are of similar
magnitude in this component. Thus the Principals are
clearly doing more than just re f l e c t i n g a b i lity as
meas u r e d by A S A T w h e n they do their recommendations. The
third component, a c c o u n t i n g for about 6$ of the variation,
gives a contrast b e t w e e n A S A T verbal scores and A SAT
quantitative scores. Thus to some extent, A S A T is
m a n a g i n g to d i s criminate b e t ween two types of abilities.
/
The c o n s i s t e n c y of the results from the two
consistency, and the related h i g h similarity between
correlation matrices for the two years, that determined
that there was no point examining detailed figures for all
college students for the third year of the study. However
the consistency did not stop there. For each of the two
years, principal components analyses were also run for each
college and remar k a b l y similar results were obtained for
all colleges. N a t u r a l l y the magnitudes of the loadings in
the latent vectors and the actual percentages of variation
explained v a r y slightly, e s pecially for colleges with
smaller numbers of students. H o w ever the general magnitudes
of percent variance explained and the i n t e r p retation of the
components remains the same. As an example, the results of
the principal components analyses on results of students
from S t . C l a r e ’s College G r i f f i t h are presented in Table 3-3.
This college has smaller Year 12 student numbers than most
o t h e r s .
3« 3 P r i n c i p a l ’s R e c o mmendations
A most prominent aspect of the results of the
principal components analyses is the lack of discrimi n a t i o n
b e t w e e n the three Principal's Recommendations in the 9h c/o of
var i a t i o n in the first three components. Consistent w ith
this, it was not e d that correlations between these
recommendations were v e r y high. This indicates that
Principals m a y be giv i n g e f f e c t i v e l y only one r e commendation
24
To gain further insight into the nature of
Principal's Recommendations, frequencies of various types
of recommendations are presented in Table 3*4. For about
50
°
/
o
of the students, Principals give the same score foreach component, academic, personal and overall, and in
about a further 3
5?o
of cases the personal score is onegreater than the academic score w i t h overall taking one of
the two values. A d d i t i o n a l l y in about a further 10
°
/
o
ofcases the personal score is one less than the academic
score, w ith overall taking one of the two values. Thus
there is a tendency for Principals, if a w arding different
scores, to give personal a h i g h e r score than academic.
H o w ever with this tight structure of scores accou n t i n g for
about 9
5°/>
of cases, it is not difficult to see w h y thereis no effective overall d i s c r i mination be t w e e n the three
r e c o m m e n d a t i o n s .
3.4 Use of Principal Components Analyses in Regressions
A m a j o r r eason for doi n g a principal components
analysis on i n d e pendent variables is so that these
independent variables are not then used in regression
analyses as if there was no relatio n s h i p b e t w e e n them. In
this study we w i s h to use the college variables as
independent variables to predict marks obtained in A.N.U.
units, or to predict other measures of achievement. It
w o u l d be desirable if the 3 components ident i f i e d b y the
/
analyses could replace to some extent the seven original
In order to use a component, we need to calculate a ‘Principal Component Score' to replace the observed data. Such a score is defined by :
PC Score for component j
11
z
- J L iM
t-1
where
(Xi
A
X )
n y
«U
no. of independent variables mean of variable i
variance of variable i
observations for which score is being calculated
,tj = loading of variable i in component j Thus to apply the results of the principal components analyses to our data, we need to determine values of
y \\j\ and CT^ for each of the 7 variables and f*or each
component for each variable.
The close similarity of the analyses for the two years enable values o f a n d oC'^j adopted
which will yield PC scores applicable to all three years of
2
data. This involves adopting means i t k , variances s^ and loadings which will suffice in defining a meaningful component score. In Table 3*5» observed values of means and standard deviations are given, as well as the adopted means (m^), standard deviations (s^) and latent vectors
(loadings JL ^ ) . Observed latent vectors are in Table 3*2. Note that in the case of ASAT variables, the means and
26
scores Tor an observation (x^,...,x_) are then defined by
PC Score for component j
- M e
l
L - l
PC scores obtained in the above manner were
calculated in each regression analysis described in
Chapters
4
and
5
.
Theoretically the scores should be
independent, hence the amount of variation explained by
each component separately should add to the amount explained
by including all three in the regression.
TAB L E 3.1
Matrices of Correlations between college variables
1977 College Year 12
1 6 9 7 students^
1 TES 1. 0 0
2 A S A T Verbal 0 . 6 0 1 . 0 0
3 A S A T Quant. O. 6 5 0.38 1 . 0 0
4 A S A T Total 0.71 0.84 0.92 1 . 0 0
3 P. Rec. Academic 0.81 O. 5 8 0.34 0 . 6 3 1. 0 0
6 P. Rec. Personal 0 . 7 6 0.49 0.43 0 . 5 1 O. 8 5 1 . 0 0
7 P. Rec. Overall 0 . 8 2 O. 5 6 0.51 0 . 6 0 0.93 0.93 1
1 2 3 4 5 6
A O f the 1701 students (Appendix 1), 4 w ere not given A S A T or
P r i n c i p a l s Recomme n d a t i o n s so were o m i t t e d
1978 College Year 12
1 7 5 8 students^
1 TES 1 . 0 0
2 A S A T Verbal 0 . 6 0 1. 0 0
3 A S A T Quant. 0.67 0 . 6 2 1 . 0 0
4 A S A T Total 0.71 0.85 0.94 1. 0 0
3 P. Rec. Academic 0.79 0.54 0.57 0 . 6 2 1. 0 0
6 P. Rec. Personal 0.78 0.48 0.49 0.53 0.83 1 . 0 0
7 P. Rec. Overall 0.81 0.52 0.54 0.59 0.92 0.91
1 2 3 4 5 6
B O f the 1759 students (Appendix 1) 1 was not given A S A T so was omitted.
.00
7
1.00
28
TABLE 3.2
Results of Principal Components Analyses on College Variables
1977 College Year 12
l697 students
1
Component
2 3
°/o Variance 7 2 . 6 1 5 . 7 6 . 1
Latent Vectors
TES - 0 . 4 0 - 0 . 0 9 - 0 . 2 1
A S A T Verbal - 0 . 3 4 0 . 3 5 0 . 7 9
AS A T Quant. - 0 . 3 4 0 . 4 8 - 0 . 5 8
A S A T Total - 0 . 3 8 0 . 4 7 1 0 • 0
Prin. Rec. Academic - o . 4 o - 0 . 2 9 0 • 0
Prin. Rec. Personal - 0 . 3 7 - 0 . 4 4 0 . 0 2
Prin. Rec. Overall - 0 . 4 0 - 0 . 3 7 0 . 0 1
1978 College Year 12
1758 students
1
Component
2 3
°/o Variance 72.9 15.5 5.6
L atent Vectors
TES -0.40 - 0 . 1 1 -0.14
A S A T Verbal -0.34 0.41 0.77
A S A T Quant. - O .36 0.43 - 0.61
A S A T Total -0.39 0.47 - 0.06
Prin. Rec. Academic -0.39 - 0.31 0.00
Prin. Rec. Personal -0.38 -0.42 0.06
[image:35.561.51.548.59.738.2]TABLE 3.3
Results of Principal Components Analyses on College Variables
1977 St. C l a r e t _College G r i f f i t h
97 students
Component
1 2 3
°/o Variance 7 5 . 6 14.2 5.2
Latent Vectors
TES -0.41 -0 . 1 3 0.00
A S A T V erbal -0 . 3 7 0 . 2 5 -0.78
AS A T Quant. -0 . 3 2 0 . 5 8 0.59
A S A T Total -0 . 3 8 0.46 -0.07
Prin. Rec. Academic -o.4o -0.26 0.05
Prin. Rec. Personal -0 . 3 6 -0.43 0.10
Prin. Rec. Overall -o.4o “ O. 3 3 O. 1 6
1 9 7 8 St. Clare
123
* s College
students
1
G r i f f i t h
Component
2 3
°/o V ariance 7 8 . 3 12.2 4.5
Latent Vectors
TES -0.41 -0.10 0 . 0 5
A S A T Verbal -0.3k 0.48 0.73
A S A T Quant. -0.37 0.34 -0 . 6 5
A S A T Total -0.39 0.42 - O. 1 5
Prin. Rec. A c ademic -0.39 -0.22 -0 . 0 7
Prin. Rec. Personal “ 0.34 “ 0.54 0.11
[image:36.561.51.557.74.785.2]3 0
-TABLE 3 * 4
Frequencies of P rin c ip a l1s Recommendations A
awarded to College Students"
Recommendation 1 9 7 7 1978
All 3 Same 111 4 5 21
2 2 2 1 1 3 8 4
3 3 3 201 2 1 4
4 4 4 2 2 6 238
5 5 5 201 1 9 9
666 1 4 7 116
Total 9 3 3 (54.956) 8 7 2 (49.656)
Pe 1 g re a ter than Ac & Ov
(121,232,j k j , 454,565) 2 8 8 (16.956) 3 2 6 (18. 556)
Pe & Ov 1 g re a ter than Ac
(122,233,344,455,566) 2 5 9 (15.256) 2 9 5 (16.8 °/o)
Pe 1 le s s than Ac & Ov
(212,323,104,545,656) 5 0 (2.956) 9 6 (5.556)
Pe & Ov 1 le ss than Ac
(211,322,433,544,655) 8 0 (4.756) 9 7 (5.556)
Pe 2 g re a ter than Ac; Ov between
(132,243,354,465) 3 7 (2.256) 2 6 (1.556)
Pe 2 le s s than Ac; Ov between
(312,423,534,645) 14 (0.856) 13 (0.756)
Other with
Pe g re a ter than Ac 21 9
Pe same as Ac 13 2 2
Pe le s s than Ac 6 3
Total 4 0 (2.456) 3 4 (1.956)
TOTAL 1 701 1 7 5 9
[image:37.561.55.556.71.768.2]M e a n s , Standard Deviations and Latent Vectors adopted
(i)
Tor C o nstruction of Principal Component Scores
Means
(ii)
(iii)
Variable 1977 1978 Adopted
TES 2 5 2 . 6 6 2 5 2 . 3 3 252
A S A T Verbal 6 6 . 2 6 6 5 . 9 2 65
A S A T Quant. 6 5 . 6 7 6 7 . 2 4 65
A S A T Total 6 6 . 0 4 6 7 . 1 6 65
Prin. Rec. A c ademic 3 . 7 7 3 . 7 5 3 . 7 5
Prin. Rec. Personal 4 . 0 6 4.01 4 . 0 5
Prin. Rec. Overall 3 . 8 9 3 . 8 7 3 . 9 0
Standard Deviations
Variable 1977 1978 A d o p t e d
TES
44.75
4 7 . 4 6 46A S A T Verbal 1 4 . 5 0 1 4 . 5 4 15
A S A T Quant. 1 4 . 7 8 1 4 . 4 0 15
A S A T Total 1 4 . 6 4 1 4 .4 7 15
Prin. Rec. A c ademic 1 .2 9 1 . 2 3 1 . 2 7 5
Prin. Rec. Personal 1 . 3 2 1 . 2 5 1 .2 7 5
Prin. Rec. Overall 1.31 1 . 2 5 1 .2 7 5
A Latent Vectors A d o pted
Variable
1
Component
2 3
TES o . 4 o - 0 . 1 0 1 0 •
t--A S t--A T Verbal 0 . 3 4 0 . 3 8 0 . 7 8
A S A T Quant. 0 . 3 5 0 . 4 5 - 0 . 6 0
A S A T Total 0 . 3 8 0 . 4 7 - o . o 4
Prin. Rec. A c ademic 0 . 4o -O.3O 0.0 1
Prin. Rec. Personal 0 . 3 7 - 0 . 4 3 0 . 0 4
Prin. Rec. Overall o . 4 o - 0 . 3 7 0 • 0
See Table 3 . 3 for Latent Vectors o b t a i n e d from 1977 and
[image:38.561.58.528.53.803.2]32
C H A PTER 4
PREDICT!ON O F M A R K S IN A,N .U. UNITS
4.1 Correlations w i t h College Variables
Alth o u g h there were over 6 3 A.N.U. units in each
year where one or more result was available, m a n y had such
small numbers that it was impossible to attempt to relate
marks to the college variables. To attempt to overcome
this, it had to be decided w h e n it was valid to group units
and then include all results from the group in a regression
analysis. In m a n y cases there were o b v i ously different
distributions of marks for units from different departments,
and within departments there were, in some cases, different
units w ith different degrees of d i fficulty e.g. 'honours'
and 'pass' levels. C o n s e q u e n t l y it was decided to only
group units w ithin a department and w i t h the same degree of
difficulty. Thus the following groupings were able to be
formed :
Hist o r y 1 units
G e o g raphy 1 units
English 1 units (1980 only)
L inguistics 1 units
Romance languages (French and Italian)
Applied Maths A21 & A22
A few other groupings wou l d have been possible but were not
done because there were enough results in each separate
unit e.g. Computer Science A01 & A02. Grou p i n g over years
was not considered, as p r e l i m i n a r y analyses had shown large
differences between the years in m a n y aspects considered in
this study.
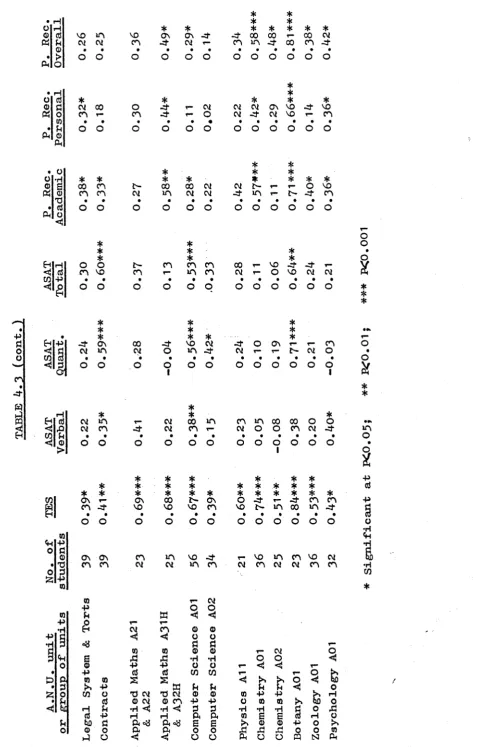
R e gression analyses were thus run for 29 units or
groups of units on the 1978 data, for 33 on the 1979 data
and for 28 on the 1980 data. Correlations between marks
obtained in these units or groups of units and the seven
college variables are presented in Tables 4.1, 4.2 and 4.3.
Correlations b e t ween marks and TES were positive
and significant in the vast m a j o r i t y of cases. They were
also greater than correlations with each of the other six
variables in most instances. This was part i c u l a r l y so for
the Faculty of Science units, however it was not true for
some Arts units and for L a w units. The lower correlations
for L a w units are not surprising as L a w students only o ccupy
the top end of the TES distrib u t i o n (approximately T E S > 3 0 0 ) .
The cases where the correlation was not significant
g e n e rally occurred where nu m b e r of students was low,
instances where one or two 'peculiar* results could easily
upset a pattern.
Fewer A S A T correlations were significant, and where
they were the TES c o r r elation was g e n erally higher. O n l y in
La w did A S A T stand out, probably because of the narr o w e r
-TES range and because most L a w students received Principal's
Recommendations of 3 or 6, leaving little scope for ,
- 3 4
-in Arts units, whereas A S A T quantitative and A 3 A T total
correlations tended to be hi g h e r in most other areas.
The three correlations between marks and each of
the Principal's R e c o m mendations were generally of a
similar size, due no doubt to the closeness of the
recommendations, as d i s c ussed in chapter 3« However in
v e r y few instances, and certainly not in a consistent
pattern, were these correlations greater than those of
marks w i t h T E S .
4.2 Correlations w i t h Principal Component Scores
For each of the units or groups of units in Tables
4.1, 4.2 and 4.3» correlations were also calculated between
marks and the three Principal Component Scores.
The first component, w h i c h was a measure of
student 'ability', was signif i c a n t l y posit i v e l y correlated
w ith marks obtained in m a n y cases, h o w e v e r in v e r y few of
these was the correlation greater than that w ith TES; in
1978, 4 occurrences o nly w i t h 3 in L a w units; in 1979»
3 occurrences w ith 2 in L a w units; in 1980, 9 occurrences
w i t h 2 in L a w units and the other 7 in the Faculty of
Economics. In the case of the L a w units, u s u a l l y one or
more of the A S A T correlations were hig h e r than the PC Score
correlation, whereas for Economics in 1980, even though the
correlations were grea t e r the differences b e t ween them and
TES correlations were small («<0.05 in all cases), so not
important. Because this component is b e h a v i n g essentially
like TES but w i t h 'contamination' from other variables, the