[email protected]
https://eprints.whiterose.ac.uk/
Reuse
This article is distributed under the terms of the Creative Commons Attribution-NonCommercial-NoDerivs
(CC BY-NC-ND) licence. This licence only allows you to download this work and share it with others as long
as you credit the authors, but you can’t change the article in any way or use it commercially. More
information and the full terms of the licence here: https://creativecommons.org/licenses/
Takedown
If you consider content in White Rose Research Online to be in breach of UK law, please notify us by
Contents lists available atScienceDirect
Environmental Modelling & Software
journal homepage:www.elsevier.com/locate/envsoft
Mobile Augmented Reality for Flood Visualisation
Paul Haynes, Sigrid Hehl-Lange
∗, Eckart Lange
∗∗Department of Landscape, University of Sheffield, Floor 13, The Arts Tower, Sheffield, S10 2TN, UK
A R T I C L E I N F O
Keywords:
Mobile augmented reality Flood visualisation Browser Authoring Mobile
Real timeflood modeling
A B S T R A C T
Mobile Augmented Reality (MAR) for environmental planning and design has hardly been touched upon, yet mobile smart devices are now capable of complex, interactive, and immersive real time visualisations. We present a real time immersive prototype MAR app for on site content authoring andflood visualisation com-bining available technologies to reduce implementation complexity. Networked access to live sensor readings provides rich real time annotations. Our main goal was to develop a novel MAR app to complement existing flood risk management (FRM) tools and to understand how it is judged by water experts. We present app de-velopment in context of the literature and conduct a small user study. Going beyond the presented work, the flexibility of the app permits a broad range of applications in planning, design and environmental management.
1. Introduction
Appropriate use of tools for visualisation inflood risk management (FRM) depends on the problem at hand. In particular,flood visualisa-tion often employs inundavisualisa-tion mapping methods similar to those re-ported inMaidment et al. (2016). Systems such as the Iowa Flood In-formation System (IFIS) web platform (Demir and Krajewski, 2013), for example, combine inundation maps, sensor readings, and other data, to inform community flood risk assessors (FRA's). These are important tools in FRM providing clear orthographic views of potential risks over wide areas which help facilitate expert analysis.
Virtual Reality (VR), Augmented Reality (AR), and more recently Mobile AR (MAR) (Chatzopoulos et al., 2017) and Citizen Science (Montargil and Santos, 2017; O'Grady et al., 2016; Degrossi et al., 2017) create new opportunities to investigate alternative modes of vi-sualisation and interaction for citizen, volunteer, and expert FRA en-gagement. This is important due to an increased need to communicate
flood risks as a precautionary measure (Hagemeier-Klose and Wagner, 2009). In this direction our main goal is tofirstly develop a MAR app to enable the user to track an unspecified location, populate it with building geometry, and visualise an augmented realityflooding of the environment. Secondly we seek to understand how such an app is re-ceived by water experts. Hence, we seek to apply the aforementioned technologies to FRM, in particular how AR may be applied and how it is received by FRA's as a complementaryflood visualisation tool as part of the FRM process. It is important to note that we do not seek to replace existing FRM tools, but to enhance them using immersive AR
technology and to investigate the usefulness of such tools to support discussion about planning proposals.
Previous works have identified user preference towards immersive 3D visualisation (Gill et al., 2013) and experimental mobile applica-tions were designed to take VR into thefield (see e.g.Gill and Lange, 2015). Unlike laboratory-based 3D and VR simulations MAR offers new levels of engagement linking simulations with an on-site experience. Nowadays, powerful smart phones and emerging technologies such as MAR provide an opportunity to immerse the user in a visualisation whilst simultaneously experiencing the observed world environment. Observed and augmented realities may be perceived separately or to-gether, depending on how the user chooses to experience the AR. A user, for example, may choose to intentionally note differences between the observed and augmented realities, or engage directly with the augmented reality in place of the observed reality. In general, AR presents a range of benefits to the planning and design process (Lange, 2011) such as location based information applications to support un-derstanding of landscape futures and the environment.Bishop (2015), for example, demonstrates a variety of potential prototype applications to urban and landscape planning, including a simple prototypeflood app.
Mobile devices with 3d-graphics capabilities are increasingly ubi-quitous, but their potential use in landscape and urban planning has hardly been touched upon, which we seek to explore.Grainger et al. (2016) emphasize the need for environmental data visualisation for non-scientific contexts, such as public engagement and expert appli-cation in thefield. Morgan et al. (2010) presented workshop-based
https://doi.org/10.1016/j.envsoft.2018.05.012
Received 29 March 2017; Received in revised form 8 May 2018; Accepted 21 May 2018 ∗Corresponding author.
∗∗Corresponding author.
E-mail addresses:s.hehl-lange@sheffield.ac.uk(S. Hehl-Lange),e.lange@sheffield.ac.uk(E. Lange).
Environmental Modelling and Software 109 (2018) 380–389
Available online 10 September 2018
1364-8152/ © 2018 The Authors. Published by Elsevier Ltd. This is an open access article under the CC BY-NC-ND license (http://creativecommons.org/licenses/BY-NC-ND/4.0/).
rapid prototyping of urban river corridors using 3D interactive real time graphics, where lab-based modeling and visualisation software (SketchUp and Symmetry 3D) was used to prototype models for the Urban River Corridors and SUstainable Living Agendas (URSULA) project. In later work Gill and Lange (2015)explored on site VR vi-sualisation of planning and design models where complex visualisa-tions, ordinarily viewed on laboratory projectors, were“streamed”to a remote smart device and viewed in a web browser, bringing mobile VR to thefield via portable lightweight smart device technology.
Traditional support and risk management systems appear pre-dominantly desktop or lab based making use of inundation maps (Maidment et al., 2016) with systems such as the IFIS (Demir and Krajewski, 2013) mentioned earlier. On the other handAmirebrahimi et al. (2016), for example, presented decision support for the evaluation of building risks inflood prone areas, with 3D visualisations of water
flow around, and evaluation of damage to, new builds.Van Ackere et al. (2016)showed web-basedflood damage visualisations of large coastal regions, with the aim of encouraging“…people to mitigate and adapt to climate change.”
An early AR environmental management system developed by
Romão et al. (2004)was Augmented Environments (ANTS), a system of technological infrastructure which augmented contextual information with physical structures and natural elements within the environment. Infrastructure consisted of a wearable laptop, a head mounted display (HMD), motion tracker, video camera, GPS system, and mobile phones for communications. Pilot applications included monitoring water quality levels, visualising temporal evolution of landscape pasts and futures, and sub-soil structure visualisation. Except for HMD's, smart phones are, remarkably, sophisticated enough to contain all this in-frastructure in a single lightweight device, with huge potential for ap-plications to environmental management, planning and design.Bishop (2015), for example, presents a variety of AR applications related to understanding landscape futures. One such application is a MARflood visualisation concept app in which a terrain model of the Snowy River
flood plains was statically clipped above one metre. Manual positioning of the clipped geometry achieved a perceived alignment of terrain model and live image feed through the camera of the mobile phone with aflood visualisation one metre in height.
On site (in situ) modeling is a difficult problem, and potentially important to environment, planning and design applications since de-cisions made in the field, e.g. the inclusion of design features, might otherwise be overlooked in a laboratory setting (Lange, 2011). In par-ticular, a major problem in AR is that of registering points in the real world with points on the device display and displaying 3D graphics
correctly in perspective (e.g. seeChatzopoulos et al., 2017). One solu-tion demonstrated by Demir (2014) in lab-based AR used fiducial markers to augment a 3D model of pre-defined scenarios in which students could control environmental parameters to learn about hy-drological processes such as flooding and flood damage. An HMD (Oculus Rift) option enabled users to experience the visualisation ste-reographically for an alternative immersive experience. Systems which usefiducial markers rely on known and physically placed markers to track the environment, which can be problematic in open outdoor en-vironments (seeKato and Billinghurst, 1999). Fiducial markers often
find use where inventories of objects may be identified, such as in the museum guide byMata et al. (2011), for example.
The novelty of our approach is in combining real time population of building models, interactiveflood visualisation, and integration with the WeSenseIt Citizen Water Observatory web platform (Mazumdar et al., 2016;Lanfranchi et al., 2014) for live sensor readings such as water level, humidity, and soil moisture. Overall, we aim to elucidate expert perceptions of MAR technology applied to FRM. Wefirst present our methodology, detailing software architecture, design, and data
flow, novel algorithms, testing and evaluation, then show the actual implementation of the software as an app, with results of testing and the evaluation plan. A discussion then follows and conclusions are drawn.
Supplementary video related to this article can be found at
https://doi.org/10.1016/j.envsoft.2018.05.012.
2. Methodology
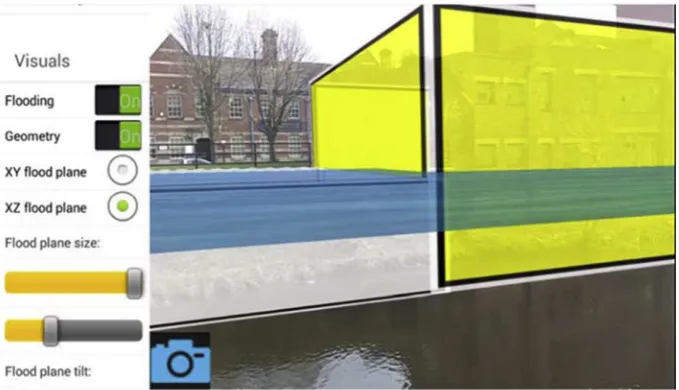
The presented work is based on previous work by the authors, shown inFig. 1, where primitive cuboids were manually transformed into position using the touch screen (Haynes and Lange, 2016a,2016b) to visually align with the live image feed in much the same wayBishop (2015) aligned a terrain model of the Snowy River flood plains. A constructive solid geometry (CSG) difference operation applied to building geometry and flood plane simulated waterflow, where the building geometry could be made transparent, and the flood plane translated vertically to different water levels.
[image:3.595.129.469.56.251.2]time sensor annotations.
2.1. User experience
A summary of user experience is now given to aid in the under-standing of the remainingfigures in this section. The app is formed of three distinct activities for (i) main menu, (ii) project information and options, and (iii) authoring and browser. The former two enable the user to create new projects, find, select and view existing project in-formation and options, whereas the latter activity is where authoring and/or browsing (i.e. visualisation) occurs. Return to previous activities is achieved by pressing the device back button. Authoring/browser activity interaction occurs via a retractable side menu. A typical au-thoring use case would see the user select the triangulate menu option to triangulate a point by focusing a central annulus on a desired point and tapping the touch screen three times from three different view-points, repeating this process to triangulate further points. Then, se-lecting to add geometry from the menu allows the user to attach, or “hang”, geometry to these triangulated points. Model parameters may
be adjusted via the menu to adapt the model to the existing natural features. Additionally, textual annotations may be attached to trian-gulated points, such as sensor readings, which appear as spinning in-formation cubes, to be selected during browsing. Lastly, aflood plane may be turned on (see early prototype in Fig. 1), and the building geometry turned off, revealing aflood plain obstructed by the invisible building geometry. Thisflood plane may be moved up and down via the touch screen and low/high water levels set. As the user moves theflood plane up and down theseflood level extremities are automatically in-terpolated to give the user a feel forflood depth.
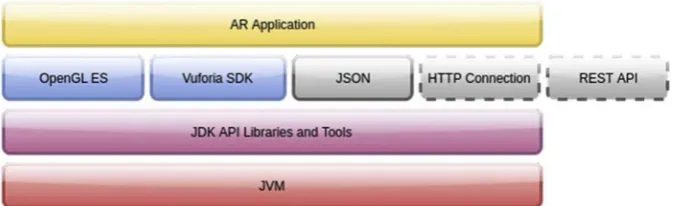
2.2. Software architecture, design, and dataflow
A high level overview of application architecture is shown inFig. 2, which was built on the Android system using Java. Hence, the Java Virtual Machine (JVM) and Java Development Kit Application Pro-gramming Interface (JVM API) libraries and tools form the core tech-nology. Higher layers include OpenGL ES 2.0 for rendering graphics and the Vuforia Software Development Kit (SDK) to provide AR sup-port. A HTTP connection is required intermittently to communicate with the WeSenseIt REST server API. Data is represented in the JSON
file format.
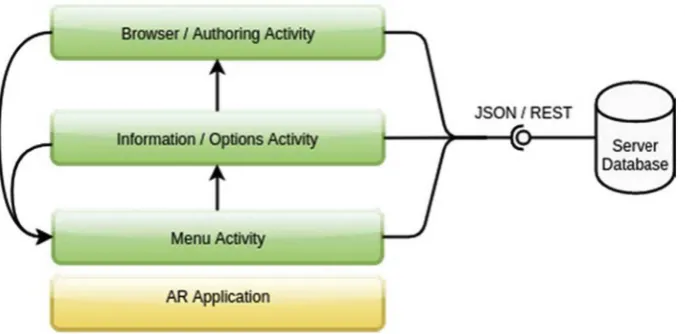
Fig. 3 shows core application design with the application at the base. Activityflow proceeds in the directions indicated, with recourse to previous activities via the device's back button. The JSON/REST interface indicates the web service which manages database access, and is accessed from all three activities.
Detailed sequence diagrams of each activity functions, and inter-actions between the different software architectures inFig. 2, may be found inAppendix C.
2.3. Algorithms
Our approach to point registration uses the well known method of triangulation (see e.g.Slabaugh et al., 2001), where the coordinate of a perceived point to be triangulated is computed as the closest point to three raysr1, r2, andr3in model space. The novelty, however, is in using the AR SDK to compute rays normal to the screen at various different viewpoints for triangulation. When triangulating points a rayr
in model space, central and normal to the current screen orientation, is continually computed using the AR SDK, and recorded when the user taps the screen. Three such rays, registered in sequence, are used to triangulate a single pointxin model space. For visualisation purposes, these triangulated model space points when transformed by the AR SDK, produce points corresponding to perceived features in the en-vironment as displayed on the device display. Once triangulated a point is visualised on the device display invariant of device pose. This in turn enables the user to populate the environment with geometry to match perceived expectations.
Another procedure involves the way in which building of geometric shapes in an augmented space is achieved. Afirst attempt was to tri-angulate corners of whole building facades or natural features, from which polygons were then constructed. But it was soon realised that three points were often not in the required plane, or that four or more points were not exactly co-planar, which led to undesirable or imprecise models of buildings or natural features, and hinderedflood visualisa-tion. The employed solution was to attach the top left and right corners of pre-defined model facades to two triangulated points. Internal model parameters may be changed in real time to alter model particulars to match perceived building or natural feature details, e.g. to widen an internal arch, or stretch a model in depth or height. This approach worked well and combined model positioning control with co-planar model facades. The pre-defined models are not so specific as to hinder general application, especially with the ability to change model para-meters to match the surrounding environment.
2.4. Testing and evaluation
Besides the usual progressive developmental unit tests carried out, functional testing of the app was performed on site at Fishlake, Doncaster UK, to ensure the app worked as expected, reveal any tech-nical problems, and raise any remaining usability issues. Testing cen-tered around checking the following aspects of the app:
1. Main menu activity, including map location, automatic project list, and project search.
2. Information/options activity, including operation under difficult conditions, such as disabled WiFi or GPS.
3. Create new project, including target image capture, point triangu-lation, attaching and changing geometry parameters, definingflood plane extremities, and annotating points.
[image:4.595.132.469.623.726.2]4. Open existing project, browsing the project, selecting information bubbles, observing theflood plane.
Fig. 2.High level software architecture overview.
P. Haynes et al. Environmental Modelling and Software 109 (2018) 380–389
Software was evaluated by means of a small user study of experts in cooperation with Doncaster City Council in the UK. The study is in a very narrow field with a very limited number of specialised experts, however, we were able to assemble eleven experts aged 25 to 65 plus whose professions included emergency planners,flood risk engineers, local government officers, bridge inspectors, civil engineers, resilience coordinators, andflood wardens (seeBogner et al., 2009). Participants were (i) shown a power point presentation of app operation at Stain-forth bridge, Fishlake, Doncaster UK, (ii) shown video footage of the app in use on site, (iii) given the opportunity to try the app for them-selves, and lastly (iv) asked tofill in a questionnaire.
Evaluation was intended to determine how the app would be re-ceived by experts, and how different aspects of participant's experience in FRM influenced perception. A copy of the questionnaire can be found inAppendix A. In the majority of questions participants were asked to specify particular levels of personal expertise or rate a particular aspect of the app on a scale of 1 (non-expert/least) to 5 (expert/most), the raw data of which may be found inAppendix B.
3. Results
3.1. Implementation
The core authoring/browser activity code is available on GitHub for download. We also give a description of application components with reference to the literature, to generally help with implementation re-producibility, and refer the reader back tosubsections 2.1-2.3for ad-ditional detail.
As with general purpose AR “browsers” (Kooper and MacIntyre, 2003;Langlotz et al., 2013) the presented system combines a number of technologies including environment tracking, localisation, data access, networking, visualisation and interaction (e.g. see Langlotz et al., 2014). Additionally, a driving principle behind development was Anywhere Augmentation (Höllerer et al., 2007) which seeks to enable AR in unprepared environments, so that users are not restricted to a
finite number of specific locations. Tracking technology should be in-dependent of location choice so fiducial marker tracking is not prac-tical. Natural Feature Tracking (seeWagner et al., 2008) and Simulta-neous Localisation and Mapping (SLAM) (see e.g. Kurz et al., 2014;
Reitmayr et al., 2010; Ventura and Höllerer, 2012; Ventura et al., 2014), however, can achieve this goal where any site suitably rich in natural or artificial features may be tracked. After comparing available AR SDK's (see e.g.Amin and Govilkar, 2015) we chose the Vuforia SDK with NFT as a compromise which gave good tracking ability in a rela-tively small area but with reduced implementation complexity. NFT is a markerless technology suited to scenes in which a homography exists between the viewpoints (Pirchheim and Reitmayr, 2011;Zhou et al.,
2008). A tracking database automatically created by the SDK is used to track natural features present in the environment, calculate pose esti-mation, and correctly render content in perspective as a function of the tracking database and user's position.
Projects are stored on the WeSenseIt server in JSON format. Content includes project name, location, target image, tracking database, geo-metry,flood height extremities, and textual/sensor annotations. JSON sensor data is retrieved via the WeSenseIt RESTful web service and includes sensor ID, name, region, longitude, latitude, mobility (e.g.
fixed/mobile sensor), measurement frequency, and latest/previous value.
Creating points, geometry, or annotations is achieved via the re-tractable side menu within the main authoring activity. Any in situ AR authoring system requires an interaction device to register and select points of interest (POI's.) Past examples include a wearable laser (Wither et al., 2008), a camera mouse (Bunnun and Mayol-Cuevas, 2008), and custom built pinch gloves (Piekarski and Thomas, 2001). In
Simon's (2010)approach a visual software based solution uses a central cross-hair to target POI's, which we also employ here for simplicity and ease of dissemination (see alsoHaynes and Lange, 2016a,2016b). In this approach POI's are triangulated by focusing the yellow annulus in
Fig. 4on a POI from three different viewpoints, tapping the screen at each viewpoint to register the point. This technique was also adopted in
Bunnun and Mayol-Cuevas (2008)andWither et al. (2008)but with custom built hardware devices.
[image:5.595.129.472.56.223.2]Three-dimensional model content authoring is an extremely chal-lenging technical problem. Pioneering approaches such asPiekarski and Thomas (2001, 2003), which required an ensemble of infrastructure much like that inRomão et al. (2004), enabled construction of building geometry by physically aligning oneself with walls to mark out infinite planes, the intersections of which defined building perimeters. Such an approach is physically demanding and could prove intractable given the presence of rivers or other obstructions. Another approach byLanglotz et al. (2012a)used an adapted SLAM algorithm with panoramic or-ientation tracking in outdoor environments by assuming a static user position and allowing rotational device movements only. In our ap-proach it is necessary to occlude a virtualflood plane to create the impression of waterflow around obstructing building facades (Haynes and Lange, 2016a). After some experimentation the most recent eff ec-tive approach attempted involved attaching the facade of a simple pre-defined model to two triangulated points, in some sense “hanging” geometry on triangulated points. The benefit of this approach was po-pulation of the augmented space withperfectly geometric shapesin the required augmented positions, something which seemed difficult by constructing polygon facades from triangulated points alone. Model parameters may be adjusted using the retractable menu, e.g. to widen an arch or increase or decrease height or depth.
Textual annotations can further enrich user experience by providing additional information on demand. Mata et al. (2011), for example, used fiducial marker recognition to display textual annotations in guiding tourists around a museum. Our approach to in situ annotations requires the user to select a triangulated point which displays the an-notation input dialog shown inFig. 5(left).
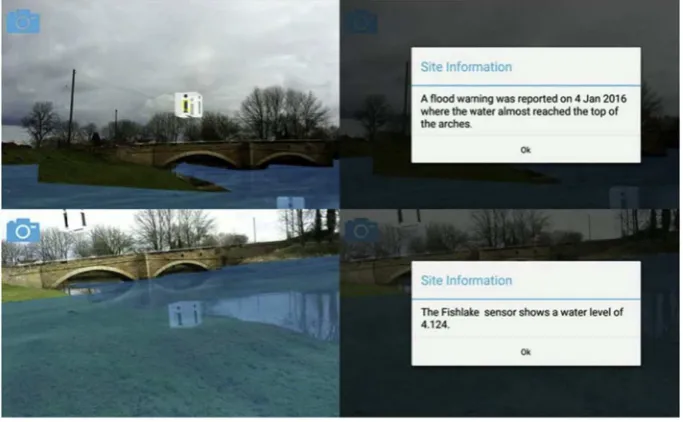
Examples of informative annotations might include evacuation route details or historicalflooding events. Water sensor identification tags may be entered which are replaced by live sensor readings taken from the WeSenseIt web service API in real time, e.g.“The #sh.154.160 sensor is showing a water level of #latestValue meters.”would display “The Fishlake sensor is showing a water level of 2 meters.”Supported
sensor tags currently include latest/previous sensor readings, and sensor longitude and latitude. Once created, annotations appear as ro-tating annotation bubbles, selecting which displays the relevant in-formation as inFig. 6, where the sensor hash-tags are replaced with live sensor readings.
3.2. Software testing
On location at Fishlake, Doncaster, UK, the app was opened and the main menu activity appeared. An existing nearby project (made earlier) appeared in the automatically updated list, downloaded from the server over the wireless internet connection, shown at the bottom of the menu inFig. 7a. This is also visible on the map inFig. 7b, and showed up via the search functionality in Fig. 7c. Selecting the existing location opened the location information activity shown inFig. 7d. As authors of this project we could enable password protected editing should we wish. Alternatively a“browser”user may proceed in browse mode only in which case authoring tools are not available. We note one un-avoidable caveat here is GPS or network failure. Projects are also stored locally in case Internet connection is unavailable, which may be
uploaded later, or projects may be downloaded in advance if network availability is known to be unreliable. On the other hand, if GPS is unavailable the user may search for a project providing there is an Internet connection, and when creating new project locations GPS may be edited later manually. These eventualities were all taken into ac-count during development stage, and worked as expected when WiFi and/or GPS were intentionally disabled on the device.
Instead of opening the existing project, authors may also create new projects. On doing so the author/browser activity was opened in which a target image of the site was taken by pressing the camera icon shown inFig. 8. Tracking is then indicated by the rectangular white border which appearsfixed from the various different device orientations. As expected, due to the nature of NFT successful tracking works when the underlying SDK captures a good enough quality target image. We found tracking to work within about 6 m of the location where the target image was originally captured, but ultimately this depends on the quality of the target image, measured in feature density by the Vuforia SDK, and tracking stability depends on the extent to which the target image is homographic.
The retractable side menu inFig. 4provides the necessary functions to register points (triangulate, delete points), annotate points (textual/ sensor), edit prototype geometry (add blocks, arches, delete geometry), stretch geometry, andflood the environment (defineflood plane, set min/max flood heights, enable/disable flood plane and prototype geometry visualisation).
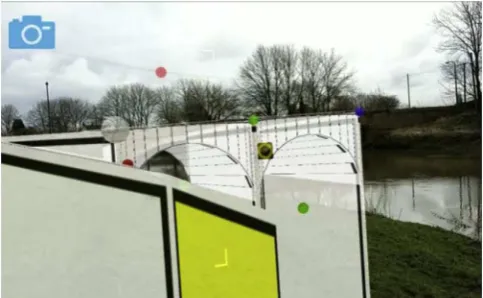
In triangulating points we found in practice that viewpoints need only be at most a meter apart with minimal site navigation.Fig. 9shows triangulated points corresponding to features of Stainforth bridge, Fishlake, with pre-defined model geometry“hung”from those points. As the user moves around the site and orients the device the points remain in their expected positions.
[image:6.595.126.469.58.246.2]Cuboids and arches were hung from triangulated points, and then Fig. 4.Browser/Authoring tool. AR tracking showing side menu, interaction annulus, and two triangulated points.
Fig. 5.Creating annotations and setting water extremities.
P. Haynes et al. Environmental Modelling and Software 109 (2018) 380–389
[image:6.595.126.472.275.383.2]scaled in depth and height using the menu and touch screen, very si-milar to the approach inLanglotz et al. (2012b)where a stylus pen was used to transform objects on the screen in real time.
Flood level extremities were defined by enabling and sliding the virtual water plane level to visually known measured heights, such as the current known water level or to coincide with known building measurements, and setting the water level heights via the side menu, as inFig. 5(right).
The authoring process worked perfectly, with the only possible hindrance being the weather. Strong winds can affect augmentation stability, but this is not enough to severely disrupt performance. The app most likely worked well due to the fact that modeling can be performed either outdoor (in situ) using a target image taken directly of the environment, or indoor (ex situ) using the same target image on the desktop computer screen. Hence the app was tested extensively in the lab prior to the live test, which reduced the number of problems po-tentially occurring in situ.
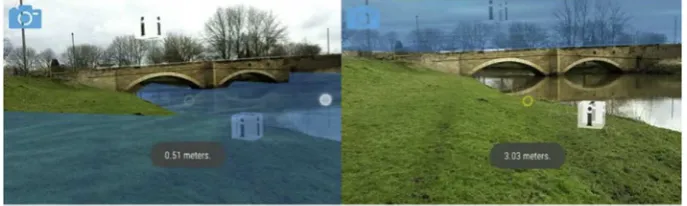
After exiting the authoring activity by pressing the device's back button we then opened the newly defined project as a“browser”. In this mode no editing tools are available and theflood plane appeared au-tomatically, with transparent building geometry, and the user free to slide theflood level up and down to simulate what a realflood might look like (see Figs. 10 and 11). Depths were interpolated between
extremities as theflood plane moved, giving an indication as to how high the water level might be in a realflooding event.
Information bubbles were selected and successfully displayed the additional information added during the authoring stage, shown in
[image:7.595.127.469.58.269.2]Fig. 6.
[image:7.595.317.547.300.441.2]Fig. 6.Example point annotations. Selecting information bubbles (left), displays associated annotations (right).
[image:7.595.100.501.555.728.2]3.3. Software evaluation
The raw data inAppendix Bis summarised statistically inTable 1. Box plots are shown inFig. 12with outliers statistically identified as single points.
In addition to observations on the centrality and spread of data, we formulated meaningful and relevant questions by statistically de-termining how certain participant responses were correlated with others. Practicalities involved in gatheringflood management experts into a single cohort lead to a relatively small sample size, with relatively sparse scatter diagrams sometimes non-linear in appearance and often containing tied data (seeFig. 13).
Hence, in order to identify correlations between questionnaire re-sponses we calculated Spearman's rank correlation coefficient, which can deal with skewed, linear, and non-linear relationships. Due to the presence of tied data, and therefore duplicate ranks, Spearman's
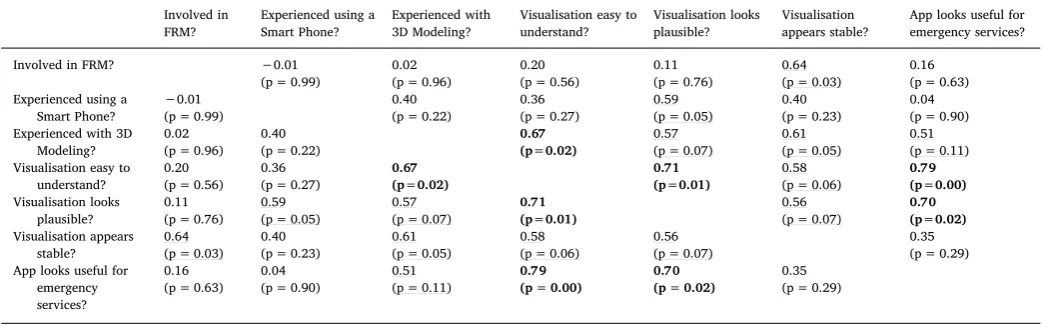
coef-ficient must be computed with full covariance, and not the approximate formula as is often used. Table 2shows a comparison of correlation coefficients between all possible pairs of questions.
4. Discussion
4.1. Data analysis
Responses to questions are generally skewed, to which degrees and nature (magnitude, positive or negative skew) are shown in Table 1.
Fig. 12shows a wide range of FRM experience, but with most partici-pants in the expert category with a negative skew of data. This is substantial since the number of experts from which one may obtain feedback is highly limited and gathering many different experts to-gether simultaneously is logistically difficult.
The majority of participants were familiar using a smart phone with a median rating of 4, negative skew and a single outlier. Most partici-pants were not experienced with 3D modeling, as seen by a distinct positive skew and median rating of 2, which is interesting when
compared to the median rating of 4 for involvement in FRM which has opposite skew. This may suggest that experts do not currently utilise 3D modeling software (not to mention AR) in FRM tasks, which could be interpreted to highlight the novelty of our application of AR to FRM. The majority of participants thought the visualisation was easy to un-derstand with a median rating of 4, negative skew and one outlier. Indeed, after viewing video footage relating to Fig. 11 (right), one participant who witnessed theflooding at Fishlake in 2007 reported“… having watched build up in 2007/flood episode, [I am] not surprised by [the] visualisation [height].”Almost all participants described the vi-sualisation as plausible as evidenced by a median rating of 4 and a zero inter-quartile range (IQR), showing nearly all responses were unan-imous. Both visualisation stability and perceived usefulness to the emergency services were viewed in a positive light with median of 4 and IQR of 0.5.
Perceived usefulness of the app was negatively skewed with a single outlier and a maximum rating of 5 attained. Participant comments concerning perceived usefulness included“…[I] see some application for sharingflood awareness. Planning applications–impact of building on flood risk areas,” and“… could see this being useful for house-holders to consider the threat offlooding to their property.”We inter-pret overall questionnaire results to show support in favor of our ap-proach.
4.2. Correlation analysis
Table 2 shows the symmetric Spearman correlation coefficient matrix between all questions. All correlations were positive except a very weak negative correlation between FRM and experience using a smartphone. Spearman's coefficient is suitable for skewed data and the possible non-linearity of our data (see e.g.Figs. 12 and 13).
[image:8.595.42.284.57.206.2]Ourfirst observations related to whether or not involvement in FRM or experience with a smart phone or 3D modeling correlated with opinions concerning whether the visualisation was easy to understand, looked plausible and stable, and if the app was deemed useful for emergency planning. Ourfindings inTable 2show weak correlations between involvement in FRM and visualisation plausibility and use-fulness to emergency services, but with a 97% confidence a moderate positive correlation with visualisation stability. However, these weak correlations do not imply a lack in support from experts, as the scatter diagram inFig. 13(top) demonstrates. Rather the correlation statistic is inconclusive and more data is required. Fig. 13(top) shows the re-lationship between expert and app usefulness is quite complicated, but is in the higher ratings suggesting that experts didfind the app useful. No meaningful statistically significant correlations were observed be-tween experience with a smart phone and other responses. Interest-ingly, experience with 3D modeling software showed moderate positive correlation with visualisation understanding, plausibility and stability with between 93% and 99% confidence, and usefulness to emergency services with approximately 90% confidence. This could signal a de-pendence between 3D modeling experience and positive perceptions of the visualisation and app overall, despite 3D modeling experience among experts being positively skewed.
[image:8.595.129.467.622.728.2]Fig. 9.Attaching and transforming prototype building geometry to points.
Fig. 10.Flooding with building geometry on (left), and geometry off(right).
P. Haynes et al. Environmental Modelling and Software 109 (2018) 380–389
Involved in FRM?
Experienced using a Smart Phone?
Experienced with 3D Modeling?
Visualisation easy to understand?
Visualisation looks plausible?
Visualisation appears stable?
App looks useful for emergency services?
μ 3.91 4.00 1.91 4.09 3.91 3.64 3.82
σ 1.22 0.89 1.04 0.83 0.70 0.67 0.87
Q1 3.50 4.00 1.00 4.00 4.00 3.50 3.50
Q2 (median) 4.00 4.00 2.00 4.00 4.00 4.00 4.00
Q3 5.00 4.50 2.50 4.50 4.00 4.00 4.00
IQR 1.5 0.5 1.5 0.5 0 0.5 0.5
[image:9.595.126.470.60.163.2]Skewness −1.15 −0.84 0.7 −1.2 −1.64 −1.47 −0.56
[image:9.595.32.566.222.734.2]Fig. 12.Boxplots of the data demonstrating skewness.
[image:9.595.138.460.567.727.2]Our next observations concerned whether or not usefulness to emergency services was correlated to any of visualisation under-standing, plausibility, or stability.Table 2clearly shows high correla-tion between percepcorrela-tions of usefulness to the emergency services and visualisation understanding and plausibility with a 98%–99%
con-fidence. However, no statistically significant correlation could be de-termined between usefulness and visualisation stability.
Finally, we note a strong positive correlation with 99% confidence between visualisation understanding and visualisation plausibility, which seems natural to expect. We can only speculate about the meaning behind these correlations, but their identification as part of this research gives clues as to what factors effect expert opinion and how further work might proceed in a useful way to benefit the FRM domain. A further study with larger sample size would serve to sharpen
findings and steer future research and development.
4.3. Limitations
NFT technology permits an acceptable, but ultimately limited, ra-dius of site exploration which appears to depend somewhat on the homography of natural features in a scene. A result of this limitation is that triangulated points tend to be more or less co-planar. Attaching prototype geometry to co-planar points is sufficient for the current application since buildings by riversides often appear co-planar far in the distance from the user's location. However, to emulate truly realistic virtual water flow around buildings requires more convincing 3D building models. One participant e.g. reported he could“…see this has a use for members of the public to visualiseflood existences, but not so much from a planning perspective as the modeling for FRA's is more detailed.” Detailed pre-prepared 3D models could solve this problem but is somewhat removed from the principle of anywhere augmentation (Höllerer et al., 2007). In addition, tracking proximity could be en-larged by using a wide-area tracking capability such as bespoke SLAM (see e.g.Kurz et al., 2014;Reitmayr et al., 2010;Ventura and Höllerer, 2012; Ventura et al., 2014), which could also facilitate an improved supervised method of triangulation, where automatically triangulated points are recommended for selection.
Another limitation concerns the current SDK (version 5) which does not permit programmatic extraction of the tracking database so, for future browsing, the author must separately process the target image offline using the SDK's web-based database manager and upload it to the project via the app at a later time. A future version of the SDK may include data extraction functionality which would solve this problem. On the other hand, Langlotz et al. (2012b) implemented their own solution where the target image was sent to a custom server for external processing and the database returned locally to the client once
processing was complete. Ideally, we would develop a bespoke SLAM system, effectively removing the need for the underlying AR SDK and make available the tracking database to process, store, and retrieve as required without limitation.
5. Conclusion
Our app and study were intended to evaluate the potential useful-ness of MAR technology to FRM tasks. We interpret our results to be in support of the hypothesis that those involved in FRM perceived the app as useful for the emergency services. However, from comments it was clear that greater geometric model complexity was required to be useful for serious application. Given that a majority of participants were in-volved in FRM but were less experienced with 3D modeling software could suggest 3D modeling and visualisation may not feature promi-nently in current FRM activities, which could be interpreted as sup-porting the novelty of our approach in context of FRM. Hence, whilst we believe MAR can be useful in expert FRM, further work must be carried out such as updating the underlying AR technology, possibly using a wide area SLAM algorithm. Triangulation of natural features could also be semi-automated via the SLAM algorithm, whereby the salient points are automatically filtered to be selected by the user. Improvement of tools for in situ modeling are also necessary, com-plemented with the ability to import existing complex models, parti-cularly for expert FRM activities. Automatic loading of local content would be more in line with the full AR browser paradigm (Langlotz et al., 2013) where geolocated geometric models and content could be automatically downloaded and displayed.
Overall it is demonstrated that MAR technology could be useful in FRM and it is hoped this work provides support in this direction. Expanding the scope for future research MAR could be linked to a na-tionalflood forecasting model such as e.g. the US National Water Model or the Iowa Flood Information System, where e.g. in case of an extreme rainfall event MAR could demonstrate the water storage capacity of natural or built-up environments. In general MAR has the potential for wider applications in planning, design and environmental management.
Acknowledgments
[image:10.595.37.559.89.252.2]This work was part of the WeSenseIt project funded by the European Union - Horizon 2020 Programme under grant agreement number 308429 (www.wesenseit.eu). We would like to thank Doncaster City Council, UK for their help in the user study, and all reviewers of EM&S for their helpful comments in revising the manuscript.
Table 2
Symmetric matrix of Spearman's rank correlation coefficients. Entries in bold correspond to statistically significant strong correlation, those underlined show moderate correlation, and those not emphasized show weak correlation.
Involved in FRM?
Experienced using a Smart Phone?
Experienced with 3D Modeling?
Visualisation easy to understand?
Visualisation looks plausible?
Visualisation appears stable?
App looks useful for emergency services?
Involved in FRM? −0.01 0.02 0.20 0.11 0.64 0.16
(p = 0.99) (p = 0.96) (p = 0.56) (p = 0.76) (p = 0.03) (p = 0.63) Experienced using a
Smart Phone?
−0.01 0.40 0.36 0.59 0.40 0.04
(p = 0.99) (p = 0.22) (p = 0.27) (p = 0.05) (p = 0.23) (p = 0.90) Experienced with 3D
Modeling?
0.02 0.40 0.67 0.57 0.61 0.51
(p = 0.96) (p = 0.22) (p=0.02) (p = 0.07) (p = 0.05) (p = 0.11) Visualisation easy to
understand?
0.20 0.36 0.67 0.71 0.58 0.79
(p = 0.56) (p = 0.27) (p=0.02) (p=0.01) (p = 0.06) (p=0.00)
Visualisation looks plausible?
0.11 0.59 0.57 0.71 0.56 0.70
(p = 0.76) (p = 0.05) (p = 0.07) (p=0.01) (p = 0.07) (p=0.02)
Visualisation appears stable?
0.64 0.40 0.61 0.58 0.56 0.35
(p = 0.03) (p = 0.23) (p = 0.05) (p = 0.06) (p = 0.07) (p = 0.29) App looks useful for
emergency services?
0.16 0.04 0.51 0.79 0.70 0.35
(p = 0.63) (p = 0.90) (p = 0.11) (p = 0.00) (p = 0.02) (p = 0.29)
P. Haynes et al. Environmental Modelling and Software 109 (2018) 380–389
system with reduced computational effort. In: Proceedings of the 7th IEEE/ACM International Symposium on Mixed and Augmented Reality (Pp. 61–64). IEEE Computer Society.
Chatzopoulos, D., Bermejo, C., Huang, Z., Hui, P., 2017. Mobile augmented reality survey: from where we are to where we go. IEEE Access 5, 6917–6950.
Degrossi, L.C., de Albuquerque, J.P., Restrepo-Estrada, C.E., Mobasheri, A., Zipf, A., 2017. Exploring the Geographical Context for Quality Assessment of VGI in Flood Management Domain. AMCIS, Boston, USA.
Demir, I., Krajewski, W.F., 2013. Towards an integratedflood information system: cen-tralized data access, analysis, and visualization. Environ. Model. Software 50, 77–84.
Demir, I., 2014. Interactive web-based hydrological simulation system as an education platform using augmented and immersive reality. In: ASEE North Midwest Section Meeting, October 16-18, 2014, Iowa City, IA, USA.
Gill, L., Lange, E., Morgan, E., Romano, D., 2013. An analysis of usage of different types of visualisation media within a collaborative planning workshop environment. Environ. Plann. Plann. Des. 40 (4), 742–754.
Gill, L., Lange, E., 2015. Getting virtual 3D landscapes out of the lab. Computers. Environment and Urban Systems 54, 356–362.
Grainger, S., Mao, F., Buytaert, W., 2016. Environmental data visualisation for non-sci-entific contexts: literature review and design framework. Environ. Model. Software 85, 299–318.
Hagemeier-Klose, M., Wagner, K., 2009. Evaluation offlood hazard maps in print and web mapping services as information tools inflood risk communication. Nat. Hazards Earth Syst. Sci. 9, 563–574.
Haynes, P., Lange, E., 2016a. Mobile augmented reality forflood visualisation in urban riverside landscapes. Journal of Digital Landscape Architecture 1, 254–262.
Haynes, P.S., Lange, E., 2016b. In-situ Flood Visualisation Using Mobile AR. 2016 IEEE Symposium on 3D User Interfaces (3DUI), March 2016. pp. 243–244 Greenville, SC, USA.
Höllerer, T., Wither, J., DiVerdi, S., 2007.“Anywhere augmentation”: towards mobile augmented reality in unprepared environments. In: Gartner, G., Cartwright, W., Peterson, M.P. (Eds.), Location Based Services and TeleCartography. Springer, Berlin, Heidelberg, pp. 393–416.
Kato, H., Billinghurst, M., 1999. Marker tracking and HMD calibration for a video-based augmented reality conferencing system. In: Proceedings of the 2nd IEEE and ACM International Workshop on Augmented Reality, pp. 85–94 San Francisco.
Kooper, R., MacIntyre, B., 2003. Browsing the real-world wide web: maintaining awareness of virtual information in an AR information space. Int. J. Hum. Comput. Interact. 16 (3), 425–446.
Kurz, D., Meier, P.G., Plopski, A., Klinker, G., 2014. January. Absolute spatial context-aware visual feature descriptors for outdoor handheld camera localization over-coming visual repetitiveness in urban environments. In: International Conference on Computer Vision Theory and Applications (VISAPP). IEEE, Lisbon, Portugal, pp. 56–57 January 2014.
Lanfranchi, V., Ireson, N., Wehn, U., Wrigley, S.N., Ciravegna, F., 2014. Citizens' ob-servatories for situation awareness inflooding. In: Proceedings of the 11th International Conference on Information Systems for Crisis Response and Management (ISCRAM 2014), pp. 145–154.
Lange, E., 2011. 99 volumes later: we can visualise. Now what? Landsc. Urban Plann. 100 (4), 403–406.
Langlotz, T., Wagner, D., Mulloni, A., Schmalstieg, D., 2012a. Online creation of pa-noramic augmented reality annotations on mobile phones. IEEE Pervasive Computing 11 (2), 56–63.
Langlotz, T., Mooslechner, S., Zollmann, S., Degendorfer, C., Reitmayr, G., Schmalstieg, D., 2012b. Sketching up the world: in situ authoring for mobile augmented reality. Personal Ubiquitous Comput. 16 (6), 623–630.
Langlotz, T., Grubert, J., Grasset, R., 2013. Augmented reality browsers: essential pro-ducts or only gadgets? Commun. ACM 56 (11), 34–36.
Langlotz, T., Nguyen, T., Schmalstieg, D., Grasset, R., 2014. Next-generation augmented reality browsers: rich, seamless, and adaptive. Proc. IEEE 102 (2), 155–169.
sensing for citizen science. Mobile Network. Appl. 21 (2), 375–385.
Piekarski, W., Thomas, B.H., 2001. Tinmith-metro: new outdoor techniques for creating city models with an augmented reality wearable computer. In: Fifth International Symposium on Wearable Computers, 2001 IEEE, Proceedings, pp. 31–38.
Piekarski, W., Thomas, B.H., 2003. Augmented reality user interfaces and techniques for outdoor modelling. In: Proceedings of the 2003 Symposium on Interactive 3D Graphics ACM, pp. 225–226.
Pirchheim, C., Reitmayr, G., 2011. Homography-based planar mapping and tracking for mobile phones. In: 10th IEEE International Symposium on Mixed and Augmented Reality, ISMAR, pp. 27–36.
Reitmayr, G., Langlotz, T., Wagner, D., Mulloni, A., Schall, G., Schmalstieg, D., Pan, Q., 2010. Simultaneous localization and mapping for augmented reality. In: International Symposium on Ubiquitous Virtual Reality (ISUVR). IEEE, pp. 5–8.
Romão, T., Correia, N., Dias, E., Danado, J., Trabuco, A., Santos, C., Câmara, A., Nobre, E., 2004. ANTS—augmented environments. Comput. Graph. 28 (5), 625–633.
Simon, G., 2010. In-situ 3D sketching using a video camera as an interaction and tracking device. In: 31st Annual Conference of the European Association for Computer Graphics - Eurographics. May, 2010, Norrköping, Sweden.
Slabaugh, G., Schafer, R., Livingston, M., 2001. Optimal Ray Intersection for Computing 3d Points from N-view Correspondences. Deliverable Report.
Ventura, J., Höllerer, T., 2012. Wide-area scene mapping for mobile visual tracking. In: 2012 IEEE International Symposium on Mixed and Augmented Reality (ISMAR), pp. 3–12.
Ventura, J., Arth, C., Reitmayr, G., Schmalstieg, D., 2014. Global localization from monocular slam on a mobile phone. IEEE Trans. Visual. Comput. Graph. 20 (4), 531–539.
Van Ackere, S., Glas, H., Beullens, J., Deruyter, G., De Wulf, A., De Maeyer, P., 2016. Development of a 3D dynamicflood WebGIS visualisation tool. In: 5th International Conference on Flood Risk Management and Response (FRIAR 2016), vol. 6. pp. 560–569 3.
Wagner, D., Reitmayr, G., Mulloni, A., Drummond, T., Schmalstieg, D., 2008. Pose tracking from natural features on mobile phones. In: Proceedings of the 7th IEEE/ ACM International Symposium on Mixed and Augmented Reality. IEEE Computer Society, pp. 125–134.
Wither, J., Coffin, C., Ventura, J., Höllerer, T., 2008. Fast annotation and modeling with a single-point laser rangefinder. In: 7th IEEE/ACM International Symposium on Mixed and Augmented Reality, ISMAR. IEEE, pp. 65–68.
Zhou, F., Duh, H.B.L., Billinghurst, M., 2008. Trends in augmented reality tracking, in-teraction and display: A review of ten years of ISMAR. In: Proceedings of the 7th IEEE/ACM International Symposium on Mixed and Augmented Reality. IEEE Computer Society, pp. 193–202.
Glossary
AR:Augmented Reality
MAR:Mobile Augmented Reality
API:Application Programming Interface
SDK:Software Development Kit
Vuforia:An AR SDK
POI:Point of interest
WeSense:It Online sensor array and web platform API
RESTful:An approach to inter-computer communication via the web using simple GET, POST, PUT, and DELETE HTML address commands
JSON:A human readable datafile format standard commonly used to transmit data over the Internet.
SLAM:Simultaneous Localisation and Mapping
FRA:Flood Risk Assessors