Grammar schools
and social mobility
Jon Andrews, Jo Hutchinson
and Rebecca Johnes
September 2016
EDUCATION
POLICY
INSTITUTE
Research area:
1
About the authors
Jon Andrews is Director for Education Data and Statistics at the Education Policy Institute. Prior to this, Jon worked in the Department for Education from 2003 to 2016, most recently leading analysis for the National Funding Formula for schools, the 2015 Spending Review and the education White Paper, ‘Educational Excellence Everywhere’.
Jo Hutchinson is Associate Director for Education Data and Statistics. Jo spent ten years as a
statistician at the Department for Education, leading on evidence for the London Education Inquiry, the National Curriculum Review, behaviour and attendance, floor standards reform, and character education. Jo led the development of the Disadvantage Attainment Gap Index.
Rebecca Johnes, Research Officer. Rebecca has worked in schools in both Japan and the UK and has also worked for The Challenge, the largest provider of National Citizen Service.
Acknowledgements
The authors are grateful to EPI colleagues:
Natalie Perera, Executive Director and Head of Research. Natalie worked in the Department for Education from 2002 to 2014, where she led on a number of reforms, including the design of a new national funding formula. Between 2014 and 2015 Natalie worked in the Deputy Prime Minister's Office.
Peter Sellen, Chief Economist. Peter worked as a Government economist from 2006 to 2016, including time at the Department for Education and at HM Treasury.
The authors are also very grateful to Gabriella Bristow who provided some of the background and history of grammar schools.
About the Education Policy Institute
The Education Policy Institute is an independent, impartial and evidence-based research institute that aims to promote high quality education outcomes, regardless of social background.
Education can have a transformational effect on the lives of young people. Through our research, we provide insights, commentary and critiques about education policy in England - shedding light on what is working and where further progress needs to be made. Our research and analysis will span a young person's journey from the early years through to higher education and entry to the labour market. Because good mental health is vital to learning, we also have a dedicated mental health team which will consider the challenges, interventions and opportunities for supporting young people's wellbeing.
Our core research areas include:
Accountability and Inspection
Benchmarking English Education
Curriculum and Qualifications
Disadvantaged, SEND, and Vulnerable Children
Early Years Development
2
School Performance and Leadership Teacher Supply and Quality
Children and Young People's Mental Health
Education for Offenders
Our experienced and dedicated team works closely with academics, think tanks, and other research foundations and charities to shape the policy agenda.
This publication includes analysis of the National Pupil Database (NPD):
https://www.gov.uk/government/collections/national-pupil-database
3
Contents
Foreword ... 4
Executive summary ... 6
Introduction ... 6
England: latest Education Policy Institute analysis ... 6
Conclusions ... 10
Part 1: The policy context ... 11
A brief history of selection ... 11
The debate ... 13
International comparisons ... 14
Part 2: The current landscape ... 16
Number of selective schools ... 16
The reach of selective schools ... 17
Governance of selective schools ... 19
Part 3: The characteristics of pupils who attend grammar schools ... 22
Profile of selective school pupils compared to national rates ... 22
Selective school intakes in context ... 23
Part 4: Attainment and progress in selective schools and selective areas ... 29
Overall attainment and progress in selective and non-selective schools ... 29
Attainment gaps in selective schools and selective areas ... 31
Part 5: The impact of selection on attainment ... 38
Attainment of selective schools in context ... 38
Part 6: Conclusion and policy questions ... 44
Where next for government policy? ... 44
Challenges ... 44
4
Foreword
The Education Policy Institute is an independent, impartial, and evidence based research institute that aims to promote high quality education outcomes for all, through analysis that both informs and influences the policy debate in England and internationally.
For the last few decades, there has been relatively little public debate in England about grammar schools and about the merits and demerits of academically selective education. For at least two decades, no governing party or parties have proposed either to increase or reduce the role of grammar schools in English education. However, since Theresa May became Prime Minister in July 2016, and with the publication of the Government consultation document ‘Schools that Work for Everyone’ (September 2016), that has all changed, and the role of grammar schools is firmly back at the centre of both educational and political debate.
The government’s consultation paper proposes more selective schools, helping children “from all backgrounds”, including children in households which are “just about managing”.
Few issues have divided educational debate in England over the last 60 years more than the effects and desirability of grammar schools and academic selection. Views are often sharply polarised, with claim and counter-claim being made about the supposed benefits or costs of these selective
approaches.
Some of the supposed effects of grammar schools – for example on social inclusion and on student morale and confidence - are difficult to measure or open to competing assessments because of different value systems. But other claims – about the effects of grammar schools on attainment, and on social mobility – should be easier to measure and evaluate. In this document, the Education Policy Institute has looked in detail at these issues, to test the different and conflicting claims being made, and to enable a more informed debate about these complex and controversial issues. We hope that this paper will contribute to improving the quality of debate, and helping policy-makers to make the right judgements in relation to their ambitions.
We have addressed some of the weaker claims about grammar schools, and derived clear evidence of their impacts, by looking behind the raw headline statistics, for example to compare the impacts of different school types on pupils with similar characteristics. We are grateful to the Department for Education for granting us access to the National Pupil Database to undertake this work – though the analysis and conclusions here are all our own responsibility.
Even with the detailed and generally high quality data available, and as previous high quality
5
Our analysis also focuses on attainment up to Key Stage 4, and has not looked at Key Stage 5 outcomes – which will be the subject of a future report. Looking at Key Stage 5 might or might not lead to refinements to the conclusions reached below.
Finally, it is important to note that our analysis seeks to look at the impact on attainment and performance gaps of the existing system of selective school provision in England. We have also tried to draw conclusions about the likely impact of any future policy evolution, by comparing outcomes in areas of high and low academic selection. But we are unable to say with certainty what the precise impacts of an as yet unspecified policy are likely to be – the Government has so far not given any clear information on the scale of increase in selective education which is proposed, and nor has it explained how pupils from lower income and disadvantaged families might be favoured in any future admissions system. Without this information, it is simply not possible to say without doubt whether the effects which we presently find are likely to be magnified or reduced in size.
In spite of these inevitable qualifications, I believe that the EPI research team has made a serious, high quality, and important contribution to the analysis of grammar school impacts, which can help improve and shape this important debate. As ever, we welcome comment on the analysis and conclusions of this report, and this will help inform future work in this area.
6
Executive summary
Introduction
International evidence (PISA 2012) shows that academic selection in school systems is associated negatively with equity; and students in highly stratified systems tend to be less motivated than those in less stratified systems. This international evidence suggests that schools which select students on academic performance tend to show better school average performance, even accounting for the socio-economic status and demographic background of students and schools, on average, across OECD countries. However, a school system’s performance overall is not better if it has a greater proportion of academically selective schools. And in systems with more academic selection, the impact of socio-economic status on student performance is greater.
England: latest Education Policy Institute analysis
The Education Policy Institute has this year looked at the impact of academic selection in grammar schools on attainment and social mobility in England, using data from the school Performance Tables, the School Census and the Department for Education’s National Pupil Database. When considering the intakes of grammar schools our analysis shows that:
Pupils travel, on average, twice as far to attend a selective school as a non-selective school and a quarter of pupils in grammar schools cross local authority boundaries to attend (compared to 9 per cent in non-selective schools.) Whilst grammar schools are only found in 36 of 152 local authorities, over 40 per cent of pupils are within a reasonable travel distance of at least one grammar school.
The characteristics of pupils who attend selective schools do not reflect either national patterns or the areas in which they are situated. Some ethnic groups such as Indian and Chinese pupils are over represented in grammar schools. Pupils who are eligible for free school meals are notably under-represented in grammar schools, with only 2.5 per cent of grammar school pupils entitled to these free meals, compared with 13.2 per cent in all state funded secondary schools, and 8.9 per cent in the areas that they are situated in.
This under-inclusion of poorer children in grammar schools is unsurprising. EPI research indicates that around 40 per cent of the gap in attainment between advantaged and disadvantaged pupils emerges before children start attending school, and by the time the ‘11 Plus’ entry exam (or equivalent) is taken, 60 per cent of the large disadvantaged attainment gap – equivalent to almost 10 months of learning by this stage – has emerged. Therefore, it is simply less likely that poorer children will attain highly in tests taken at age 11, compared with pupils from more affluent family backgrounds.
When considering measures of performance and progress our analysis shows that:
7
– it is likely to be driven by the very high prior attainment and demographics of pupils in grammar schools.
At a national level, and adjusting for pupil characteristics, there appears to be no overall impact of selective schooling, either positive or negative. Taking selective areas as a whole, this conclusion applies on average both to children from low and high income backgrounds. This conclusion is likely to disappoint both the advocates of more grammar schools and the critics of selective schools expansion (for example, the present Leader of the Labour Party has claimed that “Grammar schools depress overall educational achievement”1). This result
suggests that additional grammar schools are not a good intervention for raising average standards across a schools system.
However, we do find positive attainment effects for pupils attending grammar schools (adjusting for pupil characteristics). Pupils attending grammar schools achieve, on average, an estimated one third of a GCSE grade higher in each of eight GCSE subjects, compared with similar pupils in non-selective schools in comprehensive areas.
This positive attainment effect varies by socio-economic background. For children entitled to free school meals and attending grammar schools the estimated effect is larger than for non-FSM children – at around half a grade higher in each of eight GCSEs. However, it is important to note that this is based on just 500 grammar school pupils out of almost 90,000 FSM pupils in any one year group. And the characteristics of typical FSM pupils who gain admittance to grammar schools are extremely different from FSM children who do not gain admittance to grammar schools. It is therefore probable that this positive effect is an over-estimate and that the real effect of grammar schools on FSM pupils is smaller.
At a national level, and given the current numbers of grammar schools, there does not
appear to be a significant attainment penalty from not attending a grammar school, for those children who applied and were not selected or did not apply. Such children achieve similar results as those with the same characteristics in non-selective areas.
When considering the gap between children on free school meals and other children:
The gap between all children on free school meals (attaining five A*-C GCSEs, including English and Maths) and all other children is wider in wholly-selective areas than in non-selective areas - at around 34.1 per cent compared with 27.8 per cent. This is not surprising because grammar schools attract a larger number of high-attaining, non-FSM pupils from other areas and so, in selective areas, we have a disproportionately large number of high-attaining, non-disadvantaged children, who we then compare to disadvantaged children from across the attainment distribution.
8
In addition, we find that only 30.1 per cent of pupils on free school meals in
wholly-selective areas achieved 5 A*-C grades (including English and Maths) compared to 33.3 per cent in non-selective areas.
Taken together, the large proportion of high-attaining non-FSM pupils in grammar schools, combined with the lower attainment of FSM pupils in grammar school areas, contribute to a wider gap in selective areas than in non-selective areas.
Superficially, grammar schools appear to do well in closing gaps – with a small 4.3
percentage point gap between the proportion of FSM and non-FSM children securing the 5 good GCSE standard, compared with a 25.5 percentage point gap in all non-selective schools. The Prime Minister appeared to claim that this constitutes a social mobility argument for more grammar schools. But this is a weak argument - the gap is narrow because grammar schools only select pupils who have high attainment on entry. Adjusting for prior attainment eliminates much of the difference.
It appears to be more difficult for poor children to access grammar schools, even when prior attainment is taken into account. Pupils eligible for free school meals make up 6.9% of those with high prior attainment near selective schools, but only 2.4% actually attend selective schools.
When considering high and low selection areas:
We find that positive grammar school effects on attainment decline as the proportion of pupils attending grammar schools rises. In the most selective areas, pupils attending grammar schools achieve an average of 2.3 grades (or a third of a grade in each of eight GCSE subjects) higher than similar pupils in non-selective schools elsewhere. But, for those in extremely selective areas, the positive impact of attending a grammar school reduces significantly as the proportion of grammar school places increases, falling to 0.8 of a grade (or 0.1 of a grade in each of eight GCSE subjects) in areas where the grammar school places outnumber the proportion of high-attaining pupils.
Importantly, in the most selective areas we find a small negative effect of not attending grammar schools - an average of 0.6 grades lower per pupil across all GCSE subjects (or just below 0.1 grade per subject). Furthermore, in areas with a high level of selection, pupils eligible for free school meals who did not attend grammar schools achieved 1.2 grades lower on average across all GCSE subjects (just below 0.2 grades lower per subject).
For pupils who live in the most selective areas but do not attend a grammar school, negative effects are estimated to emerge at around the point where selective places are available for 70 per cent of high-attaining pupils.
9
small but growing attainment losses for those not attending selective schools - losses which will be greatest amongst poor children.
In areas with large numbers of pupils attending grammar schools, poorer children are likely to be net losers from additional grammar school places - there are around 7,000 FSM pupils in the areas of highest grammar school coverage. Based on our estimates, 300 of these pupils could be expected to gain an average of 3 grades in total each, summing to a gain of almost 1,000 grades. But the remaining 6,700 FSM pupils would lose just over 1 grade each on average - summing to 8,000 lost grades. So this would amount to a net loss of around 7,000 grades for FSM pupils in areas of concentrated selection.
The Government has indicated that it intends to implement some type of quota system for increasing the proportion of poorer students in any new grammar schools. But our analysis suggests that in the most selective areas, government would need to expand the number of selective school places by a fifth and move 1,600 additional FSM pupils into grammar schools to try and offset the negative effect experienced by these pupils. In doing so, this expansion of selective places would result in a diminished ‘bonus’ for those who attend grammar schools and a net loss would persist.
A quota system could also present a political challenge, as well as a practical challenge in terms of defining a new group of "just about managing" households. The Government would also need to consider steps to ensure that children from lower income working households did not simply displace children from the poorest non-working households.
When considering high-attaining pupils in high-performing non-selective schools:
We have compared high prior attaining pupils in grammar schools with similar pupils who
attend high quality non-selective schools. These are schools which are in the top 25 per cent based on value-added progress measures, and represent good quality schools operating at large scale. There are five times as many high quality non-selective schools as there are grammar schools, based on this measure.
These schools are much more socially representative than grammar schools, admitting close to the national rate of FSM pupils (12.6 per cent versus 13.2 per cent nationally, and just 2.5 per cent in grammar schools). They also admit close to the national share of children with special educational needs.
Compared with these high-performing non-selective schools, we estimate that there is no benefit to attending a grammar school for high-attaining pupils, measured by "best 8" GCSE grades. There could be some gains in post-16 outcomes such as A-level grades and university entry, or relating to the difficulty of GCSE subjects studied, but these are not assessed in this report.
10
Institute from the LSE showed that for the 203 sponsored academies opened before 2010, there were average attainment gains of one grade in each of five subjects. The pupil intakes of grammar schools and sponsored academies are clearly very different in terms of prior attainment, but it is notable that these early sponsored academies educate around 50,000 FSM entitled pupils compared to around 4,000 such pupils in grammar schools. The sponsored academies programme has therefore had a much more positive impact on the attainment of disadvantaged pupils compared with the present grammar school system.
Conclusions
We find no evidence to suggest that overall educational standards in England would be improved by creating additional grammar schools. At a national level, more grammar schools would likely lead to small gains in attainment for the minority of children attending such schools, including the small number of children from low income backgrounds. But, additional grammar schools would be likely to lead to increases in the aggregate attainment gaps between rich and poor children. It would be very challenging to significantly improve grammar school access for poor children given that 60 per cent of the attainment gap arises by the time grammar school entry takes place.
In areas of the country where there is already a high proportion of selection, extra grammar school places are likely to lead to small but increasing attainment losses for all pupils who do not attend grammar schools - and net negative attainment effects for the poorest children.
The resources which might be used to create additional grammar schools could be deployed to help create high-attaining non-selective schools. High ability pupils entering such schools do as well as they would in grammar schools, up to GCSE level. They also cater for many more disadvantaged pupils.
In any case, any Government wishing to significantly raise social mobility needs to do much more to raise attainment in the early years of life and in primary schools. Selecting at age 11 is unlikely to help many poor children to attain higher grades and to succeed in life.
11
Part 1: The policy context
Grammar schools select pupils on the basis of high academic ability, determined by an entrance exam (usually the 11-plus). When the number of grammar schools in England was at its peak, during the mid-1960s, around one-quarter of pupils in state secondary schools were educated in the nearly 1,300 grammars which existed in England.2 Today, 163 grammar schools remain, responsible for the
education of 5.2 per cent of state-funded secondary school pupils.3 No new grammar school has
been permitted to open since 1998. In addition to grammar schools, only schools which operate partially-selective admissions arrangements that have not changed since the 1997-98 school year can continue to offer places to pupils according to academic ability.
Other state-funded maintained schools may select up to 10 per cent of their intake based on aptitude in the school’s specialist area (such as technology, the arts or music), provided that the admission process does not involve any test of general academic ability or any test designed to assess the pupil’s aptitude for other subjects. Selection by ability is otherwise prohibited, except for the purposes of banding and selection to sixth forms.4
It is primarily the selective entry system into grammar schools with which this report is concerned.
A brief history of selection
In the late 1950s and early 1960s, new research which highlighted the barriers faced by working class children in accessing grammar schools combined with scepticism regarding the reliability of selection tests meant that the selective school system started to be side-lined to make room for a new, comprehensive system.
A comprehensive system of education was intended to extend the high quality of education available at grammar schools to more children, regardless of ability. This approach received endorsement at a national level in 1965 from the then Labour government which encouraged local authorities to re-organise their secondary schools to a comprehensive, rather than a selective, system.
In the years that followed, successive Conservative and Labour governments sought to change the policy on selective schools but with a bias, over time, against grammar schools. The unwillingness or inability of any government either to abolish or reinstate selection completely led to inconsistencies in schooling between Local Education Authorities, with some retaining fully selective systems, some moving to entirely comprehensive systems, and some developing hybrids with elements from each. The number of grammar schools declined throughout the 1970s, falling from 1,038 in 1970 to 261 in 1979.5 By 1989, that figure had fallen yet further to 150 grammar schools.
2 P. Bolton, ‘Grammar School Statistics’, Briefing Paper 1398, House of Commons Library, June 2016, p.2. 3 P. Bolton, ‘Grammar School Statistics’, Briefing Paper 1398, House of Commons Library, June 2016, p.10. 4 Banding involves placing pupils into broad ability bands and is a way of ensuring each school in an area has
pupils representing a reasonable balance of different ability levels.
12
The introduction of GCSE qualifications with the 1988 Education Reform Act also had significant implications for the selective system. The previous dichotomy in curricula between grammar schools (in which students tended to take O-level exams) and secondary moderns (whose pupils generally took CSEs) was substantially weakened by the replacement of the two qualifications by GCSEs. The 1998 School Standards and Framework Act was the first piece of legislation to specifically outlaw the creation of any new grammar schools: existing grammar schools were permitted to continue but no new selective state-funded schools can be established under the Act.
By 2010, there were 164 grammar schools in England, which represented very little change since 1997.6 The government increasingly focused instead on its academies programme as a means of
addressing poor performance in local authority schools.
Under the Coalition government, the academies programme was continued and significantly expanded. With the Academies Act 2010, the scope of the project was extended beyond failing schools, and the most successful schools were encouraged to convert to academy status. Academies that were previously grammar schools or had partially-selective arrangements when in the local authority maintained sector can continue to be selective. All other academies must admit children of different abilities.
With increasing pressure on school places generally, the Coalition government also introduced two key changes which rendered expansion easier for existing grammar schools. First, changes made to the School Admissions Code in 2012 made it more straightforward for all schools (including
grammars) to expand by means of raising their Published Admission Number (PAN) without consultation.
Second, the School Organisation (Prescribed Alterations to Maintained Schools) (England)
Regulations 2013 created further opportunities for grammar school expansion. These allow all local authority maintained schools which meet certain criteria to enlarge their premises without following a statutory process. For community, foundation and voluntary schools, the regulations outline a simplified statutory process which local authorities can complete in order to expand a school’s premises. Academies which are seeking an extension to their premises must obtain permission from the Secretary of State, but do not need to provide a formal business plan unless the changes will result in a very large expansion or will bring the total number of pupils to 2,000 or above.7
Despite these changes, no proposals for the establishment of satellite grammar schools were accepted during the Coalition. Two proposals were rejected for grammar school expansion in
Sevenoaks in December 2013 (one by the Weald of Kent Grammar School in Tonbridge and the other by Invicta Grammar School in Maidstone), on the grounds that both proposals amounted to bids to
6 P. Bolton, ‘Grammar School Statistics’, Briefing Paper 1398, House of Commons Library, June 2016, p.10. The
number of grammar schools fluctuated between 1997 and 2004. This appears to have been due largely to instances of under-reporting before 1998. After the 1998 Act, some schools came to be categorised as grammar schools which had not previously identified themselves as such in government records but which in practice selected the vast majority of their pupils by ability. There were no new grammar schools during this period. See: BBC News, ‘Grammar schools have expanded’, 26 March 2004:
http://news.bbc.co.uk/1/hi/education/3571387.stm, accessed 14 September 2016.
7 D. Foster, R. Long, and N. Roberts, ‘Grammar schools in England’, House of Commons Library, Briefing Paper
13
open an entirely new school rather than a satellite school. In particular, both parent schools were single sex, whereas the proposed annexe was to be co-educational.8
The current position
The 2015 Conservative manifesto did not tackle the issue of new grammar schools, instead reaffirming support for ‘all good schools to expand, whether they are maintained schools, academies, free schools or grammar schools’.9
In October 2015 the then Education Secretary, Nicky Morgan, announced that she had approved a revised proposal from the Weald of Kent Grammar School to expand to Sevenoaks. Morgan stated that amended plans to make the annexe school single sex, with a co-educational sixth form, ‘represents a genuine expansion of the existing school’ and therefore now fulfilled the criteria for expansion to a satellite site.10 Later the same month, it was reported that interest in expansion had
been identified in grammar schools located in at least ten selective areas, with some of these plans involving new satellite sites in hitherto non-selective areas.11
More recently, the debate about selective schools has intensified dramatically since the new Prime Minister, Theresa May, and new Secretary of State for Education, Justine Greening, took office in July 2016. On 9 September 2016, in her first major policy speech as Prime Minister, Theresa May unveiled a series of proposed education reforms. For selective schools, these include: rendering it more straightforward for existing selective schools to expand; allowing new selective schools to open in areas where there is parental demand for selection; and permitting currently non-selective schools to become selective in cases where certain criteria are met.
This announcement also included a series of proposed requirements for grammar schools, designed to ensure that they operate so as to increase the number of good school places available throughout the school system, such as reserving a certain proportion of their own places for children from low income backgrounds; taking the lead in opening a new non-selective school, or a primary feeder school in an area of high deprivation; or sponsoring a failing, non-selective academy.12 This speech
was shortly followed by the publication of a Green Paper, outlining the proposals in more detail and beginning a three-month consultation period.13
The debate
Much of the recent debate about grammar schools has centred on the extent to which selective education can be used as a mechanism to promote social mobility. Defenders of selection argue that it is a meritocratic system that allows children from disadvantaged backgrounds to gain access to a ‘good’ school on the basis of academic ability, rather than of socio-economic background and parental ability to pay for private education or to buy a house in the catchment area of a ‘good’ comprehensive. Many advocates of selection recognise that in order to render the system of selection meritocratic, measures need to be put in place to ensure that grammar schools diversify
8 G. Paton, ‘Plans for new grammar school blocked by Michael Gove’, The Telegraph, 13 December 2013. 9 Conservative Party, ‘The Conservative Party Manifesto 2015’, April 2015, p.34.
10 N. Morgan, ‘School Expansion: Written Statement – HCWS242’, Department for Education, 15 October 2015. 11 J. Dickens, ‘Grammar expansion plans in at least 10 new areas’, Schools Week, 22 October 2015.
14
their intake and accept more pupils from lower income backgrounds. Alongside this strand of argument is one based on parental choice and diversity. The Chairman of the Conservative Party’s 1922 Committee, Graham Brady, for example, has argued that ‘If we believe in choice and variety in education and we are driven only by what works, how can we maintain the statutory ban on new selective schools?’.14
Critics of selective education, on the other hand, contend that it is socially divisive, in terms of both access and standards. They highlight the impact of a selective system on pupils who do not attend a grammar school, arguing that grammar schools necessitate the lower expectations and standards of secondary moderns. Michael Wilshaw recently stated that ‘I think we will go backwards if we return to a system where we only expect some kids to do well. Every time you create a grammar school you create three secondary moderns and no one is queuing up to go to a secondary modern’.15
International comparisons
Analysis of educational performance across OECD countries has concluded that a higher proportion of academically selective schools is not associated with better performance of a school system overall, according to results in the international PISA tests taken by pupils at age 15 in 2012.16
Selection does, however, exacerbate inequalities in an education system: the impact of the socio-economic status of pupils and/or schools on educational performance is greater in systems in which tracking is used to group pupils on to different programmes, in which pupils are categorised into different tracks at a young age, and in which more pupils attend academically selective schools.17
According to data gathered from across OECD countries, 39 per cent of the variation in the impact of socio-economic status of pupils and schools on attainment in maths can be attributed to differences in pupil age at the point of selection into different tracks, and 31 per cent of the variation is due to differences in the proportions of pupils attending academically selective schools, after accounting for per capita GDP.18 The analysis further finds correlations between the extent of tracking and
lower socio-economic inclusion, larger differences in mathematical attainment, and lower academic inclusion.19
In addition, the report identifies an association between tracking and pupil motivation, with systems in which a large percentage of pupils are educated in academically selective schools tending to describe lower levels of motivation at age 15 than those with lower proportions of pupils attending
14 G. Brady, ‘Time to end the ban on grammar schools’, The Telegraph, 19 July 2016. See also, for example: D.
Green, ‘Damian Green MP: Why it’s time to create new grammar schools’, Conservative Home, 9 December 2014.
15 A. Thomson, R. Sylvester, and G. Hurst, ‘Return of grammars would be disastrous, warns Ofsted chief’, The Times, 3 September 2016.
16 OECD, PISA 2012 Results: What Makes Schools Successful? Resources, Policies and Practices (Volume IV),
PISA, 2013, p.38.
17 OECD, PISA 2012 Results: What Makes Schools Successful? Resources, Policies and Practices (Volume IV),
PISA, 2013, p.36. The average age at which pupils are first placed in different tracks across OECD countries is 14, but this ranges from 10 to 16 when comparing different countries. See: OECD, PISA 2012 Results: What Makes Schools Successful? Resources, Policies and Practices (Volume IV), PISA, 2013, p.76.
18 OECD, PISA 2012 Results: What Makes Schools Successful? Resources, Policies and Practices (Volume IV),
PISA, 2013, pp.36, 232.
19 OECD, PISA 2012 Results: What Makes Schools Successful? Resources, Policies and Practices (Volume IV),
15
such schools. Likewise, in systems in which pupils are grouped at a young age, lower motivation levels also tend to be reported by 15 year olds students than in systems in which pupils are selected later on.20
20 OECD, PISA 2012 Results: What Makes Schools Successful? Resources, Policies and Practices (Volume IV),
16
Part 2: The current landscape
In this section we consider the number, location and geographic reach of selective schools. We look at the number of pupils who currently attend selective schools, before considering their
characteristics in more detail in Part 3. We also consider the governance arrangements of these schools particularly within the context of academisation and inter-school collaboration through multi-academy trusts.
Number of selective schools
There are currently 163 wholly-selective state-funded schools in England.
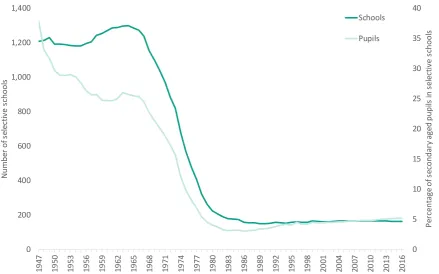
The proportion of pupils attending selective schools has remained relatively low since the closure of the majority of grammar schools during the 1970s and early 1980s. It reached its lowest point in 1986 when just 3 per cent of all secondary-aged pupils were in selective schools.21 Today, 170,000
[image:17.595.81.521.360.634.2]pupils attend selective schools representing 5.2 per cent of all secondary-aged pupils in state funded secondary schools (see Figure 2.1).
Figure 2.1: Number of selective schools and the proportion of pupils that attend them, England 1947-201621
Selective schools are found in 36 of the 152 local authorities in England. Ten local authorities are classified as ‘wholly-selective’ by the Education (Grammar School Ballots) Regulations 1998. These are Bexley, Buckinghamshire, Kent, Lincolnshire, Medway, Slough, Southend-on-Sea, Torbay, Trafford and Sutton.22
17
A further 26 local authorities are known as being ‘partially-selective’, in that they have at least one selective school. Such areas are not defined as selective by legislation, though the proportion of pupils who are educated in selective schools is often significant.
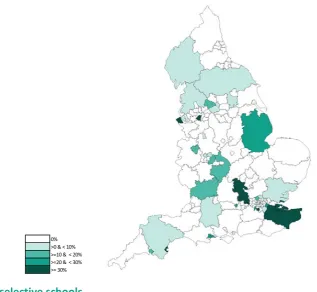
The highest concentrations of pupils in selective schools are seen in Trafford (46 per cent) and Buckinghamshire (43 per cent), and amongst partially-selective local authorities the areas with the highest level of selection are Wirral (31 per cent) and Poole (28 per cent).
At regional level, the South East has the highest proportion of state secondary pupils attending selective schools (12 per cent), followed by the South West (6 per cent.) The North East is the only region with no state-funded selective schools.
[image:18.595.123.441.322.614.2]The map in Figure 2.2 shows, of pupils who attend secondary schools in each local authority, the proportion that attend selective schools
Figure 2.2: Proportion of pupils at secondary schools within each local authority that are in selective schools23
The reach of selective schools
Attendance at selective schools is not restricted to pupils living in one of the 36 authorities with selective schools, and pupils frequently cross local authority borders to attend a grammar school in a neighbouring authority or, on occasion, even further afield. Selective schools draw a large number of pupils from local authorities other than where they are based. Analysis of the 2015 Key Stage 4
23Edubase, August 2016. Contains National Statistics data © Crown copyright and database right 2016.
Contains OS data © Crown copyright and database right 2016
18
cohort suggests that just under one quarter (24 per cent) of pupils in selective schools cross local authority borders to attend a selective school in comparison with 9per cent of pupils in non-selective schools.
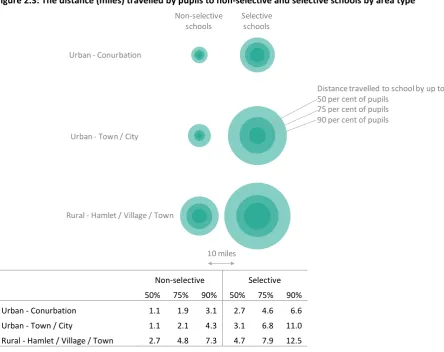
[image:19.595.76.521.264.616.2]Given the nature of admissions to selective schools it is perhaps not surprising that we find that more pupils travel further, on average, to attend a selective school than they do to other state-funded secondary schools. By again examining the 2015 Key Stage 4 cohort it is possible to quantify this effect. Within densely populated urban areas 90 per cent of pupils in non-selective schools live within just over 3 miles of the school that they attend. In selective schools the equivalent travel distance is over 6 miles. These differences are more pronounced in less densely populated areas as illustrated in Figure 2.3. Broadly speaking, pupils on average travel twice as far to attend a selective school than a non-selective school.
Figure 2.3: The distance (miles) travelled by pupils to non-selective and selective schools by area type24
Non-selective Selective 50% 75% 90% 50% 75% 90% Urban - Conurbation 1.1 1.9 3.1 2.7 4.6 6.6 Urban - Town / City 1.1 2.1 4.3 3.1 6.8 11.0 Rural - Hamlet / Village / Town 2.7 4.8 7.3 4.7 7.9 12.5
By applying these travel distances it is possible to identify areas that, in terms of distance, are within reach of a selective school. In Figure 2.4 we consider the proportion of lower layer super output areas (LSOAs)25 within each local authority that are currently within a reasonable travel distance of a
24 National Pupil Database, Key Stage 4 2015.
25 LSOAs are small geographic areas comprising between 400 and 1,200 households. There are around 33,000
LSOAs in England.
10 miles Non-selective
schools Selectiveschools
Rural - Hamlet / Village / Town Urban - Town / City
Urban - Conurbation
Distance travelled to school by up to: 50 per cent of pupils
19
selective school.26 We use this as a proxy for the proportion of pupils that are within reach of a
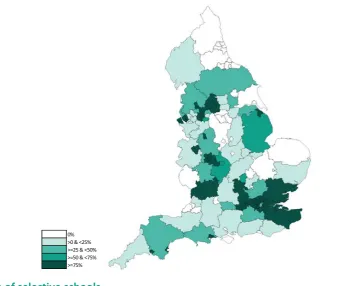
[image:20.595.116.457.213.499.2]selective school (that caters for their gender). Of the 2015 Key Stage 4 cohort, 47 per cent were within a reasonable travel distance of a selective school. Note, this does not necessarily mean that pupils from these areas do attend selective schools, the propensity to do so will also be driven by a range of pupil and area characteristics as discussed further in Part 3. Furthermore, this does not reflect the capacity of selective schools in those areas. What it does demonstrate is that local authorities that have no selection may still be affected by the presence of selective schools.
Figure 2.4: The proportion of areas within each local authority that are within a reasonable travel distance of a selective school27
Governance of selective schools
Following the Academies Act 2010, the majority of secondary schools in England have moved outside of local authority control and become academies. In April 2016, the Government set out its ambition that all schools should eventually be academies with the expectation that most would join with other schools as part of a multi-academy trust.
By the end of the 2015/16 academic year 66 per cent of secondary schools were academies (including converter and sponsored academies, free schools, UTCs and studio schools) with 52 per cent of those being part of a multi-academy trust.
26 For this analysis we consider reasonable travel distance to be the distance travelled by up to 90 per cent of
pupils to selective schools in that area type. It is not a summary of pupils that currently go to a selective school as this will be affected by a range of demographic factors.
27 National Pupil Database, Key Stage 4 2015. Contains National Statistics data © Crown copyright and
database right 2016. Contains OS data © Crown copyright and database right 2016
20
Selective schools are far more likely to be academies than other secondary schools. Of the 163 selective schools, 140 (86 per cent) are converter academies. This may in part reflect the roll-out of the academies programme which initially focussed on schools rated as Outstanding by Ofsted. Selective schools are far less likely to be part of a multi-academy trust than other secondary
academies. There are 29 selective schools that are part of a multi-academy trust with 111 set-up as a single-academy trust (SAT). This means that only 21 per cent of selective academies are part of a multi-academy trust compared to 54 per cent of non-selective mainstream secondary academies (see Figure 2.5).
This does not necessarily mean that these schools are not currently collaborating with other schools. Of those in SATs, 11 are academy sponsors (though most do not currently sponsor other schools) and there may be informal collaborative arrangements at local level.
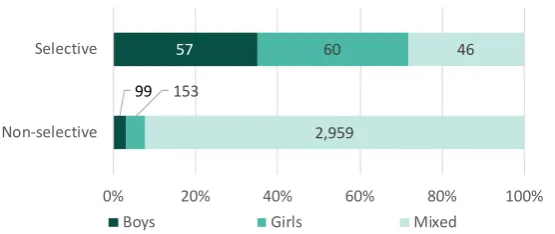
Over two thirds of selective schools are single sex. There are 46 mixed selective schools, 57 selective schools for boys and 60 selective schools for girls. The prevalence of single sex schools is much higher than that seen across all state-funded secondary schools where 89 per cent of schools are mixed (see Figure 2.6).
21
[image:22.595.76.354.251.368.2]Figure 2.5 Governance arrangements of selective schools and other state-funded mainstream secondary schools28
Figure 2.6 Single sex selective schools and other state-funded mainstream secondary schools
Figure 2.7 Religious character of selective schools and other state-funded mainstream secondary schools
28 Edubase, August 2016
1,129 29
952 111
1,130 23
0% 20% 40% 60% 80% 100% Non-selective
Selective
Multi-Academy Trust Single-Academy Trust Not an academy
99
57
153
60
2,959
46
0% 20% 40% 60% 80% 100% Non-selective
Selective
Boys Girls Mixed
618 20
2,593 143
0% 20% 40% 60% 80% 100% Non-selective
Selective
[image:22.595.87.345.400.501.2]22
Part 3: The characteristics of pupils who attend grammar
schools
There are a range of factors that are likely to affect the characteristics of pupils who attend selective schools. In this section we compare pupils who attend selective schools with pupils nationally and with pupils with high prior attainment and we consider the extent to which the demographic profile of pupils in selective schools reflects their local communities.
Profile of selective school pupils compared to national rates
[image:23.595.78.508.386.641.2]The characteristics of pupils attending selective schools differ strikingly from the population of all secondary-aged pupils.
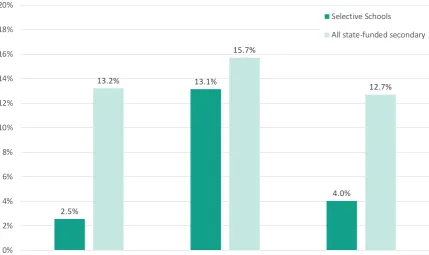
[image:23.595.77.509.387.648.2]Figure 3.1 shows that pupils who attend selective schools are far less likely to be from deprived backgrounds than pupils across all state-funded secondary schools. In selective schools 2.5 per cent of pupils are eligible for free school meals in comparison to 13.2 per cent across all state-funded secondary schools. Similarly, pupils in selective schools are slightly less likely to have a first language other than English than pupils in the wider population (13.1 per cent compared to 15.7 per cent) and far less likely to have special educational needs (4.0 per cent compared to 12.7 per cent).
Figure 3.1: Characteristics of pupils in selective schools and all state-funded secondary schools29
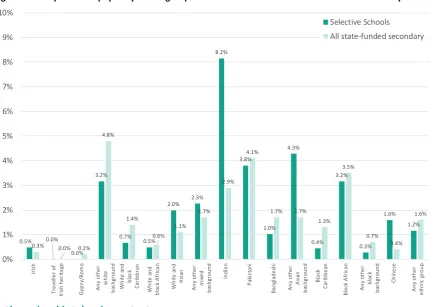
We see similar disparities when breaking this down by ethnic groups (Figure 3.2). Groups that are over-represented in selective schools include Mixed White and Asian, Indian and Chinese pupils. Indian pupils make-up 2.9 per cent of all secondary-aged pupils but 8.2 per cent of pupils in selective
29 Department for Education 2016, ‘Schools Pupils and their Characteristics’ and EPI analysis of underlying data
2.5%
13.1%
4.0% 13.2%
15.7%
12.7%
0% 2% 4% 6% 8% 10% 12% 14% 16% 18% 20%
Known to be eligible for free school
meals First language known or believed to beother than English Pupils with special educational needs Selective Schools
23
schools. Groups that are under-represented include white British and Black Caribbean pupils. White British pupils make up 70.9 per cent of all secondary-aged pupils but only 65.9 per cent of
[image:24.595.78.512.136.443.2]secondary-aged pupils in selective schools.
Figure 3.2: Proportion of pupils by ethnic group in selective schools and all state-funded secondary schools30
Selective school intakes in context
Much has been made about these disparities in the grammar schools debate. There are likely to be a number of drivers for these differences. By definition, selective schools admit pupils with high prior attainment. Amongst the 2015 Key Stage 4 cohort, the average prior attainment score of pupils in selective schools was 32.1 points – broadly equivalent to level 5 in each of reading, writing and mathematics. Amongst non-selective schools it was 27.4 points – broadly equivalent to level 4 in each subject.
Selective schools may also be in areas with demographics that differ from those seen nationally. Furthermore, these patterns may not reflect grammar schools per se, it may be that they are characteristics of schools with high attainment.
The analysis in this section uses data from the National Pupil Database to consider the Key Stage 4 cohort in grammar schools in 2015 in context.31
Pupils from disadvantaged backgrounds, from certain ethnic groups and with special educational needs have, on average, lower attainment at age 11. The attainment gap between certain groups
30 Department for Education 2016, ‘Schools Pupils and their Characteristics’ and EPI analysis of underlying
data. Excludes White British pupils for clarity. White British pupils make up 65.9 per cent of selective schools and 70.9 per cent of all state-funded secondary schools.
31 Note that restricting to one cohort within selective schools means that we see a slightly different profile of
characteristics to the all pupil figures but the relative prevalence of particular groups remains similar.
0.5% 0.0% 0.0% 3.2% 0.7% 0.5% 2.0% 2.3% 8.2% 3.8% 1.0% 4.3% 0.4% 3.2% 0.3% 1.6% 1.2%
0.3% 0.0% 0.2% 4.8% 1.4% 0.6% 1.1% 1.7% 2.9% 4.1% 1.7% 1.7% 1.3% 3.5% 0.7% 0.4% 1.6% 0% 1% 2% 3% 4% 5% 6% 7% 8% 9% 10% Iri sh Tr av el le r o f Iri sh h er ita ge Gy ps y/ Ro m a Any o the r w hi te ba ck gr ound W hi te a nd bl ac k Ca rib br an W hi te a nd bl ac k A fr ica n W hi te a nd As ia n Any o the r m ixe d ba ck gr
ound Indian
Pa ki st an i Ba ng la de shi Any o the r As ia n ba ck gr ound Bl ack Ca rib be an Bl ac k A fr ic an Any o the r bl ac k ba ck gr ound Chi ne se Any o the r et hni c g ro up Selective Schools
24
and their peers is evident during the early years and primary education. This gap is significant and grows over time. The Education Policy Institute’s Annual Report 2016 showed that, by the end of primary school, the gap between disadvantaged pupils and their peers was almost 10 months. Over half of this gap is inherited from the early years.
This has two implications for an expansion of the number grammar schools. Firstly, the pool of pupils from which they are likely to draw their pupils (those who are likely to pass the 11+) is reduced. Therefore, it might be expected that they would have, for example, fewer pupils from disadvantaged background.
Secondly, and more significantly, if considering grammar schools as a policy to increase social mobility, there are significant gaps in attainment by age 11 that an expansion of grammar schools cannot address.
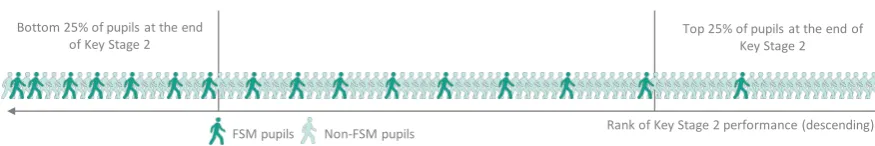
In Figure 3.3 we rank pupils in England by their performance at the end of Key Stage 2 in 2015, each figure represents around 6,000 pupils. The top quarter of the distribution is highlighted. Whilst Key Stage assessment and selective school entry tests are measuring different abilities, we use Key Stage 2 here as a proxy for those that may have been eligible for a selective school.
[image:25.595.79.517.386.459.2]We see that there are few pupils eligible for free school meals in the top part of this distribution, but they far more prevalent at the bottom of the distribution.
Figure 3.3 Distribution of Key Stage 2 attainment in 2015 by eligibility for free school meals32
Rather than compare the intake of selective schools to all other secondary schools, a more meaningful comparison may be to compare with pupils with high prior attainment.
Another factor affecting the intake of selective schools is the characteristics of the areas in which they operate. Nationally, the proportion of secondary-aged pupils eligible for free school meals is 13.2 per cent, but at schools in wholly-selective local authorities this falls to 8.9per cent.33
In the previous section we saw that pupils are far more likely to cross local authority boundaries to attend a selective school than they are a non-selective one so such differences may reflect more affluent pupils travelling to attend a selective school. Analysis of the 2015 Key Stage 4 cohort enables us to see how the demographic profile of selective schools differs from that of their neighbouring communities by comparing the profile of selective schools against pupils for whom a selective school is within a reasonable travel distance.34
In Figure 3.4 and 3.5 we examine the profile of the 2015 Key Stage 4 cohort in:
All state-funded mainstream secondary schools;
32 National Pupil Database, Key Stage 2 2015.
33 Department for Education 2016, ‘Schools Pupils and their Characteristics 2016’
34 As in Part 2 this is defined as the distance travelled by up to 90 per cent of pupils to selective schools in the
area ‘type’ – rural, town/city, conurbation – in which the school is situated.
Top 25% of pupils at the end of Key Stage 2 Bottom 25% of pupils at the end
of Key Stage 2
25
Selective schools (in both wholly and partially-selective areas);
The top 25 per cent of pupils based on their prior attainment (at Key Stage 2);
Pupils who were in the top 25 per cent of pupils based on their prior attainment and who live within reasonable travel distance of a selective school.
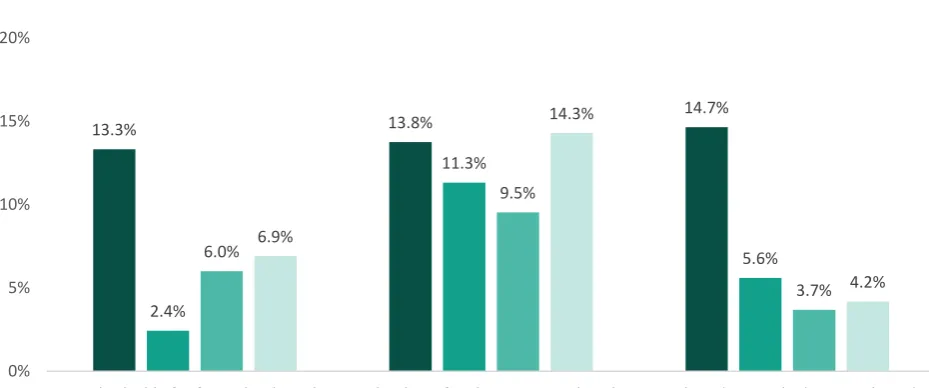
Considering first the profile of pupils with high prior attainment, we see that while some of the disparity in intakes is likely to be attributable to the variation in performance at the end of Key Stage 2, some groups remain under-represented in selective schools. Pupils eligible for free school meals are still less likely to be found in selective schools than their attainment would suggest. 5.9 per cent of high-attaining pupils at the end of primary (those in the top quarter of prior attainment) were eligible for free school meals, but the rate of FSM eligibility in selective schools is less than half of this.
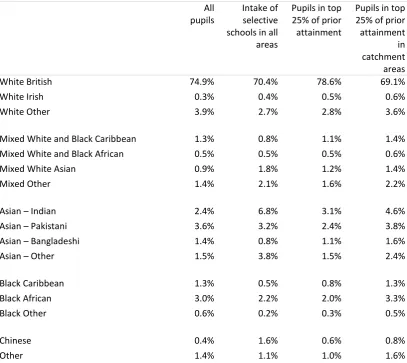
Some groups, including Indian and Chinese pupils, remain over-represented. Chinese pupils make up 1.6 per cent of the selective school population, more than twice the rate seen amongst those with high prior attainment. There are also more pupils with special educational needs in selective schools than would be suggested by the prior attainment of SEN pupils nationally – perhaps reflecting the types of special educational needs these pupils have.35
It is then possible to compare the intakes of selective schools with the demographic profile of high-attaining pupils who live within a reasonable travel distance i.e. the pupil’s location and attainment would suggest that they would be eligible to join a selective school.36
There are still disparities between the intakes of selective schools and their local areas even after restricting to pupils at the high end of prior attainment.
Pupils eligible for free school meals make up 6.9 per cent of the high-attaining group near selective schools but only 2.4 per cent of those that attend selective schools;
Black Caribbean pupils make up 1.3 per cent of the high-attaining group near selective schools but only 0.5 per cent of those that attend selective schools; and
Indian pupils make up 4.6 per cent of the high-attaining group near selective schools but
6.8 per cent of those that attend selective schools.
It is clear that, even when controlling for the areas in which they are situated and the prior attainment of pupils, there are disparities between the intakes of selective and non-selective schools. This is particularly the case for pupils from disadvantaged backgrounds.
These effects are also seen to some extent in other high-performing schools. Figure 3.6 examines the pupil characteristics of pupils in selective schools alongside pupils in top performing non-selective schools in terms of average point scores at GCSE and value added between Key Stage 2 and Key Stage 4.
35 We do not have the detailed SEN data required to test this hypothesis.
36 This is with the caveats that Key Stage attainment does not necessarily reflect the requirements of an
26
In non-selective schools in the top quarter of attainment at Key Stage 437, 7.7 per cent of the cohort
[image:27.595.79.544.174.368.2]are eligible for free school meals. This is just over half of the rate seen across all secondary schools though still three times the rate of grammar schools.
Figure 3.4: Prevalence of pupil characteristics in the 2016 Key Stage 4 cohort of selective schools38
37 Schools in the top 25 per cent as ranked by GCSE total point score. Catchment area defined as within a
reasonable travel distance
38 National Pupil Database, Key Stage 4 2015. Catchment area defined as within a reasonable travel distance
13.3% 13.8% 14.7%
2.4%
11.3%
5.6% 6.0%
9.5%
3.7% 6.9%
14.3%
4.2%
0% 5% 10% 15% 20% 25%
Pupils eligible for free school meals Pupils whose first language is other than
English Pupils with special educational needs
All pupils Intake of selective schools in all areas
27
Figure 3.5: Prevalence of ethnic groups in the 2015 Key Stage 4 cohort38
All
pupils Intake of selective schools in all areas
Pupils in top 25% of prior attainment
Pupils in top 25% of prior attainment in catchment areas
White British 74.9% 70.4% 78.6% 69.1%
White Irish 0.3% 0.4% 0.5% 0.6%
White Other 3.9% 2.7% 2.8% 3.6%
Mixed White and Black Caribbean 1.3% 0.8% 1.1% 1.4%
Mixed White and Black African 0.5% 0.5% 0.5% 0.6%
Mixed White Asian 0.9% 1.8% 1.2% 1.4%
Mixed Other 1.4% 2.1% 1.6% 2.2%
Asian – Indian 2.4% 6.8% 3.1% 4.6%
Asian – Pakistani 3.6% 3.2% 2.4% 3.8%
Asian – Bangladeshi 1.4% 0.8% 1.1% 1.6%
Asian – Other 1.5% 3.8% 1.5% 2.4%
Black Caribbean 1.3% 0.5% 0.8% 1.3%
Black African 3.0% 2.2% 2.0% 3.3%
Black Other 0.6% 0.2% 0.3% 0.5%
Chinese 0.4% 1.6% 0.6% 0.8%
28
Figure 3.6: Prevalence of pupil characteristics in the 2016 Key Stage 4 cohort of selective schools and other high-performing schools39
39 National Pupil Database, Key Stage 4 2015.
13.3% 13.8% 14.7%
2.4%
11.3%
5.6% 7.7%
13.8%
12.2% 12.6%
23.0%
14.3%
0% 5% 10% 15% 20% 25%
Pupils eligible for free school meals Pupils whose first language is other than
English Pupils with special educational needs
All pupils Intake of selective schools in all areas
29
Part 4: Attainment and progress in selective schools and
selective areas
This section presents headline performance statistics for pupils attending selective schools, and compares these with the equivalent statistics for non-selective schools, both overall and in wholly-selective, partially-wholly-selective, and entirely non-selective local authorities.40 It goes on to look at the
attainment and progress of pupils in selective and non-selective schools according to pupil
characteristics (including eligibility for free school meals, English as an additional language, special educational needs status, and ethnicity).
Such measures are used frequently by both sides of the debate on grammar schools. Those in favour will point to the high attainment of those that attend selective schools including the pupils from disadvantaged backgrounds. Those who are opposed consider the attainment of those pupils who do not make it to selective schools, including those who attend schools labelled as secondary moderns.
The headline performance of both of these groups of schools is of course strongly affected by their pupil intakes. As discussed in Part 3, selective schools have, by definition, a high level of attainment on entry. There are also groups that are either over or under-represented in selective schools even when controlling for prior attainment.
Overall attainment and progress in selective and non-selective schools
Virtually all pupils at selective schools achieve the government’s expected performance standard of five good GCSEs including English and mathematics.
In 2015, 96.7 per cent of pupils in selective schools achieved this threshold, substantially higher than the proportion of pupils that achieved it in non-selective schools, which was 56.5 per cent.
In non-selective authorities 57.3 per cent of pupils achieved the expected threshold, but this dropped slightly to 56.2 per cent in non-selective schools in partially-selective local authorities and further still to 47.7 per cent for non-selective schools in wholly-selective local authorities. A similar pattern is seen for entry to all components of the EBacc and attainment of the EBacc (see Figure 4.1) This pattern of results reflects the distribution of high-attaining pupils in these areas: the proportion of high-attaining pupils attending non-selective schools decreases as the number of available grammar school places increases.
30
Figure 4.1: Proportion of pupils attaining Key Stage 4 headline measures, by level of local selection, 2015
A similar pattern of results is seen when considering value added – i.e. performance after controlling for prior attainment. The value-added score from Key Stage 2 to Key Stage 4 for pupils in selective schools was +24.8 meaning that on average they achieved 0.5 grades higher in each of 8 GCSE subjects (see Figure 4.2).
For pupils at non-selective schools in partially-selective areas progress was slightly below average (-1.6), meaning that they achieved a quarter of a grade lower in one subject. Progress was lowest in non-selective schools in wholly-selective areas where a score of -6.7 means that pupils achieved on average one grade lower in one subject.41
So, pupils who do not attend selective schools make less progress in partially-selective and wholly-selective areas than in areas without selection.
As with overall attainment, this pattern of results will be affected by the characteristics of pupils that did and did not attend selective schools. Headline measures also mask the variation that exists between schools within each of these groups. Figure 4.3 shows the distribution of value-added scores at school level within each of these groups. Selective schools consistently have high value-added scores. Each of the other groups have high-performing schools where value value-added matches that seen in selective schools.
41 As value added is a relative measure looking at performance compared to the average it is not surprising
that the average for pupils attending schools in non-selective areas is close to zero (since this accounts for around two thirds of schools).
96.7%
77.3%
69.7%
57.3%
39.0%
23.9% 56.2%
36.4%
21.9% 47.7%
27.8%
13.3%
0% 10% 20% 30% 40% 50% 60% 70% 80% 90% 100%
5+ A*-C (GCSE or equivalent)
including English and maths Entered all components of EBacc Achieved EBacc
31
Figure 4.2: Mean value-added score from Key Stage 2 to Key Stage 4, by level of local selection, 2015
Figure 4.3: Distribution of school value-added scores at Key Stage 4 by level of local selection, 201542
Attainment gaps in selective schools and selective areas
The Education Policy Institute’s Annual Report highlighted the long standing variation in the performance of pupils from different backgrounds. Pupils from disadvantaged backgrounds tend to perform worse at the end of secondary school than their peers. The same applies to pupils from Black Caribbean, Pakistani backgrounds and those with special educational needs. Conversely, pupils from Indian and Chinese backgrounds tend to perform better than average.
In this section we consider how attainment varies by these characteristics in selective and non-selective schools and the attainment ‘gaps’ that are seen.
Pupils in selective schools achieve higher outcomes than those in non-selective schools for each characteristic, including in each ethnic group (Figure 4.4 and Figure 4.5).43 That is to say, for
42 EPI analysis of Secondary School Performance tables 2015. Vertical bars show 5th and 95th percentiles 43 There are no results recorded for pupils categorised as traveller of Irish heritage or as gypsy/Roma at
selective schools to allow for comparison with these groups at non-selective schools. +24.8
-0.3 -1.6
-6.7
-10 -5 0 5 10 15 20 25 30
All selective schools Non-selective schools in
non-selective LAs Non-selective schools inpartially selective LAs Non-selective schools inwholly selective LAs
940 960 980 1000 1020 1040 1060
Selective Schools Schools in
non-selective LAs partially selectiveNon-selective in LAs
[image:32.595.78.421.320.519.2]32
example, that pupils eligible for free school meals in selective schools achieve higher results than pupils eligible for free school meals in non-selective schools. The differences between selective and non-selective schools are particularly large for pupils of white and black Caribbean heritage, white British pupils, and pupils of any other white background.
In both selective and non-selective schools, gaps exist between the attainment and progress of pupils from different backgrounds and these reflect the patterns seen across all schools. For example, pupils that are eligible for free school meals achieve lower outcomes, on average, than their more affluent peers in both selective and non-selective schools.
33
Figure 4.4: Proportion of pupils attaining 5+ A*-C grades at GCSE or equivalent, including English and maths, and Key Stage 2-4 value added by pupil characteristics in selective schools, 2015
Achieved 5+ A*-C at GCSE or equivalent including English and maths
Entered for all components
of the EBacc the EBacc Achieved
Key Stage
2-4 'Best 8' value added
FSM 92.5% 71.6% 58.7% +11.2
non-FSM 96.8% 77.4% 69.9% +25.1
EAL 97.2% 78.7% 72.9% +39.8
non-EAL 96.6% 77.1% 69.3% +22.8
SEN 88.6% 57.8% 46.8% +7.8
non-SEN 97.1% 78.4% 71.0% +25.8
White British 96.9% 78.2% 69.6% +21.2
White Irish 99.0% 80.6% 76.5% +25.7
Traveller of Irish heritage N/A N/A N/A N/A
Gypsy/Roma N/A N/A N/A N/A
Any other white background 96.9% 81.3% 75.4% +37.9
White and black Caribbean 93.7% 75.3% 66.7% +16.7
White and black African 95.3% 83.2% 77.6% +27.7
White and Asian 97.0% 77.2% 72.9% +28.1
Any other mixed background 98.5% 76.1% 69.9% +28.3
Indian 97.8% 73.2% 68.7% +37.7
Pakistani 96.6% 69.6% 63.1% +30.6
Bangladeshi 97.6% 80.6% 72.4% +30.1
Any other Asian background 96.0% 78.7% 73.5% +41.1
Black Caribbean 92.2% 57.3% 52.4% +18.9
Black African 86.0% 69.0% 62.6% +23.0
Any other black background 92.6% 74.1% 66.7% +22.8
Chinese 97.1% 82.8% 79.1% +40.9
34
Figure 4.5: Proportion of pupils attaining 5+ A*-C grades at GCSE or equivalent, including English and maths, and Key Stage 2-4 value added by pupil characteristics in non-selective schools, 2015
Achieved 5+
A*-C at GCSE or equivalent including English and maths
Entered for all components of the EBacc
Achieved
the EBacc Stage 2-Key 4 'Best 8' value added
FSM 34.5% 22.0% 10.1% -28.6
non-FSM 60.0% 40.3% 24.8% +3.5
EAL 53.9% 41.5% 25.2% +28.6
non-EAL 56.9% 37.2% 22.4% -5.0
SEN 21.5% 11.7% 4.7% -27.9
non-SEN 62.7% 42.4% 26.0% +3.9
White British 56.7% 36.5% 22.0% -6.1
White Irish 67.7% 49.6% 32.9% +4.5
Traveller of Irish heritage 19.4% 6.2% 3.9% -92.0
Gypsy/Roma 9.0% 4.0% 1.2% -49.5
Any other white background 51.9% 40.6% 25.8% +29.9
White and black Caribbean 48.9% 31.6% 16.4% -15.2
White and black African 58.1% 40.6% 24.3% +5.9
White and Asian 65.2% 47.5% 32.0% +7.7
Any other mixed background 60.1% 45.0% 28.5% +5.8
Indian 69.5% 52.1% 35.6% +30.2
Pakistani 50.8% 36.3% 20.3% +10.0
Bangladeshi 62.2% 45.6% 28.1% +27.4
Any other Asian background 62.3% 46.7% 30.8% +35.0
Black Caribbean 46.3% 34.4% 16.0% -3.4
Black African 55.8% 42.8% 23.9% +24.5
Any other black background 47.2% 36.3% 18.9% +8.0
Chinese 73.5% 55.5% 43.7% +44.4
35
Of particular interest in the debate around the contribution that grammar schools might make in improving social mobility is the attainment gap between pupils from disadvantaged backgrounds and their peers. This relationship is complex.
[image:36.595.82.510.204.535.2]In Figure 4.6 we plot the attainment of pupils eligible for free school meals and their peers in selective schools, and then non-selective schools in areas that are wholly-selective, partially-selective or have no selection.
Figure 4.6: Proportion of pupils attaining 5+ A*-C grades at GCSE or equivalent, including English and mathematics, by FSM status and school type, 2015
The first thing to note is that the gap, as measured by percentage point difference, is smallest for pupils at selective schools and largest for pupils attending non-selective schools in non-selective local authorities. The gap between FSM pupils and their peers is 4.3 percentage points in selective schools and 25.9 percentage points in non-selective schools in non-selective local authorities. This pattern of results has been cited by proponents for an expansion in selective schools as demonstrating the impact that grammar schools can have on the performance of disadvantaged pupils. For example, the Prime Minister:
“Let us consider the impact of grammar schools. If we look at the attainment of disadvantaged and non-disadvantaged children, we see that the attainment gap in grammar schools is virtually zero, which it is not in other schools.”44
44 Questions to the Pri