International Journal of
ELECTROCHEMICAL
SCIENCE
www.electrochemsci.org
Preparation of Ag Nanowire Array Electrode by
Transplantation and its Electrochemical Activities
Chao Kong1,2, Zhong-ai Hu1,*, Hong-xiao Zhao1, Yu-ying Yang1, Xiu-li Shang1, Li-jun Ren1, Yan-peng
Wang1
1Key Lab. of Polymer, College of Chemistry and Chemical Engineering, Northwest normal University,
Lanzhou 730070, Gansu, China
2Department of Chemistry, Longdong College , Qingyang 745000, Gansu, China
*E-mail: zhongai@nwnu.edu.cn
Received: 4 November 2006 / Accepted: 6 January 2007 / Published: 1 February 2007
Ordered Ag nanowire array electrodes were prepared by transplantation, in which Ag nanowire array embedded in anodic aluminium oxide (AAO) template was transplanted onto the surface of kryptol electrode. Its morphology was observed by scanning electron microscope (SEM) and the electrochemical behaviors for methylene blue were investigated by means of cyclic voltammertry. The experimental results show that the array electrode exhibits high electrocatalytic activities of methylene blue on the Ag nanowire array electrode.
Keywords:Silver, Nanowire array electrode, Transplantation, Electrocatalytic activities
1. INTRODUCTION
Recently, electrochemist have paid attention to synthesis and study of nanoelectrode because
of their potential use in nanobiosensors [1-2], analysis of single cell [3], micro-detection and trace
detection [4], electrochemical dynamics [5-6], and electro-catalytic electrodes [7]. Applications of nano-silver and its modified electrode were also studied because silver nanomaterials have high
electrical conductions and electrocatalysis in electrochemistry.For example, Wang et al. [8] reported
that benorilate was determined by the differential pulse voltammetry using a carbon paste electrode
modified by silver nanoparticles.The silver nano-brush electrode was prepared by alumina template
Anodic aluminium oxide (AAO) membrane has uniform parallel pores and high pore density, and the pore diameter is controllable according to practical needs. Therefore, ordered uniform parallel pores of AAO template are usually used to synthesize various ordered nanostructures. Although
electrodeposition has been applied to fabricate Ag nanowire array electrodein the AAO templates, the
development of chemical deposition methods is essential to take sufficiently advantage of the AAO templates to generate nanowire array electrode. In this paper, ordered Ag nanowire arrays were generated by a confining growth of silver inside the nanochannels of AAO templates, then, by using appropriate procedures these nanowire arrays were transplanted onto the conductive substrate to assemble the Ag nanowire array electrode. Electrocatalytic activities of this nanowire array electrode for methylene blue were investigated by means of cyclic voltammertry [11], in which the nanowire array electrode was used as the working electrode.
2. EXPERIMENTAL
2.1 Preparation of Ag nanowire arrays
All of the chemical reagents used in this experiment were analytical grade. The porous AAO template was formed by a two-step anodization process as described previously by Hu et al. [12]. The
dried AAO template was immersed in a solution of AgNO3(0.02g/ml) dissolved in glycol and followed
by ultrasonic treatment for 1min and then the solution containing AAO templates was removed into a close vessel, and keep at 120°C for 24h [13], and then the sample was transferred into the vessel filled with distilled water. The fresh distilled water repetitiously replaced the old in the vessel to completely remove reaction residuals from the template.
2.2 Assembly of Ag nanowire arrays electrode
Schematic procedure of assembling Ag nanowires arrays electrode was shown in Fig.1. AAO template embedded with an array of Ag nanowires was etched in a 6 wt% phosphoric acid solution at 35°C for 30min to partially dissolve alumina film on the surface and uncover nanowires from the nanochannel of the template, then the template was fixed onto the surface of kryptol electrode using admixture of conductive carbon powers and polysulfone solution, which its geometrical area was a
0.12 cm2. Sequentially, the whole electrode was placed in 3mol/L NaOH solution to dissolve away the
remnant framework of the template. After carefully rinsing with distilled water and drying in air, the Ag nanowire arrays electrode is used as working electrode directly.
2.3 Measurements
Electrochemical experiments were carried out in a conventional three-electrode electrochemical cell by means of CHI 660B electrochemical analyzer. A platinum wire and a saturated calomel electrode (SCE) were used as counter electrode and reference electrode, respectively. The electrochemical
The morphology of the synthesized Ag nanowires was observed on a Hitachi 600 transmission electron microscopy (TEM). The samples were prepared by dropping the Ag nanowires ethanol suspension on the carbon-coated Cu grids and observed at 100 kV. X-ray diffraction (XRD)
measurement was performed by a Rigaku D/MAX2400 diffractometer with Cu-Kα radiation to
[image:3.612.140.489.185.354.2]investigate the phase structure the Ag nanowire array. SEM images of Ag nanowire arrays electrode were obtained with a JSM-6500LV electron microscope.
Figure 1. Schematic procedure of assembling Ag nanowires arrays electrode
3. RESULTS AND DISCUSSION 3.1. TEM analysis of Ag nanowire
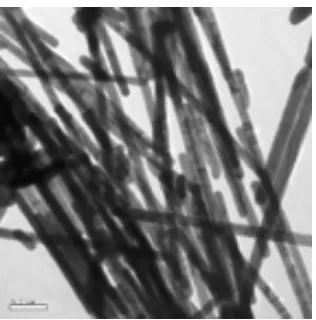
[image:3.612.228.386.507.667.2]TEM micrograph of Ag nanowire is shown in Fig.2. We can find out that the abundant and free-defect nanowires have been prepared. The diameter of the nanowires is about 60nm, and approximately equal to those of the nano-pores of AAO template used in our experiments. It is found that both temperature and reaction time are important factors in determining morphology and aspect ratios of nanowires. The lower temperature and longer time are favorable to form polycrystalline silver nanowires with high uniformity and aspect ratios. The Fig. 2 shows the results at 120°C for 24h.
3.2. XRD analysis of Ag nanowire arrays
20 30 40 50 60 70 80
(331) (220)
(200) (111)
[image:4.612.198.398.219.388.2]2Theta/degree
Figure 3. XRD spectrum of the Ag nanowire arrays
The XRD spectrum of the Ag nanowire arrays is shown in Fig. 3. It can be seen that there are four peaks in the XRD spectra of the Ag nanowire array. They are, respectively, corresponding to the (111), (200), (220), and (311) planes. All the intense XRD peaks can be indexed to the face-centered-cubic phase of silver.
3.3 SEM analysis of Ag nanowire array electrode
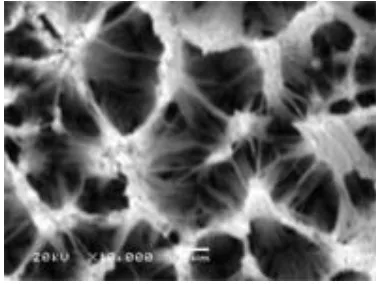
[image:4.612.211.400.552.694.2]SEM images of Ag nanowire array electrode surface are shown in Fig.4. Fig.4 shows that the Ag nanowires of electrode surface are abundant, uniform and well-ordered in the large-area. From the figures it can be estimated that the length of the Ag nanowires is more than 5µm.
3.4. Electrochemical behavior of MB+ on Ag nanowire array electrode
-0.8 -0.6 -0.4 -0.2 0.0
-0.030 -0.025 -0.020 -0.015 -0.010 -0.005 0.000 0.005 0.010
I/m
A
[image:5.612.183.434.437.626.2]E/V SCE
Figure 5. Voltammograms for a polysulfone /C electrode in 5ml 0.1mol.L-1KCl+5ml 0.05mol.L
-1phosphate buffer solution+5ml 1×10⁻⁴ mol.L-1MB+ solution obtained at 0.1 V /s. The initial potential
is 0 V and the initial scan direction is negative.
-0.8 -0.6 -0.4 -0.2 0.0
-0.08 -0.06 -0.04 -0.02 0.00 0.02 0.04 0.06 0.08
I/m
A
E/V SCE
Figure 6.Voltammograms for an Ag nanowire array electrode in 5ml 0.1mol.L-1KCl+5ml 0.05mol.L -1phosphate buffer solution obtained at 0.1 V /s. The initial potential is 0 V and the initial scan direction
Admixture of conductive carbon powers and polysulfone solution was daubed on the surface of kryptol electrode to obtain the polysulfone/C electrode. Voltammograms for a polysulfone/C electrode in the mixed solution of 5ml 0.1mol.L-1KCl, 5ml 0.05mol.L-1phosphate buffer solution and 5ml 1×10⁻⁴
mol.L-1MB+ solution at 0.1 V /s was shown in Fig.5. Voltammograms for an Ag nanowire array
electrode in 5ml 0.1mol.L-1KCl and 5ml 0.05mol.L-1phosphate buffer solution obtained at 0.1 V /s is shown in Fig.6. In Fig.5, the redox peak didn’t appear, indicating that polysulfone/C electrode have no
electrocatalysis to MB+. Fig.6 shows that the Ag nanowire array electrode is stable in the buffer
solution in the range of potential from -0.8 to 0.0 V.
Voltammograms for an Ag nanowire array electrode in the mixed solution of 5ml 0.1mol.L-1KCl,
5ml 0.05mol.L-1phosphate buffer solution and 5ml 1×10⁻⁴ mol.L-1MB+ solution obtained at 0.01 V /s
(a) and 0.1 V /s (b) are shown in Fig.7. Two cathodic (regions 1 and 2) and two anodic processes
(regions 3 and 4) are observed from Fig.7(b). The cathodic peak approximately at 0.49V is visible,
while the other peak approximately at 0.35V is unconspicuous. The anodic peaks appearing
approximately at -0.31V and -0.43 V are also unconspicuous. Fig.7(b) obviously shows that the
observed current at the peaks 1 is much smaller than the one at peak 2. It should be pointed out that the current at the peak 2 is higher than that recorded using Ag rotating disk electrode [11]. This implies that the Ag nanowire array electrode exhibits high electrocatalytic activities for methylene blue.
The widely believed reduction mechanism of MB+ to leucomethylene blue (LMB) is two
successive one electron transfers take place with a fast proton transfer from MB+ to LMB. The reaction
course is following [14-16]:
MB e MB H HMB e LMB
-0.8 -0.7 -0.6 -0.5 -0.4 -0.3 -0.2 -0.1
[image:6.612.183.433.401.658.2]-0.045 -0.040 -0.035 -0.030 -0.025 -0.020 -0.015 -0.010 -0.005 0.000 0.005 0.010 0.015 0.020 0.025 4 3 2 1 b a I/m A E/V SCE
Figure. 7. Voltammograms for the Ag nanowire array electrode in 5ml 0.1mol.L-1KCl+5ml 0.05mol.L
-1phosphate buffer solution +5ml 1×10⁻⁴ mol.L-1MB+ solution obtained at (a) 0.01 V /s and (b) 0.1 V /s.
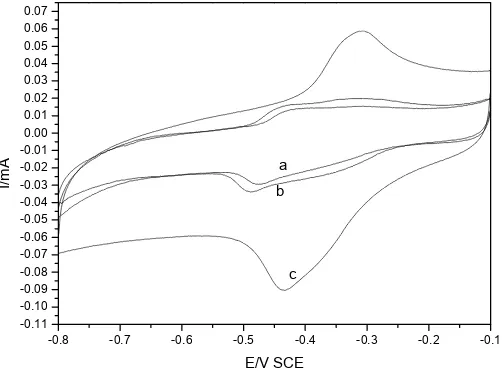
-0.8 -0.7 -0.6 -0.5 -0.4 -0.3 -0.2 -0.1 -0.11 -0.10 -0.09 -0.08 -0.07 -0.06 -0.05 -0.04 -0.03 -0.02 -0.01 0.00 0.01 0.02 0.03 0.04 0.05 0.06 0.07 c b a I/m A E/V SCE
Figure 8.Voltammograms for an Ag nanowire array electrode in 5ml 0.1mol.L-1KCl+5ml 0.05mol.L
-1phosphate buffer solution +5ml at different concentration of MB+solution obtained at 0.1 V /s. From
a to c, the concentrations are respectively 0.5×10⁻⁴ ,1×10-4 and 2×10⁻⁴ mol.L-1.The initial potential is
-0.1 V and the initial scan direction is negative.
The first cathodic peak in the voltammogram corresponds to the reduction of MB+ ion to HMB.+
and the second cathodic peak to the reduction of HMB.+ to LMB. Accordingly, the observed current at
the peaks 1 is much smaller than the one at peak 2 as shown in Fig.7(b). The anodic peaks appearing at
approximately -0.43 V and -0.31V can be assigned, respectively, to the oxidation of LMB to HMB.+
and the oxidation of HMB.+ to MB+ [11]. The redox peaks become unconspicuous in Fig.7a. These
results suggest that LMB and HMB.+ is adsorbed at electrode surface easily at a lower sweep rate.
Voltammograms for an Ag nanowire array electrode in different concentration of MB+ are shown in
Fig.8. From Fig.8, an increase in the peak current presents a direct dependence on the concentration MB+ solution. When the concentration of MB+ is up to 2×10⁻⁴ mol.L-1, the peak current of redox peak with two electron transferring increases obviously, and the peak current of redox peak with one
electron transferring disappears.In other words, the dominating redox reactions are the reduction of the
MB+ ion to LMB and the oxidation of LMB to MB+ ion.
4. CONCLUSION
A transplantation method was developed to assemble Ordered Ag nanowires arrays electrode, in which Ag nanowires arrays was fixed onto the surface of kryptol electrode using admixture of conductive carbon powers and polysulfone solution. The TEM images of Ag nanowires show that nanowires are abundant and uniform, and the diameter of the Ag nanowire about 60 nm. The data of X-ray diffraction indicate that the silver nanowire have face-centered-cubic structure. SEM images of
uniform and well-ordered in the large-area. Cyclic voltammograms exhibits high electrocatalytic activities of methylene blue on the Ag nanowires array electrode.
ACKNOWLEDGEMENTS
We gratefully acknowledge the support of this workbyProject of KJCXGC-01 of Northwest
Normal University, and major project of Gansu Science and Technology Committee (2GS035-A52-026).
References
1. Y. H. Shao, M. V. Mirkin, G. Fish et al., Anal Chem, 69 (1997) 1627. 2. X. J. Zhang, J. Wang, B. Ogorevc, et al. Electroanalysis , 11 (1999) 945.
3. C. D. Bratten, P. H. Cobbold, J. M. Cooper., .Anal Chem, 70 (1998) 1164.
4. V. P.Menon, C. R. Martin, Anal Chem., 67 (1995) 1920.
5. C. J. Slevin, N. J. Gray, J. V. Macpherson, et al. Electrochem Commun., 1 (1999) 282.
6. R. A. W. Dryfe, B. Kralj, Electrochem Commun., 1 (1999) 128.
7. R. M. Penner, C. R. Martin, Anal Chem., 59 (1987) 2625.
8. Cheng Yin Wang, Xiao Ya Hu, Talanta, 67 (2005) 625.
9. Wu Xiaodong, Li Hong, Chen Liquan, Huang Xuejie, Solid State Ionics 149 (2002) 185.
10. Dao Jun Guo, Hu Lin Li, Carbon 43 (2005) 1259.
11. Sı´lvia Helena de Araujo Nicolai, Paulo R.P. Rodrigues, Silvia M.L. Agostinho, Joel C. Rubim,
Journal of Electroanalytical Chemistry 527 (2002) 103.
12. Zhong ai Hu, Tao Xu, Ren jiang Lv, Hu lin Li, Materials Science and Engineering A 371 (2004)
236.
13. Yugang Sun, Younan Xia, Science, 298(5601) (2002) 2176.
14. R.H. Wopschall, I. Shain, Anal. Chem., 39 (1967) 1527.
15. R. Zhan, S. Song, Y. Liu, S. Dong, J. Chem. Soc. Faraday Trans., 86 (1990) 3125.
16. G.I. Pennarun, C. Boxall, D. O’Hare, Analyst 121 (1996) 1779.