www.electrochemsci.org
Electrochemical Measurements of Isopolyoxomolybdates:
1. pH Dependent Behavior of Sodium Molybdate
C. V. Krishnan1,2*, M. Garnett1, B. Hsiao2, and B. Chu2
1Garnett McKeen Lab, Inc., 7 Shirley Street, Bohemia, NY 11716-1735, USA
2Department of Chemistry, Stony Brook University, Stony Brook, NY11794-3400, USA *E-mail: [email protected] ; tel. +6315890770; fax +6315890778
Received: 11 October 2006 / Accepted: 22 November 2006 / Published: 1 Januaray 2007
MoO42- condenses on increasing acidity in aqueous solution and the extent of condensation depends on
the level of pH. Frequency response analysis in the range 1000 Hz to 35 mHz and cyclic voltammetry were used to characterize the admittance, impedance, double layer capacitance, and semiconduction behavior of different protonated mono-, hepta- and octa- isopolyoxomolybdate species in solution. It was found that the dominant species was MoO42- in the pH range 7-12 and the protonated species were
of Mo7O246- and of Mo8O264- in the pH range 3-5 and below pH 2 respectively. This observation is
consistent with the potentiometric titration data. Frequency as well as potential dependent color oscillations between blue and brown or gold at the mercury electrode were also observed. The results promise a new way of investigating polyoxometalates in solution.
Keywords: isopolyoxomolybdates, admittance, semiconduction, color oscillation
1. INTRODUCTION
A glimpse of the diversity and richness of polyoxometalate chemistry is obtained from recent reviews and books [1-8]. The oligomeric aggregates of the d0 species of Mo(VI) were formed by the bridging of molecules. The first serious attempt to characterize the different oxomolybdate species at different acidities was based on potentiometric titrations [9,10]. The general conclusion from all the studies was that in alkaline solutions the molybdate species existed only as MoO42-. At low
molybdenum concentrations, the existence of significant amounts of HMoO4- and H2MoO4 has also
been postulated [10,11] before the hepta-molybdates are formed. In the literature one can often see different and often confusing ways of writing the formula for the same species. For example, H2MoO4
has been written as Mo(OH)6 or MoO2(H2O)2(OH)2 or MoO3(H2O)3 [12] and HMoO4- has been
The convention used to indicate the number of protons involved in the formation of the appropriate species is as follows. 7 MoO42- + 8 H+ → Mo7O246- + 4 H2O so that the hepta-molybdate is indicated
as Mo7O246- (8, 7). Similarly the octa-molybdate Mo8O264- is written as Mo8O264-(12, 8) because of the
reaction 8 MoO42- + 12 H+ → Mo8O264- + 6 H2O. Thus, we follow the convention with MoO42-(0, 1),
HMoO4-(1, 1), and H2MoO42-(2, 1) for the monomers.
Ultracentrifugation studies [13] suggested an increase in polymerization when the number of protons bound per molybdenum, z, was changed from 0 to 1 with an average degree of polymerization of 6-9 when z = 1 – 1.5. Species with higher molecular masses were observed when z was > 1.5. These along with Raman spectral studies suggested hepta-molybdates at z = 1.14 and octa-molybdates at z ≈
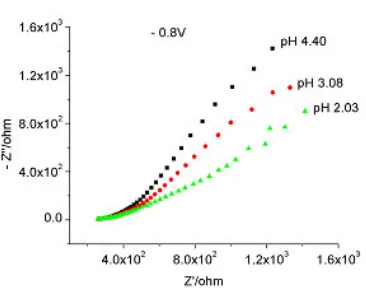
1.5. Counter ion binding studies with Na+ and Li+ were inconclusive.At very high acidities, cations,
such as MoO22+, were formed [14].
There are at least 3 forms of octa-molybdates,
α
-, β-, and γ-type, where the γ-form is an intermediate in the α⇔β inter-conversion. The α or β form of Mo8O264-(12, 8) could becrystallized from solutions of sodium molybdate in the pH range 3 – 4 by addition of organic cations [15]. All the 3 forms of octa-molybdates with disparate structures and crystals, where intermediate α -γ and β-γ forms are formed, have also been isolated [16]. In the high acid region, the formation of the large complex (34,19), and of the small HMo2O6+ (5, 2) have also been reported [9]. The largest
isopolyoxomolybdate reported [17] was Mo36O1128-(64,36) with z = 1.8.
Judging from potentiometric data, the mononuclear molybdate condensed to form the hepta-molybdate. Experimental data lacked evidence for other species with less than 7 molybdenum atoms. However spectrophotometric data in 0.1M and 1M NaCl have provided evidence [12] for the species HMo2O7- with a formation constant logβ3,2 of 14.6.
In order to carry out “rational” synthesis of novel and larger polyoxometalates systematically, one has to know the chemical nature and properties of simpler starting materials. When there are multiple equilibria involved as in the case of hydrolysis, multiple techniques that could provide more information are necessary in order to properly characterize the materials. This is evident from our studies because we can analyze the data based on several different electrochemical techniques, such as cyclic voltammetry, admittance, Nyquist and Bode plots, differential capacitance, and semi conduction.
2. EXPERIMENTAL PART
Analytical grade Na2MoO4.2H2O, 1.0 M HCl and 1.0 M NaOH were used to prepare the molybdate
solutions of varying acidities. No other background electrolyte was used for the measurements.
An EG & G PARC Model 303A SMDE tri electrode system (mercury working electrode, platinum counter electrode and Ag/AgCl (saturated KCl, reference electrode) along with Autolab eco chemie was used for cyclic voltammetric and electrochemical impedance measurements at 298 K. The solutions, about 7 mL in a minicup, were purged with N2 for about 10 minutes before each experiment.
3. RESULTS AND DISCUSSION
3.1 Cyclic Voltammetry
These measurements were made at a scan rate of 100 mV/s and the results for the third scan are shown in Figures 1 - 4. The measured pH did not correspond to the initial concentration of acid or base because of proton absorption by the molybdate species. We did not make any attempt to calculate, z, the number of moles of H+ absorbed per mole of MoO
42- from the initial concentration of H+ and the
measured pH. Our main interest was in the electrochemical investigation of large molecular clusters of polyoxometalates. The sodium molybdate concentration used in the present studies corresponded to the
Figure 1. Cyclic voltammetry of 0.095 M sodium molybdate, pH = 7-12
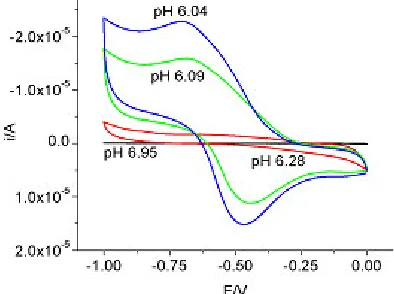
Figure 2. Cyclic voltammetry of 0.095 M sodium molybdate, pH = 6-7
molybdenum concentration used in the preparation of
(NH4)42[Mo6VIO21(H2O)6]12[Mo2VO4(CH3COO)]30·ca.300H2O·ca.10 CH3COONH4 [18] so that it
would be easier to compare the data for the complex with that of the simpler species. From the cyclic voltammograms, there were about 4 regions of similar behavior. In the pH range 7-12, as shown in Figure 1(a), there were no peaks and it corresponded to the non protonated MoO42-(0, 1). At 11.61 pH,
[image:3.612.193.390.432.579.2]this potential and high pH value. The next region with change in the voltammetric peak was in the pH range 6-7, as shown in Figure 2. This region, that could be attributed to the formation of HMoO4-(1, 1)
and H2MoO4(2, 1), corresponded to the same region in the potentiometric titrations data that were
[image:4.612.193.387.166.313.2]sensitive to the electrolyte and its concentration.
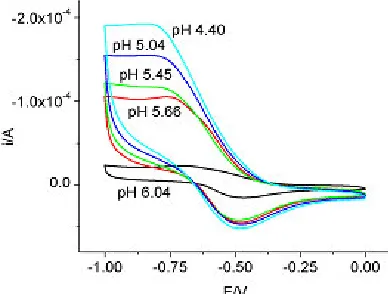
Figure 3. Cyclic voltammetry of 0.095 M sodium molybdate, pH = 4.4 - 6.0
Figure 4. Cyclic voltammetry of 0.095 M sodium molybdate at different acidities
The potentiometric data analysis using assumed species and assumed equilibrium constants indicated that hydrolysis started at approximately 0.6 pH units earlier when the Na+ concentration was changed from 0.6 to 3.0 M. Hydrolysis seemed to start when z = 8/7 = 1.14. The third region in our studies, as shown in Figure 3, was in the pH range 4-6 and corresponded to the formation of hepta-molybdate, Mo7O246- (8, 7) and their protonated species, HMo7O245-(9, 7), H2Mo7O244-(10,7), and H3Mo7O243-(11,
7). There was a disagreementas to whether H3Mo7O243-(11,7) or Mo8O264-(12, 8) was formed. Figure 4
is a summary of the pH dependence. It shows that the final change appeared below pH 3.0, corresponding to the formation of octa-molybdates, Mo8O264-(12, 8). The nature of this species in
solution could be deduced from typical potentiometric titrations [4] at constant ionic strength, as shown in Figure 5. Here z was the average number of moles of H+ bound per mole of MoO
42- in
[image:4.612.198.395.355.508.2]Figure 5. Potentiometric data for isopolyoxomolybdate species, adapted from [4], Page 140
The values of the overall (log)equilibrium constants derived from the data for β (1,1), β (2,1), (β8,7), β (9,7), β (10,7), and β (11,7) are 3.89, 7.50, 57.74, 62.14, 65.68, and 68.21, respectively [9]. From the shape and spacing of the potentiometric titration curves, Sasaki, Lindqvist and Sillen deduced that the first polynuclear complex formed was the hepta-molybdate [10]. Compared to potentiometric titration data, the cyclic voltammetric data provided clearer markings on the formation of different speciesby slight shifts in the cathodic and anodic peaks as well as differences in cathodic currents.
3.2 Frequency Response Analysis 3.2.1 Admittance
Admittance, Y, which is the inverse of impedance, is like a frequency dependent conductance. Like impedance, it has both real and imaginary parts. Since the overall admittance of parallel elements is the sum of individual admittances, admittance is a useful tool in the analysis of parallel circuits.
orientation of water molecules at the electrode double layer could contribute to the observed admittance maxima near the potential zero.
Figure 6. Admittance of 0.095 M sodium molybdate, pH 11.61
Figure 7. Admittance of 0.095 M sodium molybdate, pH 7-12
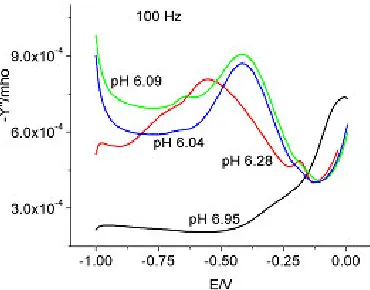
Figures 8 and 9 show the admittance data in the pH range 6 - 7 at 1000 Hz and 100 Hz respectively. The admittance decreased with decreasing pH, possibly due to the condensation of molybdate. However, the admittance behavior changed at less negative potentials. At pH 6.28, the admittance exhibited 2 peaks in the potential range 0 to – 0.25V at 1000 Hz. A broad shoulder at pH 6.95 was also indicative of the two peaks. But only one peak was observed at pH 6.09 and 6.04. Judging from the data at 100 Hz it appeared that the potential at which the peaks were exhibited was shifted to more negative potentials. There was a possibility that the protonated species of MoO42- could be responsible
[image:6.612.187.390.145.307.2]techniques used for the study of isopolyoxomolybdates. Of course, one could expect a substantial difference in interaction at and near the double layer when the species changed from MoO42- to
HMoO4- to H2MoO4 before condensation. It is well known that solute-solvent interactions between
[image:7.612.198.386.175.327.2]large univalent ions or neutral molecules and water contribute to their thermodynamic properties [22, 23].
Figure 8. Admittance for 0.095 M sodium molybdate, pH 6-7, 1000 Hz
Figure 9. Admittance for 0.095 M sodium molybdate, pH = 6 – 7, 100 Hz
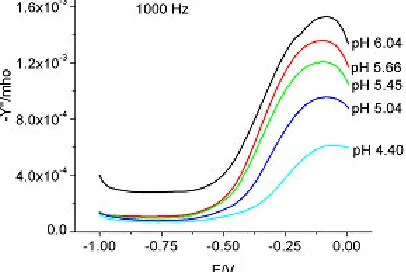
Figures 10 and 11 show the admittance data in the pH range 4 - 6 and at 1000 and 100 Hz, respectively. The admittance decreased with decreasing pH at both frequencies. While the admittance behavior at 1000 Hz was very similar, there was a pH-dependent shift in the peak of admittance at 100 Hz. Only one peak was observed at all the pH values with another shoulder for pH = 6.04 in the potential range of 0 to – 0.1V. Judging from the data at 100 Hz, as shown in Figure 11, the potential at which the peak was exhibited was shifted to more negative potentials. The continuous shift of this peak with decreasing pH strongly suggested the formation of the protonated species of Mo7O246- and that
[image:7.612.200.385.381.526.2]Judging from the sensitivity of the admittance data to frequency, water molecules could be playing a significant role in these polyoxomolybdates. It is known [24] that MoO3(OH)- expands its
coordination sphere by coordinating two water molecules to form MoO(OH)5- as a prelude to
condensation. The OH group trans to the Mo=O bond was weakly bound so that an oxo-bridge was formed by the reaction: 2[MoO(OH)5]- = [(HO)4OMo-O-MoO(OH)4]2- + H2O.
[image:8.612.199.402.169.305.2]Figure 10. Admittance of 0.095 M sodium molybdate, pH 4 – 6, 1000 Hz
Figure 11. Admittance of 0.095 M sodium molybdate, pH 4 – 6, 100 Hz
[image:8.612.204.399.341.486.2]Figure 12. Admittance of 0.095 M sodium molybdate, pH 1.37- 4.40, 1000 Hz
Figure 13. Admittance of 0.095 M sodium molybdate, pH 1.37- 4.40, 100 Hz
3.2.2 Nyquist and Bode Plots
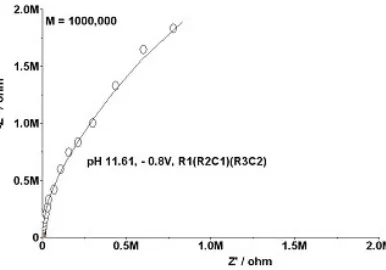
The complex plane of Nyquist or Cole-Cole plots has frequency as the only implicit variable and allows us to determine the circuit elements. The Bode plots of log Z and phase angle Φ vs. log(ω) is a better representation of the frequency variation of Z’ and Z’’. Each maximum in these graphs represents a separate relaxation process or time constant and may be associated with processes characterized by surface-state concentrations.
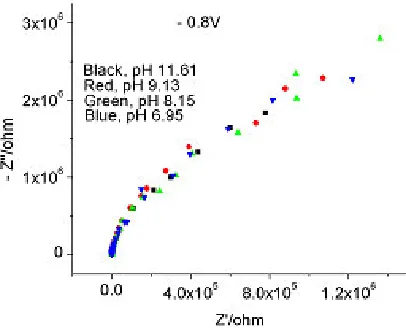
[image:9.612.209.402.554.689.2]Figure 15. Sodium molybdate, 0.095 M, pH 7 –12, – 0.8 V; Nyquist Plot
Figure 16. Sodium molybdate, 0.095 M, pH 11.61, – 0.8 V; Bode Plot
Figure 17. Sodium molybdate, 0.095 M, pH 7 –11, – 0.8 V; Bode Plot
[image:10.612.207.407.284.404.2] [image:10.612.210.409.438.578.2]better with R1(R2C1)(R3C2)(R4C3) at pH 6.95. We had observed a similar behavior at -0.6V. The data at -0.6V were almost super imposable with -0.8V data and they all fitted the equivalent circuit R1(R2C1)(R3C2). The observed phase angle was close to π/2 and was purely capacitive. These results definitely suggested that there was only one species in the pH range 7-12 and the species could be the simple MoO42-, because most of the contributions observed in these figures could be attributed
to Na+ only.
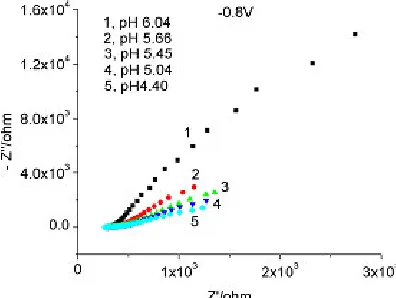
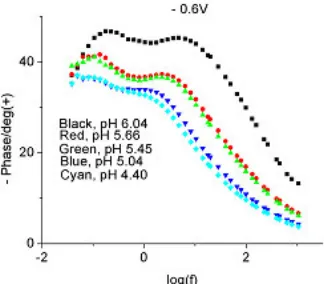
[image:11.612.196.394.321.470.2]The Nyquist and Bode plots at -0.8V and -0.6V in the pH range 4-6 are shown in Figures 18-21. For the sake of clarity, only the phase angle is shown in the Bode plots in Figures 20-21. The impedance became less and less with decreasing values in pH and the values were extremely small by a factor of about 100 when compared to the impedance values observed above pH 7. Thus, the behavior was becoming less capacitive with decreasing values in pH. Since the polarization resistance was less and less with decreasing pH, the adsorbed film should be very weak and became more and more defective or porous, permitting the electrolyte to penetrate through to the substrate. Also, the phase deviated from the purely capacitive value of /2 and the deviation increased with decreasing pH. While the phase data at -0.8V showed only one relaxation process, the one at -0.6V showed two relaxation
Figure 18. Nyquist plot for 0.095 M sodium molybdate, pH 4 – 6, – 0.8 V, 1000 Hz – 35 mHz.
[image:11.612.197.386.508.656.2]Figure 20. Bode plot (phase only) for 0.095 M sodium molybdate, pH 4 – 6, – 0.8 V, 1000 Hz –35 mHz.
Figure 21. Bode plot (phase only) for 0.095 M sodium molybdate, pH 4 – 6, – 0.6 V, 1000 Hz – 35 mHz.
processes, especially at pH values closer to 6. The distinction between the two peaks became less and less as the pH value got lower and lower, due likely to the different species present in the solution at intermediate pH values and more and more hepta-molybdate being formed at the lower pH values. The high frequency relaxation process could normally be attributed to the adsorbed film/solution interface and represented the dielectric characteristics of the adsorbed film. On the other hand, the low frequency process was normally associated with the substrate/solution interface and represented the process of localized corrosion that took place in the substrate through the pores of the film.
[image:12.612.219.381.287.429.2]voltammetric peaks at pH = 2.03, 1.65 and 1.37, where both cathodic and anodic peaks shifted towards less negative values.
[image:13.612.208.391.150.296.2]
Figure 22. Nyquist plot for 0.095 M sodium molybdate below pH 4, – 0.8V, 1000 Hz – 35 mHz.
Figure 23. Bode plot (phase only) for 0.095 M sodium molybdate below pH 4.04 and at – 0.8 V, 1000 Hz – 35 mHz.
3.2.3 Differential Capacity:
Double layer capacitance, Cdl, is generally obtained from differential capacitance measurements
when ohmic resistance is compensated. In such a case, Cdl should be independent of frequency.
The capacitance data at pH 11.61 and at different frequencies, as shown in Figure 24, are somewhat similar to that observed for NaCl. Very similar behavior was observed in the pH range 7-12 for these plots. However, Figure 24(a) for 5000 Hz, shown in an expanded window, indicated a small peak or hump at about -0.43V. This behavior was seen for other frequencies as well. At this point we could
[image:13.612.224.382.356.492.2]The capacitance data in the pH range 4-6 at 1000 and 100 Hz are shown in Figures 25 and 26 respectively. These data showed the frequency dependence of capacitance. The capacitance increased with decreasing pH values and with decreasing frequency. There was only one capacitance peak at both frequencies except for the solution at pH 6.04 where two humps were observed. Even though we observed a shift in peak potentials for different pH at 100 Hz, such behavior was not observed here, indicating the insensitivity of the capacitance peaks to protonation of the species.
Figure 24. Differential capacitance of 0.095 M sodium molybdate, pH 11.61
Figure 25. Differential capacitance of 0.095 M sodium molybdate, pH 4– 6, 1000 Hz
[image:14.612.212.376.353.474.2] [image:14.612.198.384.515.661.2]The capacitance data below pH 4 are shown in Figures 27 and 28. Here we also observed a capacitance dependence on frequency, with higher capacitance at lower frequency and the capacitance peak also shifted to much less negative potentials. Of course this was the region when octa-molybdates could be formed instead of the hepta-molybdates as indicated by the cyclic voltammetric data.
[image:15.612.207.380.209.343.2]Frequency dependence of differential capacitance has also been observed for Ag(111) in 0.01 M NaCl [25] and has been attributed to the real surface with fractal characters instead of an ideal homogeneous electrode surface.
Figure 27. Differential capacitance of 0.095 M sodium molybdate below pH 4, 1000 Hz
Figure 28. Differential capacitance of 0.095 M sodium molybdate below pH 4, 100 Hz
3.2.4 Semiconduction
Passive films on many metals and alloys exhibit semi-conductor behavior. An inner p-type oxide layer and an outer n-type hydroxide layer with a p-n hetero-junction have been suggested before [26, 27]. These passive films have characteristic capacitance that obeys the Mott-Schottky relationship. The Mott-Schottky equation that connects the space charge capacitance C of a p-type semiconductor and the electrode potential E is given as
C-2 = -[2/(qε ε
[image:15.612.208.381.394.529.2]where ε is the vacuum permittivity (8.85 x 10⁻¹⁴ F/cm), ε
0 the dielectric constant of the specimen, q
the electron charge (1.602 x 10⁻¹⁹ Coulomb), k the Boltzmann constant (1.38 x 10⁻²³ J/K), T the
absolute temperature, NA the acceptor density, and EFB the flat band potential. At room temperature,
kT/q is about 25 mV and can generally be neglected. The measured capacitance corresponds to the space charge capacitance provided that the Helmholtz capacitance and the surface state capacitance are negligible. The intercept on the potential axis gives the flat band potential. The slope of the C-2 versus
E plot is inversely proportional to the doping concentration and can be obtained provided that the dielectric constant of the passive film is known. For passive films the donor or acceptor density generally corresponds to the non-stoichiometry of the passive films, instead of the impurity concentration, and is generally much higher than the values for ordinary bulk semiconductors [27]. Also for passive films formed on metals, the linear range of the Mott-Schottky plot is usually narrow compared to the normal semiconductors [27,28].
For many metals, the passivation is due to the formation of oxide films. The growth of the oxide film is due to the migration of both the cation and O2- ion through the film under the influence of the
high electric field of about a million volts per cm. The ionic current, i, responsible for the oxide growth is related to the field strength H by the expression: i = A exp(BH), where A and B are constants that depend on the electrolyte [26].
The Mott-Schottky plot, as shown in Figure 29 at pH 11.61 indicated a p-type semiconduction behavior similar to that of NaCl [19]. The same behavior was observed in the pH range 7-12. On the other hand, the Mott-Schottky plots, as shown in Figures 30 and 31, at 1000 and 100 Hz for the pH range 4.4 to 6 indicated an n-type behavior, due to the adsorbed species of molybdenum which had a valence state different from molybdenum(VI).
Figure 29. Mott-Schottky plot for 0.095 M sodium molybdate, pH 11.61
[image:16.612.208.378.428.567.2]Figure 30. Mott-Schottky plot for 0.095 M sodium molybdate, pH 4.40 – 6.04, 1000 Hz
Figure 31. Mott-Schottky plot for 0.095 M sodium molybdate, pH 4.40 – 6.04, 100 Hz
Figure 32. Mott-Schottky plot for 0.095 M sodium molybdate, below pH 4.40, 1000 Hz
[image:17.612.205.381.96.234.2] [image:17.612.211.377.290.415.2] [image:17.612.208.392.473.601.2]Figure 33. Mott-Schottky plot for 0.095 M sodium molybdate, below pH 4.40, 100 Hz
3.3. Nature of molybdenum species
It is well known that the simple molybdate, MoO42-, condenses on acidification and the nature of
the species formed depends heavily on the concentration of acid in solution. We have discussed the nature of the molybdenum (VI) species in aqueous solutions in some detail in the introduction.
In the past, metals and alloys were efficiently protected from corrosion in extreme conditions by chromates. However, chromates are now being replaced by other inhibitors, such as molybdates because of the extreme toxicity of chromates [29]. No serious attempt has been made to elucidate the influence of the nature of the aqueous molybdate present on the inhibition of corrosion by molybdate [29-35].
In the present study, we started with molybdenum(VI). It will be an equilibrium mixture of the simple molybdate or hepta-molybdate or octa-molybdate and their protonated species depending on the pH. One or more species should dominate, depending on the pH value.
The literature data on the reduction of molybdenum species are at high concentrations of acid [36-39]. We have studied the reduction of molybdenum (VI) under mild acid conditions because of the recent work on giant polyoxometalates [18].
The cyclic voltammetric data on the nature of aqueous molybdenum species are consistent with the potentiometric titration data.
The data in the literature on the nature of the molybdenum species adsorbed on the electrode have been inconclusive. It is agreed, however, that a reduced species is adsorbed. X-ray photoelectron spectra indicated molybdenum in both 4+ and 6+ oxidation states [34]. It has also been reported that with cathodic polarization, molybdates can be in the form of many states between Mo (III) and Mo (VI) [33]. It has also been suggested [29] that cathodic polarization at -2V (standard calomel electrode) produces the unstable compound Mo(OH)3/Mo2O3. The Mo(OH)3 formation at this potential has been
attributed to the availability of OH- ions formed on the electrode surface. The reaction is
MoO42- + 8H+ +3e- → Mo3+ + 4H2O
The Mo(OH)3 compound is not stable and changes into more stable compounds by the successive
reaction [29]
Mo(OH)3 +OH-→ Mo(OH)4 (or MoO2.2H2O) + e- or
Mo3+ + 2H
[image:18.612.206.397.82.217.2]MoO2- → MoO2 + e-
It is suggested that the following reaction can also proceed successively. Mo3+ + 3H2O → MoO3 + 6H+ + 3e
-Eo = 0.317 -0.1182 pH – 0.0197 log(Mo3+).
For an assumed concentration of 10-6 M for Mo3+, E
o values of -0.99, -0.64, and -0.17V (standard
calomel electrode) have been calculated [29]. The equilibrium and potential relationships between
MoO2 and MoO3 are
MoO2 + H2O → MoO3 + 2H+ + 2e
-Eo = 0.320 – 0.0591 pH
This gives Eo values of -0.52, -0.35, and -0.11V at pH 10, 7, and 3, respectively. Based on these
assumptions, a duplex nature of MoO2/MoO3 film on aluminum was suggested. There is no reason
why such a scenario cannot hold in our present studies using mercury.
It has been observed in XPS studies that as the potential is changed to less cathodic potentials, the signal intensity dominance changed from that Mo(IV) to that of Mo(VI). If this were true, during our admittance measurements when we scanned from negative to less negative potentials, the film thickness should increase and the ratio of the duplex species could also change. Thus the two peaks observed in admittance at pH 6.28 and the shift in peak potentials we observed at 100 Hz for the pH range 4-6 might also be due to the sensitivity of the duplex adsorbed species.
However we had attributed this behavior to the change in protonation of the species in solution. This question can be resolved only if we know the redox potentials of the different protonated species at any given pH.
The aqueous chemistry of Mo(V) in solutions with hydrogen ion concentration less than 2M suggests that the monomeric green form is unstable and easily changed into a stable, yellow orange or brown colored dimeric di-µ-oxo species, Mo2O42+, with two terminal oxo groups [40-43]. The
structure suggested is
.
At acidities greater than 7M HCl, the green monomeric form is suggested [43].
Controversy also exists regarding the aqueous chemistry of Mo(IV) as to whether it is a monomer, MoO2+ or Mo(OH)
22+, or dimer, Mo2O24+ [44-46]. Monomeric Mo(IV) is viewed as a transient
intermediate species during reduction of Mo(VI) or Mo(V) and that it would disproportionate to Mo(III) and Mo(V) [46]. The red colored dimeric form is given the formula
The aqueous chemistry of Mo(III) suggests [47-49] a pale yellow monomeric MoO(H2O)5+ or
preferably Mo(H2O)63+ and a green di-µ-ol dimer, with a favored structure instead of [(H2O)5
Mo-O-Mo(H2O)5]4+.
The complicated interrelationships between the chemistry of different species of Mo (III), Mo (IV), and Mo (V) are shown in the electrochemical studies [50] of molybdenum in oxidation states III-VI in noncomplexing trifluoromethane sulfonic acid , mostly at 2 M. It shows the color of Mo (III) species as pale yellow, yellow, blue-green and green, yellow Mo (V) and pink Mo (IV). The reduction is done at -0.75 V close to our cyclic voltammetric peaks.
3.4 Color Oscillations
We had observed during cyclic voltammetry, admittance and impedance measurements that the color of the mercury drop often changed depending on the pH, or potential or frequency. Sometimes the mercury drop retained the color of the adsorbed species even after allowing the drop to fall into the bulk solution. For example, the mercury drop retained the copper red color even after the cyclic voltammetry at pH 6-4. Below pH 4, the color of the final drop was dark blue. During admittance measurements at 1000 and 100 Hz or during impedance measurements at -0.8 or -0.6V, the color changed from brass to gold to copper red at pH 6.08. But there was no color oscillation. On the other hand at pH 5.64 to pH 2, the color changed at least 4 times in the beginning one minute from yellow to gold to copper to blue and finally stayed as dark blue on the mercury. The dropped mercury retained the dark blue color. At pH lower than 2, the aqueous solution became slightly blue. At pH 1.37, dark blue material was coming out of mercury into the bulk solution.
The same interference color phenomenon has been observed at different potentials and pH for electrode systems, such as aluminum, zinc, tinplate, stainless steel or platinum, in the presence of molybdates at different pH [29-30]. As far as we know, we have, for the first time, observed a frequency dependent color oscillation for molybdates.
While studying the effect of sodium molybdate on the pitting corrosion of aluminum, it was observed [29] that polarization at -2 V produced an unstable black sluggish layer on the electrode surface which changed into brown on exposure to open atmosphere for 3-4 hours. This could be easily wiped away. However on exposure to the atmosphere for 24 hours, a blackish dark brown film that could not be washed away, was formed. The unstable compound was attributed to Mo(OH)3/Mo2O3
which was oxidized to MoO(OH)2.2H2O/MoO2. The effect of sodium molybdate on the cathodic
attractive iridescence at pH 5 to flaky black on mottled iridescence at pH 3”. The iridescent film has been attributed to Mo (V), in the form of MoO(OH)3 or Mo2O3.3H2O. Cathodic polarization of
platinum in the presence of sodium molybdate produced [33] “a lighter to medium gold coloration at pH 5 and a darker iridescent coating at pH 3”. Other colors such as purple mauve, molybdenum blue, gold with pink red, goldgrey and dark gold were also observed depending on the pH and concentration of sodium molybdate. A sequence of colored films depending on the potential has also been observed [30] during the cathodic polarization of stainless steels and platinum in the presence of sodium molybdate and sodium chloride at different pH. At pH below 2, the observed blue film was attributed to molybdenum blue, a mixture of Mo (V) and Mo (VI) species. None of these authors discussed the role of the dimers of Mo (III), Mo (IV) and Mo (V) in the formation of these different films with a variety of colors.
4. CONCLUSIONS
The cyclic voltammetric data presented here suggest that the data can be roughly divided into 4 regions: pH 7-12 where only one species is active and exhibits no redox peaks; pH 6-7 where indications of protonated monomolybdates exist with characteristic redox peaks; pH 3-6 where molybdate condensation takes place with no sensitivity of redox for protonation of the hepta-molybdates; pH below 3 where further condensation seem to take place with shifts in redox potentials sensitive to the degree of protonation.
The impedance data are analyzed in terms of admittance, Nyquist and Bode plots, differential capacitance and Mott-Schottky plots after again dividing into different regions. Each region exhibits varying characteristics. Lower frequencies tend to discriminate among different protonated species or the different adsorbed species. Mott-Schottky plots reveal a change in semiconductor behavior of the adsorbed film from p-type at pH greater than 7, to n-type at pH 7-2, and a final duplex behavior below pH 2. Apart from the previous observations of potential and pH dependent color oscillations of the reduced molybdenum species, we have also observed a frequency-dependent color oscillation.
The impedance technique seems to be a powerful tool to provide a variety of information about the nature of isopolyoxomolybdates. More information is obtained about their characteristics than from potentiometry.
ACKNOWLEDGEMENTS
BC gratefully acknowledges the support of this work by the US Department of Energy (DEFG0286ER45237.023).
References
1. M.T. Pope, Chapter 3, p. 33 in “Heteropoly and Isopoly Oxometalates”, Springer-Verlag, New York, 1983
2. C.L. Hill, Guest Editor, “ Polyoxometalates” , Chem. Rev. January-February, Vol. 98, No.1, 1998
4. L. Pettersson, p. 139 in “Polyoxometalate Chemistry for Nano-Compsite Design”, T. Yamase and M.T. Pope Editors, Kluwer Academic/Plenum Publishers, 2002
5. M.T. Pope, and A. Muller, Angew Chem., Intl. Ed. Engl., 30(1991) 34 6. C.L. Hill, C.M.P. McCartha, Coord. Chem. Rev., 143(1995) 407 7. Q. Chen, J.Zubieta, Coord. Chem. Rev., 114(1992) 107
8. T. Yamase, “Topics in Molecular Organization and Engineering 10: Polyoxometalates: From Platonic Solids to Antiretroviral Activity,” ed. by M.T. Pope and A. Muller, Kluwer Academic Publishing, Netherlands, (1994) 241
9. Y. Sasaki and L.G. Sillen, Acta Chem. Scand., 18(1964) 1014
10. Y. Sasaki, I. Lindqvist, and L.G. Sillen, J. Inorg. Nuclear Chem., 9(1959) 93 11. G. Schwarzenbach, and J. Meier, J. Inorg. Nuclear Chem., 8(1958) 302 12. J.J. Cruywagen and J.B.B. Heyns, Inorg. Chem., 26(1987) 2569
13. J. Aveston, E.W. Anacker, and J.S. Johnson, Inorg. Chem., 3(1964) 735 14. P.C.H Mitchell, Quarterly Rev. of Chem. Society, 20(1966) 103
15. M. Inoue, and T. Yamase, Bull. Chem. Soc. Jpn., 68(1995) 3055
16. R. Xi, B. Wang, K. Isobe, T. Nishioka, K. Toriumi, and Y. Ozawa, Inorg. Chem., 33(1994) 833
17. K.H. Tytko, B. Schonfeld, B. Buss, and O. Glemser, Angew. Chem. Int. Ed., 12(4)(1973) 330
18. A. Muller, E. Krickemeyer, H. Bogge, M. Schmidtmann, and F. Peters, Angew. Chem. Int. Ed., 37(1998) 3360
19. C.V. Krishnan, and M. Garnett, 226th ACS National Meeting, Abs. Inor. 0028, NY 2003 20. C.V. Krishnan, and M. Garnett, 204th Meeting of ECS, Abs. 1378, Orlando 2003
21. C.V. Krishnan, and M. Garnett, Electrochimica Acta, 51(2006) 1541
22. H.L. Friedman and C. V. Krishnan, in ‘Thermodynamics of Ion Hydration’ in “Water, A Comprehensive Treatise”, Vol.3, Chapter 1, F. Franks editor, Plenum Press, (1973) 23. R.M. Diamond, J.Phys. Chem., 67(1963) 2513
24. F.A. Cotton, and G. Wilkinson, p. 938-940 in “Advanced Inorganic Chemistry, 2nd Revised and Augmented Edition, Interscience Publishers, John Wiley & Sons, New York 1966 25. V.D. Jovic, and B.M. Jovic, J. Electroanal. Chem., 54(2003) 1
26. H. Tsuchiya, S. Fujimoto, and T. Shibata, J. Electrochem. Soc., 151(2004) B39 and references therein
27. D.S. Kong, S.H.Chen, C. Wang, and W. Yang, Corrosion Sci., 45(2003) 747 and references therein
28. N.E. Hakiki, M.D. Belo, A.M.P. Simoes, M.G.S. Ferreira, J. Electrochem. Soc., 145(1998) 3821 29. K.C. Emregul and A.A. Aksut, Corrosion Sci., 45(2003) 2415
30. J.N. Wanklyn, Corrosion Sci., 21(1981)211
31. C.B. Breslin, G. Treacy, and W.M. Carroll, Corrosion Sci., 36(1994) 1143
32. B.A. Shaw, G.D. Davis, T.L. Fritz, and K.A. Olver, J. Electrochem. Soc., 137(1990)359 33. G.D. Wilcox, D.R. Gabe, and M.E. Warwick, Corrosion Sci., 28(1988) 577
34. A. Kh. Bairamow, S. Zakipour and C. Leygraf, Corrosion Sci., 25(1985) 69 35. M.N. Hull, J. Electroanal. Chem., 38 (1972)143
36. M. Wolter, D.O. Wolf, and M.V. Stackelberg, J. Electroanal. Chem., 22(1969) 221 37. J.J. Wittick, and G.A. Rechnitz, Anal. Chem., 37(1965) 816
38. I. M. Kolthoff and I. Hodara, J. Electroanal. Chem., 4(1962) 369 39. M.G. Johnson, and R.J. Robinson, Anal. Chem., 24(1952) 366 40. M. Ardon and A. Pernick, Inorg. Chem., 12(1973) 2484
41. Y. Sasaki and A.G. Sykes, J. Chem. Soc., Dalton Trans., (1974)1968 42. J.T. Spence and M. Heydanek, Inorg. Chem., 6(1967) 1489
44. M. Ardon, A. Bino, and G. Yahav, J. Am. Chem. Soc., 98(1976) 2338
45. T. Ramasami, R.S. Taylor, and A.G. Sykes, J. Am. Chem. Soc., 97(1975) 5918 46. M. Ardon and A. Pernick, J. Am. Chem. Soc., 95(1973) 6871; 96 (1974) 1643 47. M. Ardon and A. Pernick, Inorg. Chem., 13(1974) 2275
48. A.R. Bowen, and H. Taube, Inorg. Chem., 13(1974)2245 49. K. Kustin, and D. Toppen, Inorg. Chem., 11(1972) 2851 50. P. Chalilpoyil and F. C. Anson, Inorg. Chem., 17(1978)2418