Int. J. Electrochem. Sci., 3 (2008) 1055 - 1064
International Journal of
ELECTROCHEMICAL
SCIENCE
www.electrochemsci.orgDetermination of Some Cephalosporins by Adsorptive Stripping
Voltammetry
O. A. Farghaly1,*, O. A. Hazzazi2, E. M. Rabie3 and M. Khodari3
1
Chemistry Department, Faculty of Science, Azhar University, Assiut Branch, Assiut, Egypt
2
Chemistry Department, Faculty of Applied Science, Umm Al-Qura University, P. O. Box : 2897 - Makkah, Saudi Arabia
3
Chemistry Department, Faculty of Science, South Valley University, Qena, Egypt.
*
E-mail: othman15@yahoo.com
Received: 11 May 2008 / Accepted: 18 June 2008 / Published: 4 August 2008
Cephapirin, cefamandole and cefmetazole were determined using cathodic stripping voltammetric technique by adsorptive collection on a hanging mercury drop electrode (HMDE) phosphate buffer pH 5.5 and 7 was used for cephapirin and cefamandole, while Britton-Robinson buffer pH 7 was used for cefmetazole. The adsorptive cathodic peaks were observed at - 1.46, -0.98 and -1.00 V vs. Ag/AgCl reference electrode for cephapirin, cefamandole and cefmetazole, respectively. The effect of various parameters such as pH, preconcentration time, deposition potential, supporting electrolytes, possible interferences and other variables were investigated for the examined drugs. Statistical analysis was carried out for the obtained results. Good linearity's were obtained. The proposed method was successfully applied to the analysis of the studied drugs in their available pharmaceutical formulations and in biological samples (serum and urine). The interference of some amino acids urea, ascorbic acid and some metal ions was investigated.
Keywords: Cephaprin, Cefamandole, Cefmetazole, Adsorptive stripping voltammetry
1. INTRODUCTION
Cephapirin, cefamandole and cefmetazole are cephalosporins derivatives of the first and second generation. They are closely related in structure and in their antibactericidial action mechanism to penicillins.
The aim of this work is to develop a simple electroanalytical method for determination of these drugs in pharmaceutical dosage forms and in biological fluids. The structural formulas for the studied drugs are.
Cephapirin (I)
Cefamandole (II)
Cefmetazole (III)
2. EXPERIMENTAL PART
2.1. Apparatus
The pH of the solutions was tested using a Thermo Orion Model 420 A plus digital pH-meter.
2.2. Chemicals
Cephapirin sodium salt, cefamandole and cefmetazole were obtained from Sigma-Aldrich (Steinheim Germany) and used as received without further purification. Stock solutions were prepared daily by dissolving an appropriate amounts of the drugs in double distilled water. All other solutions were prepared using double-distilled water and analytical grade reagents. Urine and serum samples from healthy volunteers were used in the analysis.
2.3. Dosage forms
Cefatrexyl vials (cephapirin sodium) were obtained from Bristol-Mayers Squibb Co., (Cairo, Egypt). Mandol vials ( cefmandole nafate) from Eli Lilly Italy S.P.A.
Figure 1. Repetitive cyclic voltammograms for 1×10⁻⁵ mol dm-3 cephapirin in phosphate buffer (pH 5.5), accumulation potential 0.0 V, scan rate 100 mV/s and 30 s deposition time.
3. RESULTS AND DISCUSSION
3.1. Cyclic Voltammetry
In the present work, the cyclic voltammetric measurements, using 30 s deposition time and 0.0, - 0.5 and - 0.65 V accumulation potential for cephapirin, cefamandole and cefmetazole respectively,
-0.8 -1.0 -1.2 -1.4 -1.6 -1.8 0
5 10 15 20
Number of cycle
3 4
2 1
I p
(
µ
Α
)
[image:3.612.148.469.325.564.2]
showed only one defined cathodic reduction peak at - 1.46, -0.98 and -1.00 V for cephapirin, cefamandole and cefmetazole, respectively. The repetitive cyclic voltammograms of 1x10⁻⁵ mol dm-3 cephapirin in phosphate buffer (pH 5.5) were shown in Fig. 1, which indicates the rapid desorption of the desorbed form in which the reduction peak current decreased sharply in the second and third cycles. A linear sweep voltammetric technique with high scan rate is preferable in such cases.
3.2. Effect of supporting electrolyte
The peak responses for the studied drugs were affected by the type of supporting electrolytes which were used. Different supporting electrolytes were examined, including: potassium chloride, sodium nitrate, sodium phosphate, borax, sodium citrate, Britton-Robinson, and phosphate buffers. The highest peak current and the best peak shape were obtained in the presence of phosphate buffer for cephapirin and cefamandole, while for cefmetazole, Britton-Robinson buffer gave the best result. The effect of pH on the peak current was examined over the range from 2 to 12. The results showed that the best peak response was observed at pH 5.5, 7 and 7 for cephapirin (Fig. 2), cefamandole and cefmetazole, respectively. Phosphate buffer pH 5.5 and 7 were used for further work for cephapirin and cefamandole, while Britton-Robinson pH 7 was sleeted for the determination of cefmetazole. The peak potential shifted to more negative values by increasing the pH (Fig. 3).
Figure 2. Influence of pH on the peak current of 1 × 10⁻⁴ mol dm-3 cephapirin, at 0.0 V deposition potential, 30 s deposition time and scan rate 100 mV/s, in phosphate buffer.
3.3. Effect of deposition potential
The effect of deposition potential on the peak current was studied over the range from 0.0 to - 1.4 V, the maximum values for the resulted peak current were 0.0, -0.5 and -0.65 V for cephapirin and
2 4 6 8 10
0 2 4 6 8
Ip
(
µ
A
)
[image:4.612.144.458.374.593.2]
cefamandole and cefmetazole, respectively, therefore these potentials were used for further investigations.
Figure 3. Influence of pH on the peak potential of 1×10⁻⁴ mol dm-3 cephapirin, at 0.0 V deposition potential, 30 s deposition time and scan rate 100 mV/s, in phosphate buffer.
Figure 4. Typical cathodic stripping voltammograms of 5×10⁻⁶ mol dm-3 cephapirin at different deposition times, scan rate 100 mV/s and preconcentration potential 0.0 V in phosphate buffer (pH 5.5).
2 4 6 8 10
-1.6 -1.5 -1.4 -1.3 -1.2 -1.1
E
(
V
)
pH
-0.8 -1.0 -1.2 -1.4 -1.6 -1.8 0
6 12 18 24 30
10 30 60 120 200 sec Deposition Time
I
(
µ
Α
)
[image:5.612.145.468.118.335.2] [image:5.612.157.474.412.650.2]
3.4. Effect of accumulation time
The influence of accumulation time on the peak height for the studied drugs was examined at different accumulation times over the range from 0.0 to 200 s. The resulted peak current increased with the increase of the accumulation time. Fig. 4 showed the resulted voltammograms for 1×10⁻⁶ mol dm-3 for cephapirin. The results were treated statistically using different regression modes (linear, power, exponential and logarithmic) to select the most suitable one for the collected results (Table1). From the obtained data the linear regression mode is the most suitable for the determination of 5×10⁻⁶-1×10⁻⁴ mol dm-3 cephapirin using accumulation time range from 1 to 30 s. On plotting the peak current (Ip)
[image:6.612.102.509.312.543.2]versus the square root of time (√t), a straight line was obtained with a correlation coefficient of 0.9917, this behavior is expected for response controlled by adsorption [16].
Table 1. Characteristics of current-time curves established using different cephapirin concentrations in phosphate buffer (5.5), scan rate of 100 mV/s and 0.0 V preconcentartion potential.
Regression mode
[Cephapirin ] mol dm-3
Deposition time range
(s)
Correlation coefficient
(µµµµA)
Slope (µµµµA/s)
Intercept (µµµµA)
Linear Y = A + Bx i.e. I = A + Bt
5×10⁻⁶ 1×10⁻⁴ 1-30 1-30 0.99454 0.99553 1.049 1.961 -0.872 7.631 Power
Y = AxB i.e. I = AtB or ln I = InA + Bt
5×10⁻⁶ 1×10⁻⁴ 1-30 1-30 0.98886 0.91731 0.441 0.150 -0.316 1.987 Exponential Y = AeBx i.e. I = AeBt or ln I= InA + Bt
5×10⁻⁶ 1×10⁻⁴ 1-30 1-30 0.99101 0.99396 0.031 0.025 0.327 1.200 Logarithmic Y = A + B lnx i.e. InI = B lnt
5×10⁻⁶ 1×10⁻⁴ 1-30 1-30 0.98886 0.91731 0.441 0.150 -0.316 1.987
3.5. Effect of scan rate
By increasing the scan rate, the peak current for 1×10⁻⁵ mol dm-3 cephapirin and cefamandole and cefmetazole increased from 25 to 150 mVs-1. At higher values the peak shape distorted. Scan rate of 100 mVs-1 was selected for further work.
On plotting Log Ip against Log V (Log scan rate) for 1×10⁻⁵ mol dm-3 cephapirin, a linear
3.6. Effect of concentration
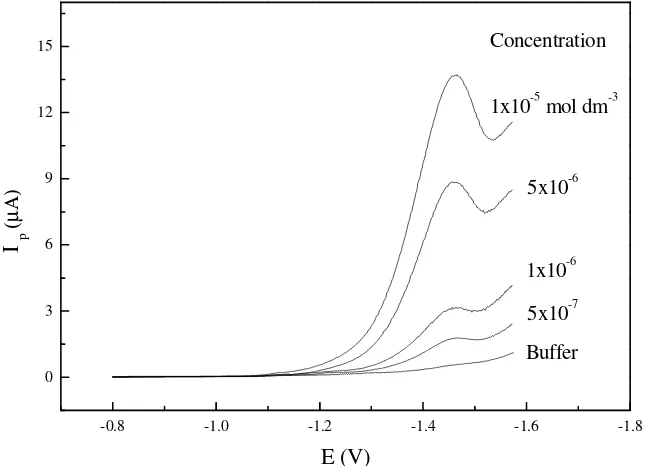
The effect of different concentrations from each drug ranged from 2×10⁻⁸ mol dm-3 to 1×10⁻⁴ mol dm-3 on the resulted peak response was studied. Fig. 5 illustrates typical voltammograms for different cephapirin concentrations, using 30s accumulation time 0.0 V depostion potential and 100 mVs-1 scan rate. An increase in the peak current with increasing the concentration, with a linear relation from 1×10⁻⁷ mol dm-3 to 1×10⁻⁵ mol dm-3, correlation coefficient of 0.998 and a slope of 0.555 were obtained.
Figure 5. Typical cathodic stripping voltammograms for different concentrations of cephapirin in
phosphate buffer (pH 5.5), accumulation potential 0.0 V and scan rate 100 mV/s, 30 s deposition time.
3.7. Validation of the method
Under the proposed experimental parameters mentioned above, the standard curves of the studied cephalosporins were established. The equation for the calibration graph Cµ = a + bc, where Cµ is the current (in µA) and c is the concentration of the studied drugs. The data obtained from the least-squares analysis are given in Table 2. The detection limits calculated as 3σ /b, where b is the slope and σ = SD of the intercept and the quantitative limits also calculated [18-26] as 10σ /b. It can be seen that cephapirin can detected at 1×10⁻⁷ mol dm-3 (correlation coefficient, R = 0.998 and n =5, LoD for cefamandole = 1×10⁻⁸ mol dm-3 (R = 0.998 and n =5), and LoD for cefmetazole = 1×10⁻⁸ mol dm-3 (R = 0.999 and n =5). The linearity is ranged from (1×10⁻⁷ to 1×10⁻⁵), (1×10⁻⁶ to 8×10⁻⁵) and (1×10⁻⁶ to 1×10⁻⁴) mol dm-3 for cephapirin, cefamandole and cefmetazole, respectively.
-0.8 -1.0 -1.2 -1.4 -1.6 -1.8 0
3 6 9 12 15
Buffer
5x10⁻⁷
1x10⁻⁶
5x10⁻⁶
1x10⁻⁵ mol dm-3
Concentration
I p
(µ
Α
)
[image:7.612.154.481.222.455.2]
Table 2. Analytical parameters of cathodic stripping voltammeter (CSV) for the determination of cephapirin, vefamandole and cefmetazole
Drug
Linearity range (mol dm-3)
Correlation coefficient (R)
Slope (nA/mol)
LoD (mol dm-3)
Cephapirin 5×10⁻⁶-5×10⁻⁴ 0.9982 0.21345 1×10⁻⁷
Cefamandole 3×10⁻⁵-5×10⁻⁴ 0.9983 5.539 1×10⁻⁸
Cefmetazole 5×10⁻⁶-5×10⁻⁴ 0.9983 4.45 1×10⁻⁸
LoD = Lower detection limit
3.8. Reproducibility
Successive measurements of 5×10⁻⁷, 1×10⁻⁵ and 5×10⁻⁷ mol dm-3 form for cephapirin, cefamandole and cefmetazole, respectively, using the optimized conditions for each drug were examined. The resulted voltammogrames showed good reproducible resets with a relative standard deviation (RSD) of 0.24, 0.36 and 0.89 % for cephapirin, cefamandole and cefmetazole, respectively.
3.9. Application
3.9.1. I- In pharmaceutical dosage forms
The developed method is applied to the determination of for cephapirin, cefamandole and cefmetazole in the commercial dosage forms in the local market. Good recoveries were obtained in all determined preparations (Table 3).
Table 3. Analytical recovery of cephapirin, cefamandole and cefmetazole from their dosage forms (n = 5).
Dosage form Claimed/ mg % recovery Cephatrexyl vial
Mandol vial
500 500
97.3 101.2
3.9.2. II- Analysis of biological fluids (serum and urine)
the resulted voltammograms were recorded. On plotting the resulted current versus the concentration, a straight lines were observed with concentrations ranged from 5×10⁻⁵-5×10⁻⁴, 9×10⁻⁵-5×10⁻⁴ and 5×10⁻⁵ -5×10⁻⁴ mol dm-3 for cephapirin, cefmandole and cefmetazole, respectively.
Cephapirin, cefamandole and cefmetazole are extracted in urine through glomerular filteration, which approximately 20 to 30% of cephapirin is rapidly metabolized to deacetylated form in the liver and about 60 to 70% of a dose is extracted in the urine [27]. Measurement of the drug in a spiked urine sample was demonstrated and the resulted voltammograms were recorded. On plotting the resulted current versus the concentration, a straight lines were observed with concentrations ranged from 5×10⁻⁶-5×10⁻⁴, 3×10⁻⁵-5×10⁻⁴ and 5×10⁻⁶-5×10⁻⁴ mol dm-3 for cephapirin, cefmandole and cefmetazole, respectively.
3.10. Interferences study
The influence of some metal ions, amino acids, urea and ascorbic acid, which are potent interfering compounds presented in biological samples on the response of the studied drugs were
[image:9.612.75.540.403.622.2]investigated. The resulted data were collected in Table 4.
Table 4. The effect of some metal ions, amino acids, urea and ascorbic acid (1×10⁻⁵ of each) on the signals for cephapirin, cefamandole and cefmetazole.
Metal ions Amino acids
Interferences
Drug
Copper (II)
%
Lead (II)
%
Cadmium (II)
%
L-alanine
%
L-valine
%
Glycine %
Urea %
L-ascorbic
acid %
Cephapirin [5×10⁻⁵ mol dm-3]
-3.3 -13.9 - 3.9 - 6.1 - 15.2 - 0.8 17.3 5.6
Cefamandole [1×10⁻⁵ mol dm-3]
-12 - 8.6 - 3.58 -- 14.3 5.9 12.3 -22
Cefmetazole [1×10⁻⁶ mol dm-3]
- 4.9 - 10.8 3.9 - 32.3 - 25.9 - 32 - 32 - 14.7
References
1. P. B. Issopoulos, Acta Pharm. Hung., 61 (1991) 205. 2. P. B. Issopoulos, Analyst, 114 (2) (1989) 237.
4. P. Gortazar, J. T. Vazquez, J. Pharm. Sci., 83 (1994) 1208.
5. A. B. C. Yu, C. H. Nightingale and D. R. Flanagan, J. Pharm. Sci., 66 (1977) 213. 6. I. Ari and N. Fredrik, Anal. Chim. Acta, 146 (1983) 87.
7. F. O. Sengun, K. Ulas, I. Frdai, J. Pharm. Biomed. Anal., 3 (1983) 191.
8. B. Ogorevc, M. R. Smyth, V. Hudnik, S. Gomicsek, Anal. Chem. Symp., Ser., 25 (1988) 403. 9. B. Ogorevc, V. Hudnik, S. Gomicsek, Z. Fresenius Anal. Chem., 330 (1988) 59.
10.S. Altinoz, A. Temizer, J. Pharm. Sci., 79 (1990) 351. 11.S. Altinoz, A. Temizer, S. Beksac, Analyst, 115 (1990) 873.
12.B. Ogorevc, A. Krasna, V. Hudnik, S. Gomicsek, Microchim. Acta, 1 (1991) 131. 13.N. Abo El Maali, A. M. Ali, M. A. Ghandou, Electroanalysis, 5 (1993) 599. 14.E. Bishop, W. Hussein, Analyst, 109 (1984) 913.
15.United States Pharmacopeia 25 and Nf 20, American Pharmaceutical Associations, Washington, DC (2002).
16.P. Delahay and C. A. Fike, J. Am. Chem. Soc., 80 (1958) 2628. 17.J. Wang, M. Shan Lin and V. Villa, Analyst, 112 (1987) 247. 18.O. A. Farghaly, Microchemical Journal, 75 (2003) 119. 19.O. A. Farghaly, Talanta, 64 (2004) 497.
20.O. A. Farghaly, J. Pharm. Biomed. Anal., 23 (2000) 783.
21.A. M. M. Ali, O. A. Farghaly, M. A. Ghandour, Anal. Chim. Acta, 412 (2000) 99.
22.O. A. Farghaly, H. M. Abd El-Wadood, M. A. Ghandour, J. Pharm. Biomed. Anal., 21 (1999) 233. 23.O. A. Farghaly, N. A. Mohamed, Talanta, 62 (2004) 531.
24.O. A. Farghaly and M. A. Ghandour, Environmental Research, 97 (2005) 229.
25.M. A. Ghandour, Ensaf Aboul Kasim, A. H. Amrallah, O. A. Farghaly, Talanta, 41 (1994) 439. 26.O. A. Farghaly, M. A. Ghandour, Talanta, 49 (1999) 31.
27.S. C. Sweetman, Martindale, The complete Drug Reference, Pharmaceutical Press, UK, 2002.