Int. J. Electrochem. Sci., 6 (2011) 4690 - 4699
International Journal of
ELECTROCHEMICAL
SCIENCE
www.electrochemsci.org
Determination of Trace Copper in Water Samples by Anodic
Stripping Voltammetry at Gold Microelectrode
Jianmei Zhuang1, Li Zhang2,3, Wenjing Lu2,3, Dazhong Shen1, Rilong Zhu4, Dawei Pan2,*
1
The Key Lab in Molecular and Nano-materials Probes of the Ministry of Education of China, College of Chemistry, Chemical Engineering and Materials Science, Shangdong Normal University, Jinan 250014, P.R. China
2
CAS and Shandong Provincial Key Laboratory of Coastal Zone Environmental Processes, Yantai Institute of Coastal Zone Research, Chinese Academy of Sciences, Yantai 264003, P.R. China 3
Graduate School of the Chinese Academy of Sciences, Beijing 100039, P.R. China 4
Hunan Province Environmental Monitoring Centre, Changsha 410014, P.R. China *
E-mail: [email protected]
Received: 7 June 2011 / Accepted: 8 September 2011 / Published: 1 October 2011
The applicability of gold microelectrode of 25 m diameter for electrochemical determination of trace copper ions (Cu2+) in water samples by anodic stripping voltammetry (ASV) has been demonstrated. The analysis of Cu2+ at gold microelectrode includes two steps. Cu2+ ions are firstly reduced and accumulated on the microelectrode surface during an accumulation step, then oxidized during the positive potential sweep. Due to the rapid mass transporting and low background current of gold microelectrode, low detection limit (0.3 nM) and wide linear range (1.0-90 nM) can be obtained. The practical application of gold microelectrode was verified by determination of trace level of Cu2+ in tap water, lake water and commercial drinking water samples.
Keywords: Gold microelectrode, Copper, Anodic stripping voltammetry, Water samples
1. INTRODUCTION
Well-established measurements for determination of Cu2+ have been reported [7-11], including spectrophotometry, solid-phase extraction, atomic absorption spectroscopy, X-ray fluorescence and inductively coupled plasma mass spectrometry (ICP-MS), etc. However, most of these methods need not only expensive equipments but also time-consuming pretreatments [12]. Electrochemical analysis based on anodic stripping voltammetry (ASV) is a proper method for the trace analysis of heavy metals [13, 14]. ASV measurement is based on relatively cheap and portable equipment and the analysis time of it is much shorter than the other methods such as ICP-MS. ASV measurement also allows to monitor low concentration of metals by electrochemical accumulation of the metal on the electrode surface [15-17]. In the past, mercury hanging or dropping electrodes have been widely used for ASV due to their easy formation of amalgam with reduced metal, excellent reproducibility and easy surface renewal [18, 19]. However, because of its serious toxicity, the use of mercury can cause severe environmental and health problems [20]. Ordinary electrochemical solid electrodes have been developed for Cu2+ determination, such as modified carbon past electrodes [21], modified conducting copolymer electrodes [22], self-assembled monolayer modified gold electrodes [23]. But the detection limits of those chemically modified electrodes were not low enough to detect trace level of Cu2+ in water samples. Thus, new alternative electrodes are highly desired to meet the growing demands of determination of Cu2+ in environmental monitoring and water research.
In recent years, the development of microelectrodes has received considerable attention and the domain of their electrochemical applications has been widened. Microelectrodes are devices with a critical dimension smaller than the thickness of the Nernst diffusion layer. Accordingly, they possess several characters such as rapid mass transporting, enhancement of signal-noise ratio and low background current [24, 25]. Electrochemistry experiments can be performed at very small volumes when small size microelectrodes have been involved [26, 27]. Microelectrodes have been used to detect Cu2+ in human sweat and ethanol fuel samples [28, 29].
In this work, a gold microelectrode was employed to detect Cu2+ by differential pulse anodic stripping voltammetry (DPASV) in environmental water samples. Due to the excellent properties of microelectrode, low detection limit and wide linear range can be obtained. Additionally, experimental parameters, including the pH value of the supporting electrolyte, the accumulation potential and the accumulation time have been investigated in detail. The practical application of gold microelectrode has been carried out for determination of Cu2+ in tap water, lake water and commercial drinking water samples.
2. EXPERIMENTAL
2.1. Reagents
without further purification. Deionized water (18.2 M cm specific resistance) obtained with a Pall Cascada laboratory water system was used throughout.
2.2. Apparatus
All electrochemical measurements were performed with a LK2006 electrochemical workstation (LK Chemical Electronic High Technology Co., Ltd, China). The measurements were performed in a 10 mL electrochemical cell.
A gold microelectrode of 25 m diameter (CH Instruments Inc., China) was used as the working electrode. A platinum electrode and an Ag/AgCl (3 M KCl) electrode were used as the counter electrode and reference electrode, respectively. All potential values given below refer to reference electrode. All the electrochemical experiments were carried out at room temperature. The UV digestion was performed using a 705 UV digestor (Metrohm AG, Switzerland). ICP-MS measurements were performed using an Elan Drc II inductively coupled plasma mass spectrometer (PerkinElmer, USA).
2.3. Sample preparation
The tap water, lake water and drinking water samples were collected from local. The tap water and drinking water were acidified to pH 2 using HNO3.
The lake water was fist filtered through a standard 0.45 m filter and acidified to pH 2. Subsequently, the lake water was UV digested in 10 ml quartz tube for 30 min in the presence of H2O2 to destroy the natural organic matter. All water samples were stored at -4C in acid-cleaned HDPE sample bottles.
2.4. Analytical procedure
Before each measurement, the surface of the microelectrode was mechanically polished with alumina powder (0.3 and 0.05 m) on a microcloth polishing pad and then rinsed by ethanol and deionized water thoroughly. After that, the microelectrode was activated in 0.5 M H2SO4 by cyclic voltammetric sweeping from -0.15 V to 1.5 V at a scan rate of 50 mV s-1.
The stripping analysis of Cu2+ has two main steps including accumulation and stripping out. Cu2+ ions were first reduced to Cu under −0.4 V for a desired time onto the gold microelectrode. In the following step, the reduced Cu was oxidized at 0.28 V during the potential sweeping from 0 to 0.6 V. The stripping peak current was measured for Cu2+ quantification. Prior to the next measurements, the microelectrode was activated at 0.6 V for 30s in the supporting electrolyte to remove the previous deposit completely.
3. RESULTS AND DISCUSSION
3.1. Voltammetric behaviors of Cu2+ at the gold microelectrode
Figure 1 shows the cyclic voltammograms recorded at the gold microelectrode from -0.2 to 0.6 V in 0.2 M KNO3 solution containing 1.0 mM potassium ferricyanide.
E / V
-.2 0.0 .2 .4 .6
i /
nA
-2.4 -1.8 -1.2 -.6 0.0 .6
Figure 1. Cyclic voltammograms recorded at the gold microelectrode in 0.2 M KNO3 containing 1.0 mM K3[Fe(CN)6]. Scan rate, 50 mV s-1.
The voltammogram of the gold microelectrode exhibits the typical sigmoid shape, indicating the predominance of radial diffusion to electrode surface [30]. Due to the micro-size effect, an enhanced mass transport can be obtained at microelectrode rather than traditional electrode, which results in the improved signal-to-noise ratio and low analytical detection limit [31-33]. Accordingly, the microelectrode has great potential for determination of trace heavy metals.
[image:4.596.156.444.198.463.2]
E / V
.24 .30 .36 .42 .48
i /
nA
-.1 0.0 .1 .2 .3
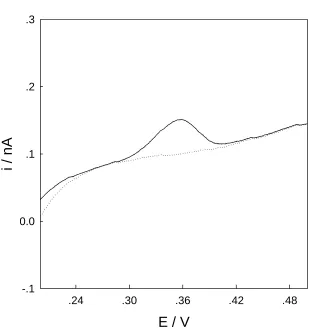
Figure 2. Linear sweeping voltammograms recorded at the gold microelectrode in HNO3 (pH 2) solution with (solid line) and without (dashed line) 1.0 M Cu2+. Scan rate, 50 mV s-1.
3.2. Optimization for determination of Cu2+ at the gold microelectrode
In order to establish the most suitable experimental conditions for the anodic stripping voltammetric determination of Cu2+ at the gold microelectrode, optimization studies about the pH value of the supporting electrolyte, the accumulation potential and the accumulation time were investigated in detail.
3.2.1. Effect of pH value of the supporting electrolyte
[image:5.596.138.450.81.410.2]
3.2.2. Effect of accumulation potential
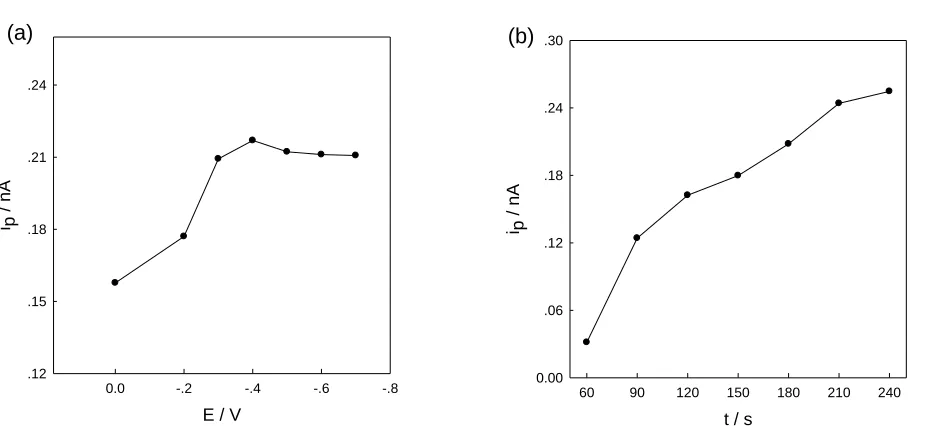
The effect of the accumulation potential on the stripping peak current of 30 nM Cu2+ was examined over the potential range of -0.7 to 0 V.
E / V
-.8 -.6
-.4 -.2
0.0 i p
/
nA
.12 .15 .18 .21 .24
(a)
t / s
60 90 120 150 180 210 240
i p
/
nA
0.00 .06 .12 .18 .24 .30
(b)
Figure 3. Effect of (a) accumulation potential and (b) accumulation time on the stripping peak current of 30 nM Cu2+. Amplitude, 0.05 V; pulse width, 0.1 s; pulse interval, 0.1 s; quiet time, 10 s.
As shown in Figure 3 (a), the stripping peak current increased sharply with changing potential from 0 to -0.4 V, probably due to the fact that Cu2+ can be reduced more efficiently at more negative accumulation potentials. The stripping peak current did not change significantly at a potential more negative than -0.4 V, which is mainly attributed to the complete reduction of Cu2+ in the solution to the gold microelectrode during the certain accumulation time. So, -0.4 V was chose as the optimum accumulation potential in the following measurements.
3.2.3. Effect of accumulation time
[image:6.596.66.536.161.374.2]
3.3. Calibration curve
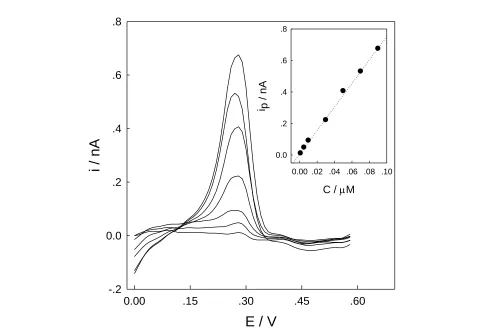
The calibration curve for determination of Cu2+ was derived from the differential pulse stripping voltammetric curve obtained at the gold microelectrode and the corresponding results are shown in Figure 4.
E / V
0.00 .15 .30 .45 .60
i / nA
-.2 0.0 .2 .4 .6 .8
C / M
0.00 .02 .04 .06 .08 .10
i p /
nA
[image:7.596.51.548.170.503.2]0.0 .2 .4 .6 .8
Figure 4. Anodic stripping differential pulse voltammograms of gold microelectrode in HNO3 (pH 2) containing various concentration of Cu2+. The values for the curves are 1, 5, 10, 30, 50, 70, 90 nM from bottom to top, which are in the linear rang. Accumulation potential, −0.4 V; accumulation time, 210 s and other conditions are the same as in Fig. 3. The inset is the calibration plot calibration curve of Cu2+ obtained at the gold microelectrode.
From Figure 4, for 210 s accumulation, a proportional relationship between the stripping peak current and the concentration of Cu2+ was obtained in the range of 1.0 to 90 nM (ip 7.5C0.01, ip in nA, C in M) with a linear correlation coefficient of 0.9976. The sensitivity was found to be 7.5 nA/M. The detection limit calculated at S/N= 3 was 0.3 nM, which was lower than those obtained at carbon paste electrode [35], poly(vinyl) chloride membrane copper-selective electrode [36], 4-carboxyphenyl-grafted screen printed electrode [37].
of 5.1% and 3.2%, respectively. Low detection limit, wide linear dynamic range and excellent reproducibility and repeatability may attribute to the excellent and unique properties of the gold microelectrode.
3.4. Determination of copper in real water samples
In order to verify the accuracy of the proposed method, the gold microelectrode was used to detect Cu2+ in China National Standard Substance (GBW080080, trace heavy metals containing Cu2+, Pb2+, Zn2+, Cd2+,Ni2+ in water). The National Standard Substance was diluted to 1000 multiples and acidified to pH 2 using HNO3. The concentration of Cu2+ was detected to be 15.20.1 nM (n=3), which agreed well with the nominal value of Cu2+ in GBW080080 (15.6 nM). These indicated the gold microelectrode has good anti-interference and can be used in determination of Cu2+ in real samples.
On the other hand, to illustrate the application of gold microelectrode in real practical analysis, the trace concentration of Cu2+ was detected at the gold microelectrode in tap water and lake water samples by the standard addition method and the results were shown in Table 1.
Table 1. Comparison of the gold microelectrode and ICP-MS for determination of Cu2+ in real water samples
Sample Detected by gold microelectrode
(nM)*
Detected by ICP-MS (nM )
Tap water 12.70.4 13.8
Lake water 21.81.0 22.3
Note: *Average value of three determinations standard deviation.
From Table 1, the results obtained at the gold microelectrode showed good agreement with those obtained by ICP-MS measurements. Additionally, the gold microelectrode was also employed to detect Cu2+ in the commercial drinking water. But the concentration of Cu2+ in the commercial drinking water can not be detected due to the rather low concentration of Cu2+. The recovery experiments were carried out and the results were varied between 93.4% and 95.7%, indicating the potential application of this microelectrode in real water sample analysis with a high accuracy and good reliability.
4. CONCLUSIONS
the signal-to-noise ratio and the precision of the measurements. The practical analytical utility of the gold microelectrode was assessed by measurements of tap water and lake water samples and the results were in agreement with the results from ICP-MS. Due to its cheap cost, easy fabrication and excellent electrochemical properties, the microelectrode has great potential in rapid, on-site voltammetric determinaton of Cu2+ or other heavy metals in environmental monitoring. Our following work is to detect heavy metals in sea water by using modified microelectrode.
ACKNOWLEDGEMENTS
This work was financially supported by the National Natural Science Foundation of China (21007087, 20975062), the Chinese Academy of Sciences (KZCX2-YW-JS208), the Natural Science Foundation of Shandong Province (2008ZRA06004, BS2010HZ030) and the Science and Technology Development Project of Yantai City (2009164).
References
1. S.A.M. Fathi, M.R. Yaftian, J. Hazard. Mater., 164 (2009) 133.
2. T.G. Kazi, N. Jalbani, N. Kazi, M.K. Jamali, M.B. Arain, H.I. Afridi, A. Kandhro, Z. Pirzado, Renal. Fail., 30 (2008) 737.
3. M. Soylak, O. Ercan, J. Hazard. Mater., 168 (2009) 1527. 4. E. Kendüzler, A.R. Türker, Anal. Chim. Acta, 480 (2003) 259.
5. N.N. Greenwood, A. Earnshow, Chemistry of the Elements (Pergamon, New York, 1984). 6. P. Liang, J. Yang, J. Food Compost. Anal., 23 (2010) 95.
7. J.L. Brasil, L.C. Martins, R.R. Ev, J. Dupont, S.L.P. Dias, J.A.A. Sales, C. Airoldi, E.C. Lima, Int. J. Environ. Anal. Chem., 85 (2005) 475.
8. Ş. Tokalıoğlu, F. Gürbüz, Food Chem., 123 (2010) 183.
9. X.D. Zhu, H.D. Liang, S.L. Zhao, H. Yan, D.L. Han, Int. J. Environ. Anal. Chem., 88 (2008) 689. 10. L.S.G. Teixeira, R.B.S. Rocha, E.V. Sobrinho, P.R.B. Guimarães, L.A.M. Pontes, J.S.R. Teixeira,
Talanta, 72 (2007) 1073.
11. S. Mol, Food Chem. Toxicol., 49 (2011) 348.
12. P.J. Chapman, Z. Long, P.G. Datskos, R. Archibald, M.J. Sepaniak, Anal. Chem., 79 (2007) 7062. 13. E.A. McGaw, G.M. Swain, Anal. Chim. Acta, 575 (2006) 180.
14. S.E.W. Jones, F.G. Chevallier, C.A. Paddon, R.G. Compton, Anal. Chem., 79 (2007) 4110. 15. M. Javanbakht, F. Divsar, A. Badiei, F. Fatollahi, Y. Khaniani, M.R. Ganjali, P. Norouzi, M.
Chaloosi, G.M. Ziarani, Electrochim. Acta, 54 (2009) 5381. 16. A.Crew, D.C. Cowell, J.P. Hart, Talanta, 75 (2008) 1221.
17. V. Rehacek, I. Hotovy, M. Vojs, F. Mika, Microsyst. Technol., 4 (2008) 491.
18. T. Nedeltcheva, M. Atanassova, J. Dimitrov, L. Stanislavova, Anal. Chim. Acta, 528 (2005) 143. 19. J. Wang, J. Lu, S.B. Hocevar, P.A.M. Farias, Anal. Chem., 72 (2000) 3218.
20. G.P. Guzzi, C.A.M. La Porta, Toxicology, 244 (2008) 1.
21. I.Cesarino, G. Marino, J.R. Matos, E.T.G. Cavalheiro, Talanta, 75 (2008) 15. 22. M. Lin, M. Cho, W.S. Choe, Y. Son, Y. Lee, Electrochim. Acta, 54 (2009) 7012. 23. A.Mohadesi, M.A. Taher, Talanta, 72 (2007) 95.
24. X.D. Xie, D. Stüben, Z. Berner, Anal. Lett. 38 (2005) 2281.
25. J. Buffle, M.L. Tercier-Waeber, Trends Anal. Chem., 24 (2005) 172. 26. R. Kashyap, M. Gratzl, Anal. Chem., 70 (1998) 1468.
27. B.A. Grzybowski, R. Haag, N. Bowden, G.M. Whitesides, Anal. Chem., 70 (1998) 4645.
29. R.M. Takeuchi, A.L. Santos, M.J. Medeiros, N.R. Stradiotto, Microchim. Acta, 164 (2009) 101. 30. M.K. Wang, F. Zhao, Y. Liu, S.J. Dong, Biosens. Bioelectron., 21 (2005) 159.
31. O. Ordeig, C.E. Banks, J. del Campo, F.X. Muñoz, R.G. Compton, Electroanalysis, 18 (2006) 573. 32. Y. Zhang, H. Wang, J.F. Nie, Y.W. Zhang, G.L. Shen, R.Q. Yu, Biosens. Bioelectron., 25 (2009)
34.
33. X.J. Huang, A.M. ÒMahony, R.G. Compton, Small, 5 (2009) 776. 34. P.J. Meng, J.T. Wang, Chin. Sci. Bull., 55 (2010) 140.
35. A.M. Beltagi, E.M. Ghoneim, M.M. Ghoneim, Int. J. Environ. Anal. Chem., 91 (2011) 17. 36. M.N. Kopylovich, K.T. Mahmudov, A.J.L. Pombeiro, J. Hazard. Mater., 186 (2011) 1154. 37. S. Betelu, C. Vautrin-Ul, A. Chausse, Electrochem. Commun., 11 (2009) 383.
![Figure 1. Cyclic voltammograms recorded at the gold microelectrode in 0.2 M KNO3 containing 1.0 mM K3[Fe(CN)6]](https://thumb-us.123doks.com/thumbv2/123dok_us/1938934.153778/4.596.156.444.198.463/figure-cyclic-voltammograms-recorded-gold-microelectrode-kno-containing.webp)