The competitiveness of European industry
1999 Report
The competitiveness of
European industry
7999
Report
Working document of the services of the European Commission
Preceded by the Commission Communication of 6 October 1999 on structural change and
adjustment in European manufacturing COM( 1999) 465
This report has been prepared by the Enterprise Directorate-General of the European Commission, with the assistance of a scientific committee, composed of Pierre Buigues, Steve Davies, Pierre Defraigne, Ioannis Ganoulis, Paul Geroski, André Sapir and Leo Sleuwaegen.
A great deal of additional information on the European Union is available on the Internet. It can be accessed through the Europa server (http://europa.eu.int).
Cataloguing data can be found at the end of this publication.
Luxembourg: Office for Official Publications of the European Communities, 1999. ISBN 92-828-7647-0
© European Communities, 1999
Reproduction is authorised provided the source is acknowledged.
Printed in Belgium
Table of Contents
List of abbreviations
Introduction 1
PART ONE
ADAPTABILITY AND STRUCTURAL CHANGE IN EUROPEAN MANUFACTURING
Chapter 1 - Statistical overview by Member State and industrial sector, 1988-1998
1. The aggregate picture 7 2. Comparisons across the Member States 8
3. Growth of industrial sectors 9 4. Variability of growth rates between sectors and Member States 10
5. The theory 10 6. Previous empirical studies 11
7. Defining and measuring specialisation and concentration 12
Chapter 2 - Specialisation of European manufacturing
1. A weak overall tendency to an increasing production specialisation 15 2. A weak overall tendency for export specialisation to decrease 16
3. Individual countries in more detail 16
4. Summary 19
Chapter 3 - Geographic concentration of industries
1. An overall tendency towards de-concentration 21
2. Convergence across industry types 23 3. The core-periphery pattern 25 4. Income, country size and the North-South pattern 26
5. Influence of other detenninants 27
6. Summary 28
Chapter 4 - The impact of structural change on competitiveness
1. Recalling the advantages and disadvantages of specialisation and concentration 31
2. Speed of change and growth, compared across Member States 32
3. Is the speed of change increasing? 33
4. Summary 33
Chapter 5 - Main findings and policy implications
1. Background and results 35 2. Policy implications 37 References for Part One 37
PART TWO
PRIME FORCES OF STRUCTURAL CHANGE
Chapter 1 - Physical investment in Europe
1. Investment trends in the economy and in manufacturing 41 2. Investment in manufacturing: specialisation and concentration 45
3. Investment determinants: some empirical results 49
4. Conclusions 52 References 52
Chapter 2 - Intangible investment and structural patterns of European manufacturing industry
1. Performance by industry types 56 2. Intangibles, skills and industry specialisation in the Member States 60
3. Policy conclusions 62
References 64
Chapter 3 - Competitiveness, restructuring and firm location flexibility
1. Industry dynamics and the location of economic activities 67
2. Spatial networks of multinational enterprises 68
3. Relocation in two types of networks 70 4. Operating flexibility 71
5. Further locational implications 73
6. Conclusions 74 References 75
PART THREE
THE SENSITIVITY OF EUROPEAN INDUSTRY TO EXTERNAL SHOCKS
Chapter 1 - The impact of the financial and economic crisis in Southeast Asia on European industries
1. Background to the crisis in Emerging Markets 83 2. Impacts of the crisis on global trade and growth 84 3. The composition of EU trade with emerging markets 85 4. The impact of the crisis on aggregate European trade 86 5. The impact of the crisis by manufacturing industry 87
6. The impact of the crisis by Member State 95
7. Conclusions 98 References 99
List of abbreviations
bn billion
CEEC Central and Eastern European Countries
COMEXT Eurostat, New Cronos (external trade -COMmerce EXTéiïeur- database) CR3(5) Concentration Ratio referred to the largest 3(5) industries/countries DEBA Eurostat, New Cronos (Data on European Business Activity) EFTA European Free Trade Area
EITO European Information Technology Organisation EM Emerging Market
EOS Economies Of Scale EU European Union
FDI Foreign Direct Investment GDP Gross Domestic Product GFCF Gross Fixed Capital Formation GNP Gross National Product
ICT Information and Communication Technologies IT Information Technologies
n.a. not available
MES Minimum Efficient Scale mio million MNE Multinational Enterprise p.a. per annum
PPP Purchasing Power Parity R&D Research and Development RCA Revealed Comparative Advantage
SBS Eurostat, New Cronos (Structural Business Statistics database) SME Small- or Medium-sized Enterprise
SR Specialisation Rate
STAN OECD, DSTI (STAN industrial database), 1998 USA United States of America
STRUCTURAL CHANGE AND ADJUSTMENT
IN EUROPEAN MANUFACTURING
Communication from the Commission to the Council, to the European Parliament,
to the Committee of the Regions and to the Economic and Social Committee
COM(1999) 465
(Presented by Mr. Erkki LIIKANEN, Member of the Commission)
Introduction
In its resolution of the 21st November 1994 on
reinforcing European competitiveness, the Council invited the Commission to report regularly on the competitiveness of European industry.
This Communication summarises the main findings of the 1999 Competitiveness Report1 and aims to
stimulate the debate on the adaptation of European industry to the new conditions resulting from increasing competition both within and outside the European Union.
The 1999 Competitiveness Report is the third one issued after the Council resolution. It deals with structural change in the EU economy, focusing on the presentation and analysis of sectoral data on manufacturing.
The choice of emphasis on manufacturing and the use of country-level, rather than regional, information are imposed by data availability.
Adaptability: key to competitiveness
The competitiveness of a country is essential for the welfare of its citizens. It means output growth and high rates of employment in a sustainable environment. In a fast-moving world economy, one of the keys to competitiveness is adaptability. An economy is adaptable if it can accumulate and re-deploy resources rapidly in pursuit of new opportunities, while, at the same time, fully exploiting existing competitive strengths. Adaptability is crucial not only for the growth prospects of a country but also for its resilience to economic shocks.
For an economy to be adaptable to rapid changes of technology and tastes, it should combine macro-stability with micro-mobility. This year's Competitiveness Report is about mobility, structural change and accumulation in the European manufacturing sector over the last ten years.
The 1999 Competitiveness report is divided in three parts. The first part considers the speed and pattern of change in the structure of European manufacturing. It looks at trends in industrial specialisation and in geographic concentration and it relates structural change to growth patterns in Europe.
The second part considers in more detail some of the prime forces behind structural change. These include the decisions of firms to invest in tangible and intangible assets and the reorganisation of large multinational enterprises (MNEs) into integrated European-wide organisations operating through networks.
The third part provides some indications on the sensitivity of different industries and of different European countries to a world-wide economic shock. It looks, in particular, at the effects on European competitiveness of the recent crisis in Southeast Asia.
Large potential gains from
restructuring
During the period 1988-1998, manufacturing value added in constant prices grew in the EU by 1.8% p.a. and employment in manufacturing fell by 1.4% p.a. on average. Compared to the eighties, this has been a period of slow growth for both Europe and Japan. Growth has accelerated, instead, in the USA (see Figure 1).
European Commission (1999). The competitiveness of European industry: 1999 Report. Luxembourg. SEC(1999) 1555.
Figure 1: Growth of manufacturing production and productivity in the Triad (1988=100)
Production in the Triad
— EU USA —Japan
19X0 1983 I 9X6 1989 1992 1995 1 998
Productivity in the Triad
— EU USA — —Japan
140
130
120
111)
100
90 H
80
70
19X0 19X3 19X6 I 9X9 1992 1995 1998
Nole: Production in real terms.
Source: W1FO (Österreichisches Institut för Wirtschaftsforschung)
calculations using Main Economic Indicators (OECD) and SBS (Eurostat).
Output and employment performance were weak
despite the fact that European manufacturing
maintained its market share in the world markets and enjoyed a quality premium in its exports. The trade surplus remained large over most of the period (see Figure 2).
Slow output growth was accompanied by sharp falls in employment in most large EU countries as well as in Finland and in Sweden. Only Ireland and Denmark registered substantial growth in both output and employment in the manufacturing sector (see Table 1).
In part, the poor performance in the last decade may be due to cyclical factors. The case of Finland is different in that this country suffered a devastating loss of export markets in the beginning of the nineties but seems to have, since, turned around the tide. For the most part, however, previous competitiveness reports have attributed the unsatisfactory outcome of the
nineties to structural weaknesses that have prevented EU firms from taking full advantage of new market opportunities. In general, small, open economies appear to have performed better.
Figure 2: Trade surplus and quality premium in EU trade
EU trade (ECU bn)
1800 1600 1400 1200
1000 872 858 800 ■ 600
41)11
200 0
1988 D Exports O Imports
1606 2.5
2.0
1.5 :
0.5
0 0
Jnit value in extra
1.722
1.034 EU trade
2.284
1.737
Note: Unit values in the right panel are for EU 12.
Source: WIFO calculations using COMEXT (Eurostat).
Table 1: Annual growth, by
EU Ireland Austria Portugal Belgium Greece Netherlands Denmark Spain Germany France Italy
United Kingdom Finland Sweden
1998/1988 Value added
2.9 7.9 6.7 6.7 4.7 4.4 3.9 3.9 3.6 3.0 2.4 2.5 2.3 1.8 0.2
Member State
1997/1988 Value added
3.2 9.9 7.0 7.2 5.3 5.6 4.2 4.2 3.1 3.2 2.8 2.7 2.4 1.5 0.3
Productivity
4.3 5.7 8.8 7.6 n.a. 7.3 4.2 2.5 3.9 5.2 3.7 3.3 4.4 1.9 0.9
Employment 1.1
4.2 1.8 0.4 n.a. 1.7 0.0 1.7 0.8 2.0 0.9 0.6 2.0 0.4 0.6
Notes: Value added in nominal terms.
Source: WIFO calculations using SBS (Eurostat).
Growth in output and employment also varied between different sectors of the economy. Those typified by large investments in intangibles, such as advertising and research intensive industries, grew faster than average. They also shed relatively fewer jobs. Capital and labour intensive industries have done worse on both accounts.
The overall industrial specialisation of EU
manufacturing does not appear, however, to be the main factor explaining slow growth. The variation in growth across countries is more pronounced than that across industries. This suggests that it is the general environment of doing business in each countiy that needs to be the focus of policy.
[image:10.595.62.296.130.481.2] [image:10.595.315.552.369.581.2]Further, the fact that growth rates vary substantially for the same industry in different countries suggests that there may still be much scope for restructuring and reallocation of resources within Europe.
Little change in Member States'
degree of specialisation
2High specialisation in few industrial sectors can be a blessing or a curse for a single country. For smaller countries, in particular, it allows a better exploitation of scale economies and of externalities of know-how. The effects, however, of an adverse economic shock may be devastating for a highly specialised country, especially if the mobility and adaptability in the economic system is low.
Over the period under consideration, on average Member States' degree of specialisation in production has risen only marginally. The rise is for the most part attributable to increasing specialisation of larger countries in some industries, for example, cars in Germany, machinery in Italy and food in the United Kingdom. Smaller countries did successfully exploit niches but did not experience, in general, a rising specialisation in production.
Further, there are indications that the degree of specialisation in exports has tended to fall, albeit slowly. The tendency of de-specialisation in exports is more prominent among smaller EU Member States, with the notable exception of Ireland. De-specialisation in exports should have reduced the exposure of smaller countries to external industry-specific demand shocks (see Figure 3).
The production structure of a country is "highly specialised" if a small number of industries accounts for a large share of its production. This will be called "production specialisation". Specialisation can also be measured for exports, or for exports and imports together - "export specialisation" and "trade specialisation" respectively. Needless to say, patterns of specialisation (as well as those of concentration, discussed below) do not necessarily follow the lines of any standard industrial classification scheme, such as NACE used here. Specialisation processes sometimes develop at more disaggregated levels - sub-industries or even firms and they may be regions within countries.
Figure 3: Production and trade specialisation: 1988 to 1998 (share of the largest five sectors)
United Kingdom
Sweden
Production Belgium
75 Denmark
Germany
Finland
Portugal
Austria
Greece
Spain
France
Netherlands
United Kingdom
Sweden
Ireland
Trade Belgium
75
Italy
1988 1998
Denmark
Germany
Finland
Portugal
Austria
Greece
Spain
France
Netherlands
Ireland
1988 1998 Source: WIFO calculations using SBS and COMEXT (Eurostat). There is no conclusive explanation of the opposite trends between production specialisation and export specialisation. One possible cause would be that MNE headquarter services are more likely to be included in value added statistics rather than in export statistics. Changes in the mix of intra- and inter-industry trade could also explain this phenomenon.
Geographical concentration
3of
industries declined
High geographical concentration of production or of exports means that a few countries supply a large part of the quantity sold in a given market.
Previous analyses have shown that the EU economy as a whole is less geographically concentrated than that of the USA. This has often led to the prediction that an integrated Europe could become more concentrated. Peripheral and small countries could suffer in the process.
Contrary to such predictions, geographical concentration of both production and exports fell in Europe during the nineties for the great majority of industries. This was primarily due to the fact that smaller EU Member States have grown faster on average than larger ones. A number of industries expanded their basis beyond the borders of the more industrially developed EU countries.
On average, the share of the three largest countries in total EU value added fell by more than one percentage point. In exports, the fall was closer to four percentage points. Moreover, the geographical concentration of research and skill intensive industries declined faster than on average. The smaller EU countries gained shares also in these industries.
Thus, contrary to expressed fears, closer integration in Europe does not seem to have led to a "core-periphery" model at Member State level (see Figure 4).
Speed of change is important for
growth
Structural change is not an end in itself. It is of interest to policy makers in so far as it reveals something about the adaptability and, hence, the competitiveness of the European economic system.
[image:12.595.324.555.124.572.2]Geographical concentration is defined as the extent to which EU activity in a given industry is concentrated in just a few Member States. It should be stressed that the report uses aggregate data, not firm data. The term "concentration" is therefore used to indicate the distribution of an industry across the Member States and should not be confused with the notion of "seller concentration" used in industrial economics and in competition policy, which denotes the importance of the largest firms in a market.
Figure 4: Geographic concentration of production and exports
Core versus periphery countries 70
60 1 50 40 30 20 -10
0
-Core Periphery -Core Periphery Share of value Share in exports
High-income versus low-income countries
LÜ
High Middle Low Share of value
High Middle Low Share in exports
90 80 70 60 50 -40 30 20 10 0
-Small versus large countries
Large Small Share of value added
Large Small Share in exports
Note: The core is defined as composed by Belgium (with Luxembourg), Denmark, Germany, France and the Netherlands. "High-income" countries are Belgium (with Luxembourg), Denmark, Germany and Austria; "middle-income" countries are France, Italy, the Netherlands, Finland, Sweden and the United Kingdom; "low-income" countries are Greece, Spain, Ireland, and Portugal.
Source: WIFO calculations using SBS (Eurostat).
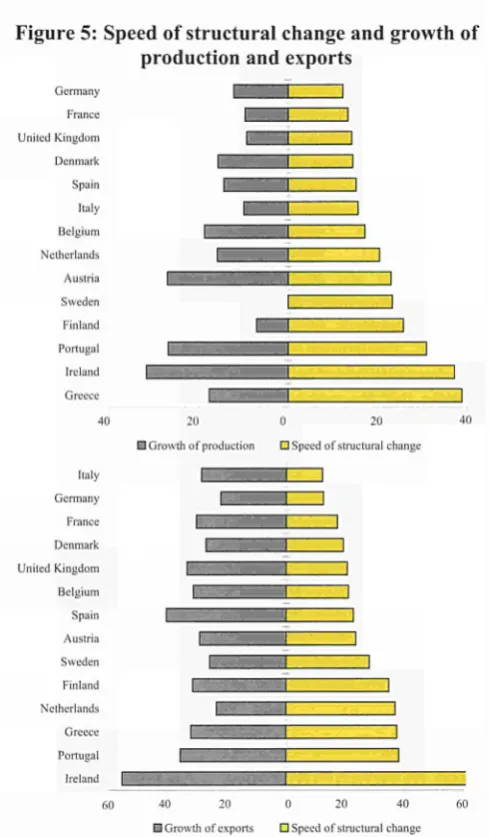
The evidence from industry for the last ten years suggests that there is a relationship between the "mobility " or "speed of structural change " in Member States and the growth of their production and exports (see Figure 5).
Figure 5: Speed of structural change and growth of production and exports
Figure 6: Speed of structural change
Germany France United Kingdom Denmark Spain Italy Belgium Netherlands Austria Sweden Finland Portugal Ireland Greece
411
¡Growth of production Π Speed of structural change
Italy Germany France Denmark United Kingdom Belgium Spain Austria Sweden Finland Netherlands Greece Portugal Ireland
I 1 1 1 1 1 1 1 1
1 1 1
1 1 1
1 1 1
1 I I
1 1 1
I 1 1
1 1 1
1 1 1
1 1 1
1 1 1
4(1 20 20
HGrowth of exports PSpeed of structural change Note: The "speed of structural change" index measures the net effect of structural transformation over a tenyear period. It is computed for each country and separately for value added and exports (total, i.e. extra and intraEU) by summing the absolute changes in the sector (i.e. twodigit industry) shares between 1988 and 1998. This index is zero when no industry changes its share and it increases the more industries change their relative positions. This information does not have the same scale as the growth in value added and exports reported on the lefthand side of each figure.
Source: WIFO calculations using SBS and COMEXT (Eurostat).
Looking at the EU as a whole, mobility is found to have increased since the early nineties, as economic integration accelerated in line with the Single Market Programme. It declined somewhat over the recession years of 199394 (see Figure 6).
On balance, the evidence of the first part of the report suggests that, over the last ten years, the industrial structure of Europe has been changing, albeit relatively slowly. This change has been in line with the objectives of cohesion in Europe: it has not created unfavourable asymmetries between countries and it has tended to favour smaller countries in the periphery of the EU.
170 160 150 140 130 120 110 100 90 80
/
Mobility in geographic structure
/
M o b i l i t y in i n d u s t r y s t r u c t u r e
1988 1989 1990 1991 1992 1993 1994 1995 1996 1997
Note: "Mobility" stands for the absolute change of value added shares (sectors, total EU) over the past three years. For instance, 1988 is the difference between 1988 and 1985 (which is taken as reference and set to 100), 1989 is the difference between 1989 and 1986, etc.
Source: WIFO calculations using SBS (Eurostat).
Structural change in a period of
decelerating investment
The observed industrial change becomes all the more important if one considers that it took place in a decade of weak investment activity in Europe.
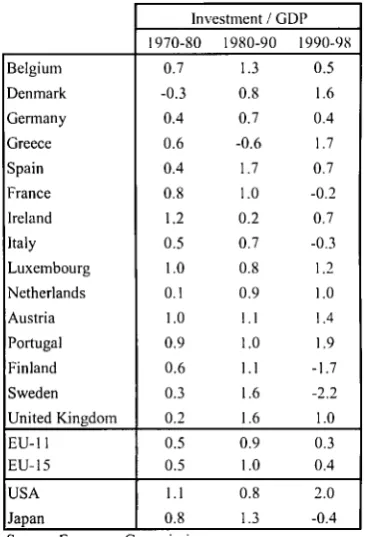
[image:13.595.33.278.95.514.2]In the nineties, the annual growth rate of investment fell sharply to 0.8% p.a. (from 2.5% in the eighties). As a percentage of GDP, gross investment in the EU was close to its post-war minimum (see Figure 7). The deceleration was only partly due to the overall fall in government investment in Europe. Growth of investment in the private sector also fell sharply. The deceleration concerned mainly, but not exclusively, the manufacturing sector.
Figure 7: Gross fixed capital formation at 1990 prices: total economy (percentage of GDP)
EU15 ■ U S A Japan
30
25
20
15
1969 1972 1975 1978 1981 1984 1987 1990 1993 1996 1999
Source: E u r o p e a n C o m m i s s i o n .
In contrast, recovery and restructuring in the USA were accompanied by a strong acceleration in investment growth (to 5.4% from 2.4% in the eighties). The acceleration was mainly due to private investment in the manufacturing sector.
Within the EU, France, Italy, Finland and Sweden experienced a fall in gross investment in the nineties. Investment activity in Germany and Belgium grew at or below the EU average. The highest rates of growth were recorded in Denmark, Ireland, Luxembourg and Portugal.
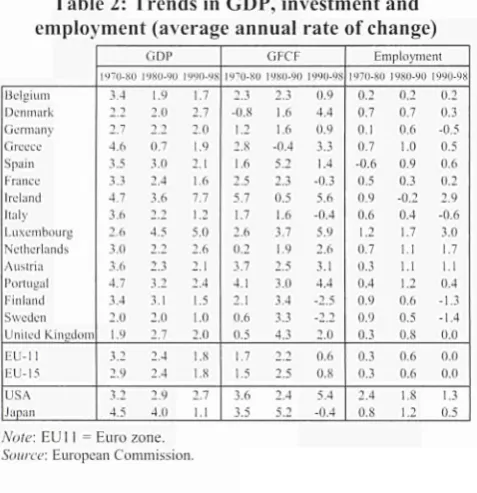
Investment growth and employment creation have been positively related in the long run (see Table 2). This relation seems to have become stronger over time.
Table 2: Trends in employment (averag
GDP, investment and e annual rate of change)
Belgium Denmark Germany Greece Spain France Ireland Italy Luxembourg Netherlands Austria Portugal Finland Sweden United Kingdom EUΠ EU15 USA Japan GDP 1970-80 3.4 2.2 2.7 4.6 3.5 3.3 4.7 3.6 2.6 3.0 3.6 4.7 3.4 2.0 1.9 3.2 2.9 3 t
4.5
1980-90
\M 2.0
τ τ
0.7 3.0 2.4 3.6 2.2 4.5 2.2 2.3 3.2 3.1 2.0 2.7 2.4 2.4 2.9 4.0 1990-98 1.7 2.7 2.0 1.9 2.1 1.6 7.7 1.2 5.0 2.6 2.1 2.4 1.5 1.0 2.0 1.8 1.8 2.7 1.1
( l i t ι
1970-80 2.3 0.8 1.2 2.8 1.6 2.5 5.7 1.7 2.6 0.2 3.7 4.1 2.1 0.6 0.5 1.7 1.5 3.6 3.5 1980-90 2.3 1.6 1.6 η.4 5.2 2.3 0.5 1.6 3.7 1.9 2.5 3.0 3.4 3.3 4.3 ι ι 2.5 2.4 5.2 1990-98 0.9 4.4 0.9 3.3 1.4 0.3 5.6 0.4 5.9 2.6 3.1 4.4 2.5
."> "Ì
2.0 0.6 0.8 5.4 0.4 Employment 1970-80 0.2 0.7 0.1 0.7 0.6 0.5 0.9 0.6 1.2 0.7 0.3 0.4 0.9 0.9 0.3 0.3 0.3 2.4 0.8 198090 0.2 0.7 0.6 1.(1 (1.4 0.3 0.2 0.4 1.7 1.1 l.l i . : 0.6 0.5 0.8 0.6 0.6 1.8 1.2 199098 0.2 0.3 0.5 0.5 0.6 0.2 2.9 0.6 3.0 1.7 1.1 0.4 1.3 1.4 (1.0 0.0 0.0 1.3 0.5 Note: EU li =
Source: Europe Euro zone. an Commission.
Low investment is likely to have slowed down structural change, particularly in the recession years of 19931994. With the exception of Spain, the "speed of adjustment" of the manufacturing sector in all large European countries (and in Japan) was lower than in the USA. This was in contrast to the eighties when Germany and Japan had the fastest "speed of adjustment" among all large industrialised countries.
The business environment of
individual Member States has an
important influence on investment
There is no single set of factors that can explain investment patterns in European manufacturing during 19851995. Both macroeconomic factors and the life
cycle of products and industries seem to have played an important role.
Investment rates in European industries varied just as much across industries (in the same country) as they varied across countries (for the same industry). Thus, macroeconomic policies and national regulatory frameworks may have been as important as industry
specific technological changes and changes in
consumer preferences.
Two points are nevertheless worth noting in this respect. First, there is little evidence of a European wide investment cycle. Variables, such as domestic demand and labour costs, continue to be important determinants of investment at the national level. Thus, despite the process of economic integration, there is still a significant "home-countty effect" influencing investment.
Second, this "home country effect" does not seem to be exclusively due to differences in the business cycle of Member States. Differences in investment rates of Member States have persisted over a long period, throughout the business cycle and across sectors. This suggests that there are important differences in the structural characteristics, as well as in cultural and institutional background of Member States, affecting the investment decisions of firms.
Member States' heterogeneity persists
also in intangible investment
Member State's characteristics seem to matter also for the decisions of firms to invest in intangible and in human capital.
Despite the importance of these types of capital for the competitiveness of the economy, our relevant data sources and our understanding of the investment decisions in this field are inadequate.
Based on a broad industry taxonomy by factor inputs, one can gain a glimpse of the heterogeneity that exists in EU (see Table 3).
Different structural patterns reflect differences in the utilisation of technology and in the skill intensity of production methods, both of which affect labour productivity and export unit values.
The empirical evidence suggests that investment in intangibles is important for competitiveness irrespective of the industrial specialisation of the countiy. It is particularly relevant for the competitiveness of highR&D and highskill intensive industries.
[image:14.595.65.304.298.545.2]Table 3: Value added shares in total manufacturing in 1997, %
Table 4: Evolution of MNE strategies and structures
Belgium Denmark Germany Greece Spain France Ireland Italy Netherlands Austria Portugal Finland Sweden United Kingdom EU USA Japan Mainstream manu fact. 22.12 29.50 28.06 19.61 21.17 21.94 12.06 28.88 21.50 26.39 21.92 22.82 21.95 22.85 25.41 21.26 24.86 Labour-intensive 15.63 14.68 14.13 17.71 20.78 13.57 6.25 19.84 11.75 18.83 23.65 14.98 12.07 13.21 15.31 12.22 16.00 Capital-intensive 22.24 12.08 15.46 19.26 16.47 14.69 12.56 15.90 19.23 16.29 13.94 28.59 21.25 14.33 15.55 13.51 16.01 Marketing-driven 21.08 28.60 16.22 35.36 26.73 22.10 31.48 17.65 31.20 24.61 29.77 17.54 16.16 25.52 21.28 23.17 21.00 Technology-driven 1 8.93 15.13 26.13 8.06 14.84 27.69 37.66 17.73 16.32 13.88 10.72 16.07 28.57 24.08 22.46 29.84 22.13
Source: WIFO calculations based on SBS (Eurostat).
Labour productivity, in particular, is found to be determined, in order of importance, by the skill-intensity of labour, by the invested physical capital, by the research expenditures and by the advertising outlays.
Multinationals are reorganising into
European-wide networks
Industry level data reflect only part of the whole restructuring process and mobility in Europe. A large part of this process takes place within industries, at the micro level. It involves, among other things, the entry and exit of firms, changes in ownership and control of enterprises through mergers and acquisitions, as well as the internal reorganisation of large MNEs.
The strategies and structure of MNEs have changed over time. The establishment of stand-alone affiliates based on a specific territory, operating autonomously and duplicating activities represent old strategies. At present, an increasing number of MNEs are becoming integrated Europe-wide organisations. They build, and operate through, production and subcontracting networks that span the whole of Europe (see Table 4). The progress in information and communication technologies (ICT) has made access to networks easier for all firms. Nevertheless, it remains true that larger firms have more possibilities to build and participate
in such networks throughout Europe.
The creation of these integrated enterprise networks has far-reaching effects on European restructuring and integration. Form Stand-alone Simple integration Complex international production
Types of intra-firm linkages Ownership, technology Ownership, technology. markets, finance, other inputs All functions Degree of integration Weak Partially strong Potentially strong overall Environment Host country accessible to FDI; significant trade barriers;
costly communications and transportation Bilaterally open trade and FDI;
non-equity arrangements Open trade and FDI; IT; convergence in tastes; increased competition
Source: World Investment Report 1993 (United Nations).
First, the networking of finns is essential for the cross-border transfer of know-how and of proprietary advantages. Second, firms that belong to such a network have an increased ability to reallocate resources internally in response to adverse economic shocks. This increases the adaptability of the whole economic system. At the same time, it limits the margins within which purely domestic policies can be conducted.
Summarising, the second part of this report argues that the weak investment activity of the nineties has, in all probability, made restructuring in the EU more difficult. Investment decisions in both tangible and intangible assets are still influenced significantly by country specific structures and characteristics. It is easier for larger MNEs to reorganise their operation to take filli advantage of the Single Market. Policy needs to focus, therefore, on local impediments to investment and on the difficulties of SMEs to build and participate in European-wide networks.
Industrial structure is important in
facing world-wide shocks
Adaptability is essential for the resilience of the European economic system to shocks. The redeployment of resources can mitigate the effects of adverse economic conditions in a specific industry or country.
The recent crisis in Southeast Asia is a good example of how a macro shock abroad may asymmetrically hit industries and countries within Europe, necessitating a rapid structural adjustment.
The aggregate impact of the crisis on European manufacturing during 1996-1998 is estimated to have been between half and one percent of aggregate production. As the impact was not concentrated particularly in sectors of high labour intensity, the loss of employment in manufacturing is likely to have been
of the same order. In the longer run, the effects of the crisis could still prove more significant.
The overall analysis indicates that the effect of the crisis on EU manufacturing production was rather asymmetric across industries. Luxury goods industries stand out as having been hit hardest. Engineering industries also appear to have been highly exposed to the crisis. Basic metals industries have both lost exports and faced tougher import competition at home. EU countries were also hit asymmetrically, depending on their industrial specialisation (see Table 5).
Table 5: EU manufacturing trade with Southeast Asia
(actual and adjusted change in exports and imports)'1
France
Belgium-Luxembourg Netherlands Germany Italy
United Kingdom Ireland Denmark Greece Portugal Spain Sweden Finland Austria
Exports % change 1996-1998
Actual 3.5 -13.5 -19.8 -20.1 -38.8 -0.3 21.7 -7.4 -26.7 -26.5 -40.2 -23.5 -27.7 -22.1
Adjusted -1.5 -20.1 -14.7 -19.8 -26.8 -14.4 3.8 -16.9 -24.9 -6.0 -20.4 -15.6 -15.6 -19.7
Imports % change
Actual 37.9 33.6 55.1 14.6 43.9 37.0 75.4 36.7 15.6 16.0 59.6 11.8 19.0 9.8
1996-1998 Adjusted
33.8 28.1 37.7 33.6 36.0 34.1 43.3 32.1 56.3 27.3 37.4 28.8 29.3 32.1
a Calculated on trade values.
b Using actual sector shares in total extra-EU imports and exports in
1996 for each Member State but assuming average EU growth rates. Source: NEI (Nederlands Economisch Instituut) using COMEXT (Eurostat).
Export specialisation was an important contributing factor to aggregated falls in the value of manufacturing exports to Southeast Asia for Germany, Italy, Spain, Sweden, Austria, Belgium-Luxembourg and Portugal. It is less evident whether Member States' import specialisation prior to the crisis had an important effect on the growth rate of imports from Southeast Asia. In Italy and Spain, an even stronger negative effect came through a poor performance of individual industries relative to the EU as a whole.
In conclusion
Adaptability and rapid structural change are essential for the competitiveness of the European economy and its resilience to world-wide economic fluctuations. The
1999 Competitiveness Report argues that:
• In a period of low growth and low investment rates, the European manufacturing system nevertheless appears to have taken advantage of European integration, shifting resources between industries and countries.
• This restructuring seems to have taken place in line with the broad objective of closer cohesion. Data at Member State level does not indicate any strengthening of a "core-periphery" model. On the contrary, smaller countries in the periphery of the EU have tended to benefit most.
• A recovery in investment activity in both tangible and intangible assets will be needed to facilitate the desired structural changes.
• Along with industry-specific factors, there is still a large "home-country effect" influencing investment in both tangible and intangible assets. Emphasis on these local conditions and local impediments is essential for building a favourable environment for higher investment in Europe. • Cross border networking of enterprises is also
essential for restructuring and competitiveness. Large MNEs are already reorganising their internal operations to take advantage of positive network effects in the Single Market. Attention is needed on the networking of smaller firms. The main challenge for policy makers that stems from the above conclusions is how to release the potential for further adjustment of industrial structures.
Future analysis should seek to identify those factors which play a key role in the adjustment process and the best avenues for influencing them. The implementation of the Economic and Monetary Union, the emergence of electronic commerce and, more generally, the information society are examples of recent developments which encourage structural adjustment. The country-specific structural factors, the importance of which was emphasised in the 1999 Competitiveness report, can constitute a suitable area for the application of benchmarking techniques.
Beyond enterprise policy, the Commission will continue to exploit the results of its competitiveness analysis within the wider framework of the Cardiff process, the Broad Economic Policy Guidelines and the European Employment Strategy, particularly in relation to structural reform issues.
Limited availability of statistical information, in particular as concerns services, reduced the scope of the analysis. There is a need to look further into the possibilities of improving the statistical tools for the purposes of competitiveness analysis.
Introduction
Responding to fast moving markets
European manufacturing has been and is currently facing dramatic changes in its business environment. The process of European integration has abolished trade barriers, created a single market and now a single currency. New technologies, based in telecom, electronics and biotechnology, are changing production patterns and consumer choices. Globalisation is widening the horizons for production, consumption and competition and is accelerating the diffusion of knowledge, information and technology. Globalisation also increases the world-wide impact of national and regional economic and political shocks and fluctuations. During the nineties, Asian countries, as well as Russia and South America, have been hit by a crisis and forced to reform their financial and economic institutions. At varying paces, CEEC are slowly catching up and have started the process of negotiating access to the EU. Meanwhile, the USA, the EU's major competitor, retains a robust productivity advantage and is enjoying an unprecedented, long period of economic growth without inflation and fiscal deficit.
In this fast moving world economy, adaptability is a key to the competitiveness of Europe. In order to be competitive, the European economy has to be in a position to rapidly accumulate and re-deploy resources in the pursuit of new opportunities. It also has to exploit in full the existing competitive strengths. Adaptability and rapid structural change are crucial not only for the growth prospects of an economy but also for its resilience to economic shocks.
This report is about adaptability and structural change in European manufacturing over the last decade. The emphasis on manufacturing and the use of country-level, rather than regional, information is imposed by data availability. This restricts the scope of the report when it comes to drawing conclusions relevant for employment creation. Manufacturing has long ceased to be a major source of employment creation for most EU Member States. Also, many important questions on convergence in Europe are best examined with
regional data. On the other hand, country level, manufacturing data may be well adapted for examining the broad patterns of restructuring, as it is at this level of aggregation and for this type of products that the Single Market Programme should have had its major impact over the nineties.
The report is divided in three parts. The first part considers the speed and pattern of change in the structure of European manufacturing and their effect on growth. The second part considers in more detail some of the prime forces behind structural change. These include the decisions of firms to invest in tangible and intangible assets and the reorganisation of large MNEs into integrated European-wide organisations operating through networks. The third part examines in some detail the sensitivity of different industries and of different European countries to the recent shock in Southeast Asia.
Recalling some key results from the
1998 Competitiveness Report
The main emphasis of this report is on the restructuring of industry within Europe. This is rather different than in last year's report, which was focused on the competitiveness of the EU compared to the USA and Japan. Nevertheless, it is instructive to recall some of last year's findings as a useful starting point. In the last Competitiveness Report, it was shown that, in comparison to the USA, Europe is at a deficit when it comes to creating income and employment. The productivity of the economy as a whole, and of the manufacturing sector specifically, is still significantly lower in Europe than in the USA. Furthermore, in Europe, the share of the population employed is lower and unemployment higher. Jobless growth is a major problem to be solved in the context of sustainable development.
INTRODUCTION - 2
competence and skills. But these must be balanced against deficits of European manufacturing in fast moving markets, characterised either by technological upturns, as in the case of ICT-related research intensive industries, or by rapidly changing consumer tastes.
The previous report attributed the unsatisfactory performance of Europe in growth and employment to structural weaknesses that have prevented European firms from taking advantage of new market opportunities.
The effects of European integration
-hopes and fears
To see why adaptability and structural change are important factors of the future competitiveness of Europe, it is helpful to consider the analogy with the design of a successful business strategy for the individual finn operating in competitive, fast moving markets.
On the one hand, the finn must be ready and able to exploit its specific assets to the full, and this will often require dramatic refocusing over a short period. On the other hand, however, concentrating all of its efforts into too narrow a range of activities - "putting all the eggs in one basket" - runs the risk of being left behind as new opportunities arise.
In just the same way, the future success of Europe's manufacturing sector depends on its ability to exploit the comparative strengths of its various Member States, whilst also retaining the flexibility to change direction as new challenges and opportunities emerge. This leads to three considerations with policy significance on industrial structure in Europe:
• First, exploitation of scale economies and a deeper division of labour are expected to be the driving forces of Europe's increased competitiveness flowing from the Single Market Programme. If factor endowments are different across countries, one would expect this to lead to increasing specialisation. In this case, a hypothesis would be that high wage countries might move into high productivity and research intensive industries in order to ensure further growth, whilst low wage countries might specialise in more labour intensive activities.
• Second, there is the concern that an over-specialisation of individual countries in nanow product groups might render them too exposed to demand risks. The possibility is that individual countries and regions might become more
vulnerable to "asymmetric shocks": disturbances that affect countries differently, and would therefore endanger stability within a common currency area.
• Third, there is the potential concern of a regional nature. Integration may lead to an agglomeration of activities in attractive regions. There might be a danger that a prefened "core" will arise, in which high demand or better market access act as a magnet drawing more and more activity away from the poorer regions, located at the geographical "periphery" or disadvantaged by a lack of endowments, their history, or existing industrial structure.
Certainly, if one compares the regional structure in Europe with that of the USA, one might anticipate the potential for dramatic change in Europe. Regions are far more specialised in the USA, and some economists have forecasted that similar levels of regional concentration will emerge in Europe as a consequence of the creation of a Single European Market.
Thus, the purpose of the first part of the report is to contemplate the evidence of the last decade, and to ask: How fast has been the restructuring process? Has Europe either as a whole, or within Member States -displayed the ability to restmcture quickly? At the same time, we look for evidence that arguably worrying regional over-concentrations have emerged, leaving parts of Europe particularly exposed to asymmetric shocks. A stock-taking of the extent and direction of structural change over the last decade provides another opportunity to assess the impact of integration within the EU.
INTRODUCTION - 3
Investment decisions and networking
of firms
The process of specialisation and concentration is driven by the decisions of individual firms and investors. The speed of this process depends on economic forces such as economies of scale, spillovers, technology, changing consumer tastes and the mobility of labour. While some of these market forces may be beyond the control of the policy maker, this does not mean that policy, regulations and government actions, in general, do not play a role. To return to the analogy of the successful corporate strategy, it is important that the firm is able to respond efficiently to signals from the market, and it is top management's task to ensure that inertia in the organisation of the firm does not act as an impediment. Similarly, Europe's firms operate within a framework determined by institutions, regulations, liberalisation programmes and public support, and these are amenable to policy intervention both at the national and at the European level.
Thus, the second part of the report looks in more detail at the investment activity in Europe and at its determinants. The weak investment activity of the nineties in both tangible and intangible assets has, in all probability, made restructuring in Europe more difficult. In large part, the investment performance of each industry has depended on the characteristics and structures of the country where the industry is located. The existence of this "home country effect" suggests that emphasis should be given on policies, regulations and structures at the national level.
Large MNEs are already reorganising their operation to take full advantage of the Single Market. There are developing into integrated European-wide organisations operating through networks. The networking of SMEs is also essential for the competitiveness and adaptability of European economy.
The first chapter of the second part starts with investment in tangibles assets. Chapter 2 focuses on intangible investments and chapter 3 on the process of internal reorganisation of MNEs and the building of enterprise networks in Europe.
The last part of the report examines the impact of the recent crisis in Southeast Asia on the competitiveness of single industries and countries in Europe. The crisis in Southeast Asia is a good example of how a macro shock abroad may hit asymmetrically industries and countries within Europe, necessitating a rapid structural adjustment.
Main messages of the report
In summary, this report argues that:
• Adaptability and rapid structural change are essential for the competitiveness of the European economy and its resilience to world-wide economic fluctuations
• In a period of low growth and low investment rates, the European manufacturing system nevertheless appears to have taken advantage of European integration, shifting resources between industries and countries.
• This restructuring seems to have worked in line with the broad objective of closer cohesion. There has not been any signs of strengthening of a "core-periphery" model. On the contrary, smaller countries in the periphery of the EU have tended to benefit most.
• The potential for restructuring still appears to be wide. Future restructuring may involve transfer of activities across Europe.
• A recovery in investment activity in both tangible and intangible assets will be needed to carry out the desired structural changes.
• There is still a large "home country effect" on investment in both tangible and intangible assets. Emphasis on these local conditions and local impediments is essential for building a favourable environment for higher investment in Europe.
Part One
Chapter 1
Statistical overview by Member State and industrial sector, 1988-1998
1. The aggregate picture
1The production of European manufacturing as a whole increased in the period 19881998by 1.8% p.a. in real terms (2.9% p.a. in nominal terms). Seen from a long term perspective, this was a period of slow growth slower than in the USA, but higher than in Japan (Figure 1.1). Employment in manufacturing decreased in Europe by around 8% for the total period whilst it was approximately stable in the USA. Europe was more severely hit than the USA by the currency turbulence of 19931994, as well as by the Asian crisis ant its repercussions in Eastern Europe (Russia) at the end of the period.
Europe's hope for catching up on productivity versus the USA is therefore not really evident during this period as a whole indeed the gap has widened in recent years.2
The period analysed is 1988 to 1998. Fortunately, the beginning and the end of this period are not particularly extreme points in the business cycle. In the middle of the period, Europe faced a severe recession with devaluations in some Member States. Additional country specific shocks during these years were the unification of Germany, the transition of the CEEC, the loss of the Russian market and the political turmoil in the Balkan region. Each of these shocks affected Member States differently and technically speaking increased the noise in the data set.
Turning to trade, the picture is a little more favourable. Exports (at current prices) have grown faster than imports, so that Europe now has a surplus of 132bn ECU in its trade of manufacturing products (Figure 1.2). Its exports are more highervalued than its imports, reflecting a positive "quality premium" for its exports to nonmembers. This premium comes primarily from countries outside the USA and Japan, e.g. from CEEC. Exports as well as imports are rising faster than production, intraEU exports are increasing
The whole of Part One draws on Aiginger et al. (1999). Analyses from the US administration suggest that the acceleration of US productivity observed since 1995 is partly attributable to the diffusion and use of ICT in the economy. See US Department of Commerce (1998).
faster than extraEU exports, reflecting the deepening of integration in Europe (Figure 1.3).
Figure 1.1: Growth of production and productivity in the Triad (1988=100)
140
130
120
110
100
90
80
70
Production in the Triad
EU USA
j^K
JET Φ
\1¿>*
- Japan *»
* »
m ^
¿¿s
1980 1983 1986 1989 1992 1995 1998
Productivity in the Triad E U USA Japan
1980 1983 1986 1989 1992 1995 1998
Note: Production in real terms.
8 - CHAPTER 1
Figure 1.2: Trade surplus and quality premium in EU trade
EU trade (ECU bn)
I 7ÎS 1606
Unit value ¡n extra-EU trade
2-5 2.284 2.0
1.722
1.5
1.034 1800
1600 1400 1200
1000 872 858 800
600 400
2(111
0
1988 1998 ]9¡ D I \poils D Imports
Note: Unit values in the right panel are for EU 12. Source: WIFO calculations using COMEXT.
Figure 1.3: Exports growing faster than production
220
*
200 - . * '
1988 1989 1990 1991 1992 1993 1994 1995 1996 1997 1998
— — Extra-EU exports - -Intra-EU exports -Production Source: WIFO calculations using COMEXT and SBS.
Let us now turn at looking at individual industries within individual Member States.
2. Comparisons across the Member
States
Apart from the previous section, in this report, production is defined as nominal value added on grounds that the creation of value added is the final goal of economic activity.3 Additionally, it is defined
as one of the components of competitiveness. Taking
More precisely, we measure production by the value added at factor costs. This is preferred to gross production because it avoids double counting and differences in the degree of vertical integration. This definition is different from that used in many of the publications prepared on SBS data by Eurostat where the variables "turnover" or "production value" are used as equivalent for production.
value added in nominal terms is not ideal for all questions, but problems of price adjustment and holding quality constant for nearly 100 industries in each Member Country are nearly insoluble.
Judged by growth of nominal value added within aggregate manufacturing, the Member States4 fall into
four broad groups (see Table 1.1):
• Three fast growing smaller Member States:
Ireland, Portugal and Austria. Irish
manufacturing industries performed particularly strongly, growing on average by nearly 8% per year, combining a remarkable catching up process with significant specialisation in fast growing industries. With average growth at 6.7%, Portugal is a similar example of a country which has been catching up. Austria also shows an annual growth rate of 6.7%.
• Slightly faster than average growth was also recorded by five other, also mainly small Member States: Belgium, the Netherlands, Denmark, Greece and Spain
• Germany, France, Italy and the United Kingdom performed rather sluggishly. Germany recorded the highest growth of the four - at just about the overall EU average, but Italy, France and the United Kingdom were all below average. • At the bottom end of the scale are the two Nordic
countries, Finland and Sweden. Finland experienced a period of deep recession, induced by problems in the banking sector as well as the large reduction in trade with the former Soviet Union. Both countries were also faced with the devaluation of their currencies during the early nineties.
This country growth pattern is consistent with a catching up process in some of the Member States which had below average per capita income at the start of the nineties. Starting from a position of low average labour productivity in 1988, Ireland and Portugal managed to catch up considerably. However, catch-up was not so pronounced in Greece and Spain.
The ranking of countries by productivity growth is similar, but there are some noteworthy exceptions. In Europe, productivity grew by 1.1% p.a. faster than value added, and this means that employment declined, on average by 1.1%. The countries with particularly strong productivity growth (relative to value added) were Germany and the United Kingdom amongst the
CHAPTER 1 - 9
larger Member States, and Greece and Austria amongst the faster growing smaller Member States. These were also the four countries suffering the greatest falls in employment. More generally, however, employment has been decreasing in the manufacturing sectors of every Member State, with the exceptions of Ireland and Denmark.
Table 1.1: Annual growth by Member State
reduced employment at a rapid rate - due to the aforementioned negative growth in value added (Table 1.2). EU Ireland Austria Portugal Belgium Greece Netherlands Denmark Spain Germany France Italy United Kingdom Finland Sweden 1998/1988 Value added 2.9 7.9 6.7 6.7 4.7 4.4 3.9 3.9 3.6 3.0 2.4 2.5 2.3 1.8 -0.2 1997/1988 Value added 3.2 9.9 7.0 7.2 5.3 5.6 4.2 4.2 3.1 3.2 2.8 2.7 2.4 1.5 0.3 Productivity 4.3 5.7 8.8 7.6 n.a. 7.3 4.2 2.5 3.9 5.2 3.7 3.3 4.4 1.9 0.9 Employment -1.1 +4.2 -1.8 -0.4 n.a. -1.7 0.0 1.7 -0.8 -2.0 -0.9 -0.6 -2.0 -0.4 -0.6 Note: Value added and productivity are in nominal terms. Reliable figures on employment are unavailable for 1998, and so the last three columns show the comparable estimates for value added, productivity and employment for 1988 to 1997. Throughout this report, country aggregates refer to aggregate manufacturing.
Source: WIFO calculations using SBS.
3. Growth of industrial sectors
Within manufacturing,5 the average annual growth rate varied quite noticeably. There was negative or zero growth in computers and office machinery, and the textiles and clothing sector, while strong growth - in excess of 4% was observed in tobacco, rubber and plastics, radio, TV and telecommunications equipment, and publishing and printing. Again, in general, productivity growth exceeded that of value added, and the inevitable consequence was generally declining employment. Some of the largest declines in employment were posted by the more traditional sectors of textiles and clothing, and basic metals industries. But office machinery and computers also
Table 1.2: Annual growth by
15 Food products and beverages 16 Tobacco products
17 Textiles
18 Wearing apparel; fur
19 Tanning and dressing of leather 20 Wood, products of wood and cork 21 Pulp, paper and paper products 22 Publishing, printing and reproduction 23 Coke, refined petroleum, nuclear fuel 24 Chemical and chemical products 25 Rubber and plastic products 26 Other non-metallic mineral products 27 Basic metals
28 Fabricated metal products 29 Machinery and equipment n.e.c. 30 Office machinery and computers 31 Electrical machinery/apparatus n.e.c. 32 Radio, TV and communication equip. 33 Medical, precision and optical
instruments, watches 34 Motor vehicles, trailers 35 Other transport equipment 36 Furniture; manufacturing n.e.c.
Total manufacturing ndustrial sector 00 00 ON So υ -Ό a > 3.4 5.9 0.9 0.6 -0.1 3.3 2.0 4.4 2.2 2.6 4.5 2.2 0.2 3.9 3.6 -2.2 2.4 4.4 3.5 3.8 2.6 3.7 2.9 1997/ 1988 ■o OS a υ a > 3.8 5.8 0.7 0.2 0.3 3.2 2.1 4.3 3.1 3.3 4.5 2.2 0.8 4.1 3.5 -1.1 2.7 5.1 2.9 3.9 3.7 3.2 3.2 3 -τ: -£1 3.8 9.6 4.5 3.1 3.4 3.7 3.7 3.3 4.4 4.5 4.1 3.8 5.1 4.0 4.6 2.1 4.8 5.9 4.9 4.4 5.9 3.1 4.3 C ■j Ξ ... o D. E — 0.0 -3.8 -3.S -2.9 -3.0 -0.5 -1.6 + 1.0 -1.3 -1.2 +0.4 -1.6 -4.3 +0.1 -1.1 -3.2 -2.1 -0.8 -2.0 -0.5 -2.2 +0.1 -1.1
Note: Value added and productivity are in nominal terms. Reliable figures on employment are unavailable for some industries for 1998, and so the last three columns show the comparable estimates for value added, productivity and employment for 1988 to 1997.
Source: WIFO calculations using SBS.
Another, potentially more illuminating, way to disaggregate manufacturing, is to apply the WIFO taxonomy.6 This classifies industries according to
factor intensities into labour-intensive, capital-intensive, and research- and advertising-intensive sectors. It has as a fifth segment a mainstream sector, which uses the average mix of factors (Table 1.3). When grouped in this way, it turns out that the growth in productivity is very similar - between 4.5 and 4.7% on average for all sectors, except the capital-intensive group, for which growth was lower than average. Growth in value added was highest amongst the advertising intensive industries (3.9%), and lowest amongst the labour and capital intensive sectors, at
Manufacturing is defined by Eurostat as NACE sectors 1 5 -36, which amounts to 22 two-digit sectors and roughly 100 three-digit industries therein. The main data sources are Eurostat, European Commission, United Nations and WIFO.
1 0 - C H A P T E R 1
2.7% and 1.6%, respectively. It was also these sectors which showed the fastest loss of employment.
Table 1.3: Annual growth by type of industry (WIFO taxonomy): 1988 to 1998
Table 1.4: Country and industry effects on growth
Analysis of variance of industry growth (1989 to 1997)
Source Partial SS df F
Mainstream Labour intensive Capital intensive Advertising intensive Research intensive
Total manufacturing
Value added
3.4 2.7 1.6 3.9 3.2
2.9
Productivity
4.6 4.7 4.2
4.7 4.6
4.5
Employment
-1.2 -2.0 -2.5 -0.8 -1.3
-1.4
Note: Value added and productivity are in nominal tenns. Estimates were computed for those industries for which employment data in
1998 were missing.
Source: WIFO calculations using SBS.
Although these differences are not very pronounced, they are consistent with weak demand growth in labour and capital industries. They seem to support two hypotheses: labour intensive industries lose ground in European manufacturing due to the forces of the intensified globalisation process, which lead to de-location of labour intensive production to low wage countries outside. Capital intensive industries seem to substitute labour more intensively through stronger rationalisation. The former hypothesis is supported by the fact (not shown in the table) that highly globalised industries, which are to a large extent labour intensive, expanded at a slightly below average rate of 1.8%. The latter hypothesis is confirmed by the below average growth (1.7%) of mainly capital-intensive high-wage industries, which reduced employment the most.
4. Variability of growth rates between
sectors and Member States
Having disaggregated EU manufacturing in two directions - by Member State and then by sector - one preliminary step is to assess in which direction the variability is greater. This information is potentially helpful in highlighting whether country- or industry-level determinants are likely to be the more important.
The average rate of nominal growth in a typical three-digit industry amounted to 2.1% during the nine-year period 1989-1997. The standard deviation of 6.3 percentage points reveals the high variation between EU Member States and between industries, a picture confirmed by the very high extremes in the distribution and by the analysis of variance in Table 1.4.
Model Intercept Country Industry effect Country χ industry
Residual Total
Ν R2
effect
18370.3 3124.1 5705.3 2527.9 8796.5
20574.6 38944.9
998 0.47
214 1 11 17 1X6
783 997
3.3 118.9
19.7 5.7 1.8
** ** :|: :\:
■■: *
**
Note: SS = Explained and unexplained variance; df = degrees of freedom.; F = Test of the significance of the model/coefficients (** = significant at 5%).
Source: WIFO calculations using SBS.
Forty-seven percent of the variation can be explained by country, industry and combined industry and country effects. The variation across countries is more pronounced than the industry effects, indicating that the country specific environment, economic policy and macroeconomic development have a significant impact on industry growth. This picture is consistent with the view that European manufacturing is not yet fully integrated. Most of the variation in average growth rates comes from combined country and industry effects, suggesting that country specific environments combined with industry specific determinants common throughout the entire EU such as demand growth -are the ingredients of long run perfonnance.
Given these results, there are obviously a large number of country- and industry-specific factors at work, and therefore it is not surprising that we shall find below that broad-based general trends in both specialisation and concentration are fairly weak.
5. The theory
Three strands in economic theory have some bearing on how specialisation and concentration might develop with increasing integration.7
For given endowment differences across Member States, traditional trade theory suggests that intensified integration will tend to increase specialisation. Countries with higher incomes will tend to specialise in capital intensive, skill intensive and research intensive industries. On the other hand, if endowments converge - as they should eventually in a single market with factor mobility - and industries
CHAPTER 1-11
have constant returns to scale, then specialisation should decrease.
According to the new trade theory, high-income countries will tend to concentrate on industries with high levels of innovation, driven by forces on the demand side (new products and greater variety are demanded) and supply side (innovation rents and the capacity to make use of technological opportunities). In industries where product differentiation is important, countries will specialise in products on the upper quality segment. Countries with similar incomes will engage in mira-industry trade, and there is no certainty that increased specialisation will emerge.
Economic geography, on the other hand, highlights
the possibility that regions/countries with privileged market access (defined by size, income level, and centrality) may profit first and more strongly from integration. Industries characterised by increasing returns to scale should locate near the largest market; spillovers should enforce the advantages of large markets, as will forward and backward linkages. On the other hand, the periphery will specialise in low wage industries, in industries with less product differentiation and limited spillovers. Eventually, however, this process will reverse if wages rise faster in the centre, if diseconomies of agglomeration emerge and if lower transport costs make a given cost difference between the core and periphery more decisive. International migration, as well as labour mobility within a country and between industries, will also reinforce this offsetting effect. The mobility of firms, as well as the upgrading of skills and productivity in the periphery, will also diminish the danger of uneven development.
Overall, then, the predictions from theory suggest that specialisation and concentration might go either way, especially in the longer ran.
6. Previous empirical studies
For the sake of brevity, we merely itemise the key findings:8
• The USA has higher, albeit declining, regional
concentration
Krugman (1991) showed that manufacturing is more regionally concentrated in the USA than in Europe by comparing four regions in the USA with four large countries in the EU. However, the most highly concentrated industries were not "cutting edge", high
technology sectors - in fact, textiles were the most concentrated. Higher concentration in the USA was subsequently confirmed in later studies, and this led to a widespread expectation that concentration in Europe would converge on US levels once the Single Market took effect. However, Karsten (1996) cautioned that Europe was not fully comparable with the USA, insofar as skills were more dispersed, and the Single Market in Europe was evolving from an initially more fragmented structure. In the USA, on the other hand, the fundamental locational decisions were made at the start of the industrial revolution, in a market that was already integrated. In fact, concentration declined in the USA between 1947 and 1985. This, combined with the additional evidence of Kim (1995, 1997), led to the conclusion that regional concentration has been declining in the USA with the "high water mark of manufacturing location ... reached probably in the 1920's" (Krugman, 1991, p. 80).
• Conflicting evidence for Europe
In an investigation of eight countries (including the USA), Dollar and Wolff (1993) found that an equal number of industries were concentrating and de-concentrating between 1970 and 1986, although their main focus was on catching up and not on concentration. Bruelhart (1995) reported that 14 out of
18 industries were concentrating in Europe between 1980 and 1990. Labour intensive industries exhibited the highest dispersion, but they also showed significant potential for future concentration, while industries with high returns to scale were already concentrated. Amiti (1998) found that concentration increased in the majority of industries between 1976 and 1989, and that specialisation rose in six out often European countries. However, Dalum et al. (1998) and Laursen (1998) reported the contrary for exports.
• Technology, multinationality and quality ranges
In another strand of literature, Archibugi and Pianta (1992, 1994) found evidence of convergence in aggregate indicators of scientific and technological activity (e.g. R&D, and patent intensity). However, at the sector level, they found increasing technological specialisation. Similar results by Cantwell (1989) and Laursen (1998) raise the possibility that technological and sector specialisation might be moving in opposite directions. More generally, in a background study for this report,9 it was found that factor endowments have
become more similar over the past fifteen years. This seems to be driven by a catch-up of countries like Spain, Ireland, Finland and Denmark (by accumulating