www.esri.ie
Working Paper No. 302
June 2009
Understanding the Socio-Economic Distribution and
Consequences of Patterns of Multiple Deprivation:
An Application of Self-Organising Maps
Christopher T. Whelan*, Mario Lucchini**, Maurizio Pisati**
and Bertrand Maître***
Abstract: In this paper we apply self organising maps (SOM) to a detailed set of material deprivation indicators from the Irish component of European Union Community Statistics on Income and Living Conditions (EU-SILC). The first stage of our analysis involves the identification and description of sixteen clusters of multiple deprivation that allow us to provide a detailed account of such deprivation in contemporary Ireland. In going beyond this mapping stage, we consider both patterns of socio-economic differentiation in relation to cluster membership and the extent to which such membership contributes to our understanding of the manner in which individuals experience their economic circumstances. Our analysis makes clear the continuing importance of traditional forms of stratification relating to factors such as income, social class and housing tenure in accounting for patterns of multiple deprivation. However, it also confirms the role of acute life events and life cycle and location influences. It suggests that debates relating to the extent to which poverty and social exclusion have become individualized should take particular care to distinguish between different kinds of outcomes. Further analysis demonstrates that the SOM approach is considerably more successful than a comparable latent class analysis in identifying those exposed to subjective economic stress. This finding, combined with those relating to the role of socio-economic factors in accounting for cluster membership, confirms that a focus on a set of eight SOM macro clusters seems most appropriate if our interest lies in broad patterns stratification. For other purposes differentiation within clusters, which clearly takes a systematic form, may prove to be crucial.
Corresponding Author: [email protected]
*University College Dublin, ** Universitá degli Studi di Milano-Bicocca (Unimib) Milan, *** Economic and Social Research Institute
Understanding the Socio-Economic Distribution and
Consequences of Patterns of Multiple Deprivation:
An Application of Self-Organising Maps
Introduction
As knowledge of the increasing limitations of relying solely on income to measure
poverty and social exclusion has become more widespread, attention has been
increasingly focused on multi-dimensional approaches. Associated with this
development, non-monetary indicators are increasingly used in individual European
countries as well as at European Union level in measuring poverty and exclusion.
1
Particular attention has been devoted to the fact that low income may in fact be
unreliable as an indicator of poverty or social exclusion, failing in practice to identify
those experiencing deprivation and exclusion (Nolan and Whelan, 2007). However,
our attention here will be focused on the somewhat different concern that low income
may miss an important part of the picture, namely the multidimensional nature of
poverty and social exclusion.
Kakwani and Silber (2007: xv) identify the most important recent development in
poverty research as the shift from a uni-dimensional to a mult-dimensional approach.
Developments in this area can be viewed against the background of attempts to
implement Townsend’s (1979) understanding of poverty as exclusion from ordinary
living patterns, customs and activities because of resources that are substantially
below non-monetary indicators of deprivation have by now been used in various ways
in measuring poverty in many European countries.2
A major contribution to comparability in measuring deprivation at the European level
was provided by the inclusion of a substantial number of non-monetary indicators
covering a wide range of areas in the European Community Household Panel Survey
(ECHP) 1994-2001.3 The European Union Statistics on Income and Living Conditions
(EU-SILC) instrument includes a more limited but still substantial number of
1
Various measures of material deprivation have been also employed in studying poverty in the USA, e.g. Mayer and Jencks (1988, 1993) and Mayer (1997).
2
Pantazis et al, (2006) in the UK, Nolan and Whelan (1996) for Ireland, Muffels and Dirven (1998) with Dutch data, Halleröd (1996) for Sweden, Kangas and Ritakallio (1998) for Finland, Bohnke and Delhey (1999) for Germany, and Tsakloglou and Papadopoulos (1998) for Greece.
3
monetary indicators. In this paper we make use of the Irish component of EU-SILC
which includes a wider range of material deprivation items than the common
European module.
At the level of conceptualisation, the case for a multi-dimensional approach to
understanding what it means to be socially excluded is compelling. However, as
Nolan and Whelan (2007) argue, the value of a multidimensional approach needs to
be empirically established rather than being something that can be read off the
multidimensional nature of the concept. Approaches that produce higher rather than
lower dimensional profiles are not intrinsically superior. At this point, it seems to be
generally agreed that many unresolved conceptual and measurement issues remain in
the path of seriously implementing multidimensional measures in any truly
operational sense (Thorbecke, 2007). Grusky and Weeden (2007:33) set out the need
as to develop “a methodological platform” for analysing the shape and form of social
exclusion. In this paper we seek to contribute to this enterprise specifically in relation
to forms of material deprivation.
Comparing Approaches to Analysing Multiple Deprivation
In this paper our primary focus is on providing an assessment of the extent to which
an approach known as Self Organising Maps (SOM), utilizing an artificial neural
network algorithm developed by Kohonen in the early 1980s to extract meaningful
patterns from complex data and display them in an orderly fashion (Kohonen, 1982,
2001), can contribute to our understanding of the socio-economic distribution and
consequences of patterns of multiple deprivation. In order to achieve this objective,
we will make some key comparison between the outcomes of the SOM approach and
those deriving from the application of a latent class approach to the same set of
deprivation items.
Having provided a relatively non-technical account of the approach and the pattern of
differentiation it reveals in relation to multiple deprivation when applied to Irish data,
we will seek to assess the validity of the SOM typology and the implications of
decisions relating to levels of aggregation for our capacity to address substantive
sociological issues. Our particular focus will be on the contribution the SOM
influences in shaping patterns of deprivation and the manner in which individuals
experience their economic circumstances.
Our analysis will proceed as follows. In the section that follows we will provide
details of our data and the specific measures we employ. We then go on to provide an
overview of the SOM approach and a brief comparison with the latent class approach.
Having done so, we provide a brief description of the clustering outcomes deriving
form the application of this approach to the detailed set of deprivation items available
in the Irish EU-SILC instrument. Our analysis will then address issues relating to
levels of aggregation and the implications for understanding socio-economic
differentiation. It will be extended to provide an assessment of the impact of different
forms of multiple deprivation on subjective economic stress.
Data and variables
The data used in this paper are drawn from the 2004 wave of the Irish EU-SILC
survey, a voluntary annual survey of private households conducted by the Central
Statistics Office (CSO). In 2004, the total completed sample size was 5,477
households and 14,272 individuals (CSO, 2005). The analysis reported here refers to
all persons in the EU-SILC. Where household characteristics are involved these have
been allocated to each individual. The HRP is the one responsible for the household
accommodation and their characteristics have been attributed to all individuals in the
household.
Our analysis makes use of forty-two dichotomous indicators of life-style deprivation.
A confirmatory factor analysis of these forty-two items by Maître et al. (2006)
revealed the following relatively distinct deprivation dimensions:
1. Basic deprivation: eleven items relating to food, clothing, furniture, debt, and
minimal participation in social life.
2. Consumption deprivation: nineteen items relating to various forms of
consumption.
3. Housing facilities: four items regarding basic facilities such as bath, toilet etc.
4. Neighbourhood environment: five items concerning pollution, crime/vandalism,
noise, and deteriorating housing conditions.
5. Health status of the HRP: three items relating to overall evaluation of health
Details of the indicators comprising each of the dimensions are set out in Table 1.
Table 1: Indicators of life-style deprivation used in the analysis (N =14,219)
Indicator Description Prevalence (%)
Basic deprivation
4 Having friends or family for a drink or meal at least once a month 11.5 6 Eating meat chicken or fish (or vegetarian equivalent) every second day 3.7 7 Having a roast joint (or equivalent) once a week 4.8 8 Buying new rather than second-hand clothes 5.9 9 A warm waterproof overcoat for each household member 2.6 10 Two pairs of strong shoes for each household member 3.8 11 Replacing worn-out furniture 13.7 12 Keeping home adequately warm 3.1 13 Buying presents for family/friends at least once a year 4.5 32 A morning, afternoon, or evening out in the last fortnight for entertainment 9.9 33 Going without heating during the last 12 months 5.5
Consumption deprivation
5 Paying for a week’s annual holiday away from home in the last 12 months 23.4
14 A satellite dish 13.7
15 A video recorder 4
16 A stereo 4.5
17 A CD player 4.7
18 A camcorder 16
19 A personal computer 12.8
20 A washing machine 1.2
21 A clothes dryer 10.1
22 A dish washer 14.2
23 A vacuum cleaner 1.6
24 A fridge 2.3
25 A deep freeze 6.1
26 A microwave 2.4
27 A deep fat fryer 3.5
28 A liquidiser 6.7
29 A food processor 7.3
30 A telephone (fixed line) 5.9
31 A car 13.5
Housing deprivation
34 Bath or shower 1.1
35 Internal toilet 0.8
36 Central heating 9.4
37 Hot water 1.8
Neighbourhood environment deprivation
38 Leaking roof, damp walls/ceilings/floors/foundations, rot in doors, window frames
13.6
39 Rooms too dark, light problems 6 40 Noise from neighbours or from the street 12.2 41 Pollution, crime or other environmental problems 8.9 42 Crime, violence or vandalism in the area 14.8
Health status of the HRP:
1 General health problems 20.6
2 Chronic illness or condition 26.5 3 Limitation in usual activities for at least the last 6 months because of a
health problem
Self-organising maps and latent class analysis
A number of earlier efforts have employed latent class analysis to map patterns of
multi-dimensional material deprivation.4 The basic idea underlying such analysis is
that the associations between a set of categorical variables, regarded as indicators of
an unobserved typology, are accounted for by membership of a small number of
underlying classes. Latent class analysis assumes that each individual is a member of
one and only one of C latent classes and that, conditional on latent class membership,
the manifest variables are mutually independent of each other. The question arises as
to the extent to which such simplifying assumptions may influence our conclusions
and, in particular, conceal important within-cluster heterogeneity.
In contrast, the SOM approach involves minimal assumptions. The objective is to
produce a segmentation of individuals in terms of a wide range of indicators without
reducing the complexity of input to the clustering procedure. Essentially, what the
SOM algorithm does is to project a high-dimensional dataset X onto a lower
dimensional output space so as to represent X in a compact form and facilitate
identify its underlying structure. A SOM can be seen as a mathematical model that
helps to reduce the complexity of X by projecting it onto a lower dimensional output
space. This space corresponds to the SOM itself and, typically, takes the form of a
two-dimensional grid. Each grid cell is called a unit, or node, and can be regarded as a
pole specialized in attracting observations that possess certain combinations of
attributes; projecting X onto the SOM, then, amounts to allocating each observation i
to the unit that attracts it most. Formally, we say that the SOM partitions the input
space into m Voronoi regions, each of which corresponds to a specific SOM unit
k and attracts all the input vectors that are closer to its generating point than to
any other generating point. If properly realized, this partition is such that the Voronoi
regions that are close in the input space are also close in the output space, i.e., their
corresponding SOM units are spatially contiguous on the two-dimensional grid. This
property is called topology preservation and is one of the most appealing features of
SOMs, since it makes for a clearer and more accurate representation of the structure
of the input data. d
ℜ
k w
4
To sum up, projecting a d-dimensional dataset X onto a two-dimensional SOM
amounts to (a) computing the weight vectors associated with the m SOM units;
and (b) on the basis of these weights, allocating each observation i to its best matching
unit. To achieve this result, the SOM goes through a competitive learning process that
incrementally adjusts the weight vectors according to a set of rules aimed at
maximizing both the discriminatory power of the map and its degree of topology
preservation.
k w
The starting point of our analysis5 is a 14,219×42 matrix which we project onto a
two-dimensional SOM made of 432 units arranged in a 18×24 hexagonal lattice. To analyse the configuration of the trained SOM, we visually inspect its component
planes, a kind of specialized graph that illustrates the value taken by a given element
of the weight vector on each SOM unit. This is illustrated in relation to the item
relating to a personal computer in Figure 1. SOM units are classified into up to three
distinct groups: (a) black units ‘specialise’ in attracting ‘disadvantaged respondents’,
i.e., observations that take value 1 on the corresponding indicator; (b) grey units
‘specialise’ in attracting ‘advantaged respondents’, i.e., observations that take value 0
on the corresponding indicator; (c) white units have no clear-cut ‘specialisation’, i.e.,
attract a more or less balanced mix of observations of both types. The spatial
distribution of these three types of units on the two-dimensional grid describes the
configuration of the SOM in terms of the corresponding indicator. k
w
Figure 1: Inability to afford a personal computer
5
For relatively expensive consumer durables such as a PC, a typical pattern is that
represented by the component plane shown in Figure 1 (inability to afford a personal
computer). A tripartite division emerges with half or more of the SOM units being
neutral. Of the remaining units, the grey ones are slightly more frequent than the black
ones. While the latter tend to be clustered in the upper left-hand corner of the SOM,
the remaining units are more widely distributed. Other items, such as for example,
holidays are characterised by a more polarised pattern with a very modest
intermediate space. In contrast cheaper consumption items, such as a video recorder
exhibit a pattern whereby vast majority of SOM units belong to the ‘neutral’ (white)
category with is also a small cluster of ‘hot’ (black) units, i.e., units that attract a
disproportionate share of disadvantaged and no ‘cold’ (grey) units, i.e., units that
attract a number of disadvantaged respondents substantially lower than the average.
Visual inspection of the forty-two component planes associated with the SOM reveals
the fine structure of the underlying input space. Treating each SOM unit individually
would require dealing with an overwhelming level of detail. To address this issue, we
partition the output space (i.e., the 432 SOM units) into a smaller set of sufficiently
homogeneous regions (i.e., clusters of SOM units), using weight vectors as the
clustering variables (Vesanto and Alhoniemi, 2000; Wu and Chow, 2004) and the
hierarchical agglomerative average linkage method as the clustering algorithm
(Kaufman and Rousseeuw 1990). Based on careful inspection of the component
planes, experimentation and past experience (Lucchini et al., 2007), we opt for a
16-cluster solution that offers a reasonable balance between detail and parsimony.
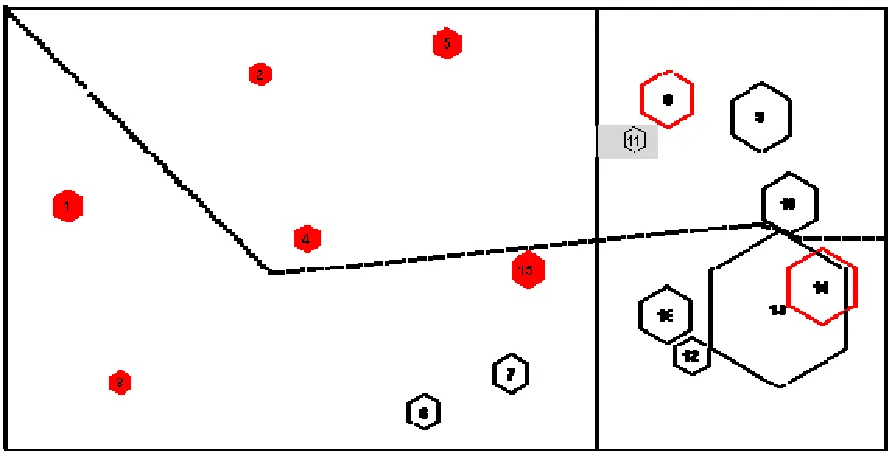
To aid interpretation, we project the sixteen clusters of SOM units onto a
two-dimensional space so as to maximize the correlation between the location of the
clusters in the data space and the location of the clusters in the plane; to this aim, we
use a classical metric multidimensional scaling algorithm (Torgerson, 1952) adjusted
ex post via a genetic algorithm (Mitchell, 1996). The results of this projection are
shown in Figure 2 where the size of each cluster is proportional to its prevalence, and
the Euclidean distance between clusters on the plane closely mirrors their Euclidean
distance in the data space. As we can see, clusters vary substantially in terms of both
Informed by consideration of the profile of the clusters on both the 42 deprivation
indicators and the synthetic deprivation dimensions distinguished earlier our
substantive interpretation of the sixteen clusters identified is set out below:
• Cluster 1 (Multiple deprivation least pronounced on health) is characterised
by a fairly uniform pattern of deprivation which is least severe in relation to
health. It comprises 1.8 per cent of the sample.
• Cluster 2 (Multiple deprivation least pronounced on household facilities) also
involves a relatively uniform pattern of deprivation that is more pronounced
than for cluster 1 in relation to health but somewhat less so with regard to
household facilities. It makes up 1.1 per cent of the sample.
• Cluster 3 (Multiple deprivation other than on health) is characterized by above
average deprivation in relation to all dimensions other than health but with the
scale being somewhat weaker for neighbourhood facilities than for the
remaining dimensions. This group comprises 1.1 per cent of the population. • Cluster 4 (Multiple deprivation least pronounced on basic and neighbourhood
environment) is distinctive primarily in relation to health, consumption and
housing facilities. It involves 1.0 per cent of the sample.
• Cluster 5 (Multiple deprivation least pronounced on consumption) is
distinguished from the foregoing clusters by a lower level of consumption
deprivation. It makes up 1.7 per cent of the sample.
• Cluster 15 (Multiple deprivation other than health with basic and household
facilities most pronounced) is made up of individuals displaying above
average deprivation in relation to basic and household facilities. In terms of
consumption enforced absence of a car is particularly prevalent. It involves 2.7
per cent of the sample
• Cluster 6 (Consumption deprivation with a high tech appliances emphasis) is
characterised by consumption deprivation which is particularly pronounced in
relation to hi-tech consumer durables and holidays. It comprises 2.4 per cent
of the sample.
• Cluster 7 (Consumption with basic and neighbourhood environment
secondary) is also differentiated from others in relation to consumer durables,
but high-tech items play less of a role. Neighbourhood environment joins basic
• Cluster 8 (Health and neighbourhood environment) exhibits a profile of
deprivation in relation to health and neighbourhood environment with
consumption and household facilities playing a secondary role. It is the largest
group up this point, involving 5.3 per cent of the sample.
• Cluster 11 (Health deprivation with consumption secondary) it involves a
combination of health and consumption deprivation. It is somewhat smaller
than the two previous clusters, making up 1.1 per cent of the sample.
• Cluster 9 (General health) is distinguished from the other groups almost
exclusively in terms of deprivation in relation to health. It comprises 7.8 per
cent of the sample.
• Cluster 10 (Chronic illness) is also characterised almost entirely by
deprivation in relation to health. In this case differentiation is less sharp and is
largely in relation to chronic illness. It includes 6.2 per cent of the sample.
• Cluster 14 (Neighbourhood environment) involves a pattern of minimal deprivation, with the crucial exception being in relation to neighbourhood
environment. It is a relatively large group making up 10.7 per cent of the
sample.
• Cluster 16 (Consumption deprivation involving holidays) is also characterised
by a pattern of minimal deprivation other than with regard to enforced absence
of a holiday. It includes 5.9 per cent of the sample. 6
• Cluster 12 (Minimal deprivation other than for specific high-tech consumption
items) is distinguished from cluster 13 almost entirely by deprivation in
relation to high-tech items and, most particularly, in relation to a CD player
and a satellite dish. It involves 2.7 per cent of the sample.
• Cluster 13 (Minimal deprivation) displays a uniformly low pattern of
deprivation. It is the largest group by far, comprising 46.2 per cent of the
sample.
6
Figure 2: Basic features of the SOM clusters
The vertical and horizontal lines in Figure 2 contribute to providing a graphical
summary of the above description. The dotted line separates the clusters characterised
by a substantial level of health deprivation (above the line) from the “healthy” clusters
(below the line). In turn, the solid (vertical) line separates the clusters exhibiting a
significant level of basic deprivation (left) from those that do not experience this form
of deprivation (right). The area of consumption deprivation coincides with that of
basic deprivation, with the addition of two small grey regions comprising clusters 8
and 11. Finally, black clusters are also characterised by a substantial degree of
deprivation in terms of both household facilities and neighbourhood environment;
when only the cluster outline is black, deprivation is limited to neighbourhood
environment. The SOM analysis thus provides a differentiated picture of the structure
of multiple deprivation in contemporary Ireland.
As we have seen, the SOM procedure produces a set of 16 clusters to which we can
attribute substantive meaning without great difficulty. However, many clusters
involve relatively small fractions of the sample. These relatively small Ns create some
difficulties in estimating multivariate multinomial models. In addition, the nature of
the distinctions between clusters varies considerably in their substantive significance.
In some cases clusters are defined by deprivation in relation to one or two highly
specific consumer durables while in other case they identify relatively broad and
substantive differences distinguishing clusters, we might expect that rather different
types of factors may prove to be effective in explaining some rather than other forms
of cluster differentiation. In particular, we might hypothesise that variables capturing
command over economic resources, such as income, social class and housing tenure
may play a very different role from those which influence preferences relating to
different forms of consumption and exposure to different types of deprivation such as
life-cycle stage and urban-rural location.
This distinction seems particularly important in light of the fact that increased
emphasis on de-standardisation or individualisation of the life cycle and a related
stress on life-events, together with increasing flexibility and precariousness in the
labour market and the changing role of the welfare state, has led some to suggest that
the impact of factors such as social class and indeed education on poverty and
inequality are declining (Beck, 1992).
With these distinctions in mind and guided by the results of the SOM analysis set out
in Figure 2, we proceed to aggregate the initial set of 16 categories into the following
8 macro clusters. We give priority given to combining clusters that are closest in
terms of that basic deprivation and consumption deprivation that earlier research has
shown to be most highly associated with resource variables such as income.
1. The first macro cluster combines micro clusters 1 and 3 involving uniform
multiple deprivation that is least pronounced on health. It comprises 2.9 per
cent of the sample.
2. The second aggregated cluster combines the original groups 2 and 4 and
involves multiple deprivation that is less pronounced on housing facilities and
neighbourhood environment. It involves 5.0 per cent of the sample
3. Micro clusters 5 and 15 are aggregated to produce the next macro cluster. It
involves multiple deprivation most pronounced for basic deprivation and
household facilities and accounts for 8.9 cent of the sample.
4. The next aggregation combines clusters 6, 7 and 16 and captures a variety of
forms of consumption deprivation. It captures 11.1 per cent of the sample.
5. Micro clusters 8 and 11 are collapsed in order to produce an aggregated cluster
that combines pronounced deprivation in relation to health aspect of
6. In contrast, the macro cluster resulting from the original clusters 9 and 10 is
defined entirely in terms of health deprivation. It makes up 14.0 per cent of
the sample
7. The next cluster is made up entirely of the original neighbourhood deprivation
group comprising 10.7 per cent of the sample
8. The final macro cluster, which we characterise as minimally deprived,
combines the original clusters 12 and 13 and accounts for 48.9 per cent of the
sample.
Socio-economic Differentiation within and between Macro Clusters
The overall hypothesis, guiding our subsequent analysis, is that the factors associated
with membership of the micro clusters within the macro clusters will be somewhat
different from those that discriminate between members of the latter clusters. A good
number of the measures of basic and consumption deprivation that we have employed
involve enforced deprivation of items that respondents wish to possess. Thus, reported
deprivation on a particular item will be influenced not only by resources but also
tastes. Absence of an item will not be counted as a deprivation unless the respondent
expresses a desire to possess the item or engage in the activity.
Authors, such as McKay (2004) and Dominy and Kempson (2006), have raised the
issue of the extent to which such responses are influenced by preferences or tastes as
opposed to adaptation to economic circumstances. The issue is not a simple one to
resolve. There clearly are differences across age groups and by factors such as
urban-rural location in the extent to which particular items are seen as necessary or desirable
and ideally we wish to take these into account. If older people place less value on
having a holiday it is reasonable to take this into account. On the other hand, even
where it is clear that they cannot afford certain activities, older people may be less
likely to indicate this if factors such as ill health make it more difficult for them to
engage in them. The evidence does suggest that simply focusing on absence leads us
to observe stronger relationships with income with the situation of older people
contributing to disproportionately to this outcome. However, given the potential
limitation of income in relation to older people, it is less obvious that conclusions
regarding the relationship between command over economic resources and enforced
For reasons of both tastes and constraints/opportunities, we anticipate that deprivation
in relation to specific items is likely to be particularly influenced by factors such as
life-cycle stage and urban–rural location. For other items, relating to health, housing
and neighbourhood and environment, we may again expect that the specific form of
such deprivations that are experienced will once again be influenced by life cycle and
location factors. At the same time, we would continue to expect that aggregate levels
of deprivation would be significantly related to factors tapping primarily command
over economic resources; as taste and need type factors average out across items.
Thus we anticipate that variation in location within macro cluster membership will
tend to be significantly influenced by life cycle stage and geographical location. On
the other hand, we expect that membership of macro clusters will be substantially
influenced by factors significantly associated with resources such as income social
class, housing circumstances and life events such as lone parenthood and marital
disruption. Life cycle and geographical location may also be expected to play a
significant, although lesser and somewhat more variable, role.
In Table 2 we set out the results of a multinomial regression showing the relationship
between membership of the 8 macro clusters and the range of socio-economic
variables comprising household and household reference person characteristics.7
These include equivalent income quintile, an aggregated version of the ESeC class
schema, marital status, lone parenthood. urban-rural location, housing tenure and age
group. Other potential influences were shown to have significant gross effects but
contributed little once the variables currently included in the equation were taken into
account.8 Given the cross-sectional nature of the data, the patterns of socio-economic
economic differentiation will involve reciprocal influences, as between income and
health. However, we have chosen our independent variables so as to ensure, as far as
possible, that the direction of influence is predominantly from socio-economic
attributes to forms of multiple deprivation.
7
In all subsequent multivariate analysis standard errors have been calculated to allow for clustering of individuals in households.
8
Table 2 : Multinomial 8-Cluster SOM by Socio-Demographic Characteristics (Reference Group Clusters 12 &13)
Clusters 1 & 2 Clusters 3 & 4 Clusters 5 & 15 Clusters 6 & 7 & 16 Clusters 8 & 11 Clusters 9 & 10 Cluster 14
Odds Ratio Sig
Income
Bottom Quintile 519.021 *** 67.213 *** 26.665 *** 11.830 *** 7.942 *** 2.403 *** 1.258
Quintile 2 245.432 *** 46.277 *** 21.120 *** 12.548 *** 5.261 *** 1.781 *** 1.068
Quintile 3 45.130 *** 15.980 *** 6.148 *** 6.271 *** 2.298 *** 1.151 0.772
Quintile 4 18.311 ** 1.221 1.883 3.739 *** 1.792 1.026 1.091
Social Class
Farmers 0.419 0.148 ** 0.510 1.536 0.252 *** 0.904 0.721
Petit Bourgeoisie 1.319 1.976 1.527 1.166 0.786 1.108 1.041
Higher non-manual 2.189 2.440 * 2.044 1.237 1.506 1.469 ** 1.048
Lower grade non-manual 1.697 3.061 ** 1.527 2.243 *** 1.372 1.286 0.946
Semi-non skilled 2.672 * 2.608 1.839 2.167 *** 2.322 *** 1.153 0.938
Marital Status
Single 3.527 *** 1.689 2.156 ** 1.539 ** 1.248 1.451 ** 0.569
Widowed 1.786 3.048 *** 1.160 1.721 1.631 1.570 ** 0.039
Separated/divorced 2.218 * 1.849 3.199 *** 1.326 1.372 1.245 0.268
Lone parent 1.318 5.014 *** 1.221 2.140 *** 1.645 0.772 0.438
Tenure
Public sector owner 1.722 2.128 2.942 * 1.281 1.156 0.877 0.889
Private tenant 3.145 ** 3.858 *** 2.532 ** 2.011 *** 0.990 0.798 0.647 *
Public sector tenant 5.683 * 2.673 6.426 ** 5.448 *** 8.116 *** 3.141 ** 1.235
Urban 0.697 0.608 1.340 0.669 ** 1.152 0.862 2.400 ***
Public sector tenant*Urban 1.653 5.541 * 1.066 0.811 0.343 0.506 2.158
<29 1.757 0.118 *** 1.852 2.905 *** 0.081 *** 0.122 *** 1.591
30-49 4.006 *** 0.403 ** 1.705 2.540 *** 0.230 *** 0.200 *** 1.571 **
50-64 5.072 1.309 2.532 *** 2.283 *** 0.638 *** 0.515 *** 1.845 ***
Nagelkerke R2 0.373
Reduction in Log Likelihood Ratio 5.806.3
Df 147
N 12, 992
From Table 2 we can see that membership of the macro clusters is most sharply
differentiated by equivalent income quintile. Taking cluster 8 as the reference
category, we find that the odds on being in cluster 1 - characterised by multiple
deprivation that is least pronounced on health - is over 500 times higher for those in
the bottom rather than the top cluster. This declines to 245 for the second quintile to
45 for the third and 18 for the fourth. Thus membership of this cluster is profoundly
influenced by position in the income distribution. Other factors play a significant but
considerable more modest role. In comparison with the professional and managerial
class, farmers are only half as likely to be found in this cluster. All other classes are
more likely to be found here with the odds ratio ranging from 1.3 for the petit
bourgeoisie to 2.7 for the semi-no skilled manual class.9 Odds are also higher for
those who are not married - ranging from 1.8 for widowed to 3.5 for single. A modest
effect is also observed for lone parents. In relation to housing tenure, private home
owners enjoy a significant advantage. The odds of being in cluster 1 are 1.7 times
higher for public sector owners, 3.1 times for private tenants. For each of these groups
a rural location reduces the odds by 0.7. For public sector tenants, on the other hand, it
is necessary to take into account of the manner in which location and tenure interact.
If private home owners in rural areas are taken as the benchmark, public sector tenants
are 5.7 times more likely to be found in cluster 1. For urban public sector tenants this
rises to 6.5 and they are 9.4 times more likely to be located there in comparison with
urban owners.10 Finally, a curvilinear relationship with age is observed. The lowest
risk is observed where the HRP is 65 or over. It increases by a factor of 1.8 for those
under 30 before rising to 4.0 and 5.1 respectively for those 30-49 and 50-64.
Overall those found in cluster 1 are particularly likely to be in low income
households. They are also more likely to be drawn from households in which the
reference person is middle aged non-married and not in the professional-managerial or
farming classes. They are less likely to be private home owners or live in rural areas.
Being a public sector tenant, particularly when combined with being in an urban area,
is associated with a sharp increase in risk level.
9
The gross effects are substantially higher with the odds ratio for the comparison of the professional and managerial classes reaching 7.3
10
Turning to cluster 2 - involving multiple deprivation that is least pronounced on
housing facilities - we again observed a substantial impact for income with the odds
gradually declining from 67.2 to 1.2 as we move from the bottom to the fourth
quintile. Farmers are even less likely to be found in this cluster than in cluster 1 with
an odds ratio of 0.14. Class differentials are also greater for the remaining classes
with the odds ratios ranging from 2 for the petit bourgeois to 3 for the lower grade
non-manual. Not being married again raises the risk but in this case the strongest
effect is for being widowed with an odds ratio of 3. The impact of lone parenthood is
considerably greater than in the previous case with the odds ratio reaching 5.0. Rural
residents and home owners enjoy comparable advantages to those prevailing for
cluster 2. However, the pattern of interaction between public sector tenure and urban
location is rather stronger. On this occasion the gap between tenants and private home
owners is less in rural areas with an odds ratio of 2.7 while in urban areas it is wider
with the corresponding value being 15. In contrast with cluster 1, where the HRP is
aged less than 30, individuals are least likely to be found in this cluster as reflected in
an odds ratio of 0.12. This figure rises to 0.4 for the 30-39 category and to 50-64 to
1.3. Overall, this cluster shows more moderate but still substantial differentiation in
relation to income and stronger effects in relation to lone parenthood and urban public
sector tenure.
Macro cluster 3 is characterized by multiple deprivation that is most pronounced in
relation to basic deprivation and household facilities. Income is once again the most
important differentiating factor but its discriminatory power is significantly less than
in case of cluster 2 with the odds ratios declining from 26.7 for the bottom quintile to
1.9 for the fourth. The impact of social class and marital status is broadly similar to
cluster 1 as are the effects of being a public sector home owner or private tenant.
However, on this occasion urban respondents have slightly higher risk level and the
odds ratio of 6.4 relating to public sector tenure applies uniformly across urban and
rural locations. As with cluster 1, those in households where the HRP is 65 or over are
least likely to be found here but the effect is more modest with the odds ratios going
from 1.7 to 2.5.
Macro cluster 4 is characterized by consumption deprivation. Income remains
important but the pattern of differentiation is a good deal more modest. Little
from 12.5 for the latter to 3.7 for the bottom quartile. On this occasion farmers have a
slightly higher risk level than the professional and managerial class and the impact for
the petit bourgeoisie and the higher non-manual class are weaker then heretofore.
Non-married groups and lone parents suffer modest disadvantages. Rural respondents
are generally slightly less likely to be found in this category. However, the pattern of
interaction between public sector tenure and location is rather different than in the
earlier cases with the impact of the former being greater in rural locations on this
occasion. Such tenants have risk levels that are 5.4 times higher than comparable
home owners while the comparable urban figure is 4.41. Comparing public sector
tenants in rural and urban areas, the latter are 1.8 times more likely to be found in
cluster 4. The major age contrast relates to the 65 versus all other with the odd ratio
for the remaining groups declining from 2.9 to 2.2 with increasing age.
Focusing on cluster 5 which involves health deprivation in combination with forms of
deprivation other than basic, we observe a further weakening of the impact of income
with the odds ratio going from 7.9 to 1.8. The effects for class are broadly similar to
those observed earlier with farmers being even less likely to be found in this cluster.
Effects for marital status and lone parenthood are rather modest. The pattern in
relation the combined effects for tenure and location is quite different to those
observed thus far. With regard to the former, the only significant contrast is between
public sector tenants and all others. For the latter, urban-rural location has little
impact. In contrast for public sector tenants location makes a considerable difference
on this occasion. The risk level for the rural group is 8.1 times higher than for
comparable home owners and 2.5 times higher than for their urban counterparts. The
impact of HRP age is substantially sharper than for the earlier cluster. The risk level
for the youngest age group is 12.3 times lower than for the oldest. For the remaining
groups the respective odds ratios are 4.3 and 1.6. Overall those in households with
older HRPs, in rural public sector rented accommodation with lower incomes are most
likely to be found in macro cluster.
Macro cluster 6 is distinguished by deprivation in relation to health. Income effects
are rather weak with the odds ratios going from 2.4 for the bottom quintile to 1.0 for
the fourth. Class effects are extremely modest and marital status risk levels are similar
to those observed earlier. Lone parents are marginally less likely to be found in this
tenants whose relative risk level is three times higher than for home owners. For urban
public sector tenants this falls to 1.6. The most powerful differentiating factor is once
again the age of the HRP. The relative risk level for the youngest age group is 8.2
times lower than for the oldest. For the intermediate groups it declines to 5.0 and 1.9.
Cluster 6 is distinguished from Cluster 5 by the weaker role of income, social class,
lone parenthood and public sector tenancy particularly in its rural form.
For macro cluster 7, which is distinguished solely by deprivation in relation to
neighbourhood environment, income and class have little effect. In contrast with all of
the earlier clusters, individuals in households where the HRP is married are
significantly more likely to be found in this cluster. Their relative risk is 1.8 times
higher than for the single group, 3.7 times that for the divorced/separated and 25 times
greater than for the widowed. In interpreting these results, it is necessary to keep in
mind the distinctively insulated form of deprivation involved here. Membership of
this cluster is also slightly higher for private home owners than for their public sector
counterparts and private tenants. For those other than public sector tenants, an urban
location raises the odds of group membership by 2.4. For public sector tenants this
rises to 5.2. Finally, those in households where the HRP is 65 and over are somewhat
less likely to be found in this cluster. The members of this group seem to comprise
public sector tenants who are not sharply differentiated in terms of income and
married private urban home owners who have probably made choices that involve off
setting the experience of this particular form of disadvantage against other attractions
of the particular urban environments in which they are located.
As we have seen, there is a clear hierarchy in terms of the impact of income on
cluster membership in relation to the macro clusters. The extent to which it
distinguishes members of a cluster from those in the minimally deprived cluster
declines as one moves from cluster 2 to cluster 7. The impact of factors such as class,
marital status and lone parenthood operate somewhat more uniformly across the forms
of multiple deprivation captured in cluster 1 to 3. Public sector tenancy is consistently
related to forms of multiple deprivation and consumption deprivation but the manner
in which it interacts with urban location varies across clusters. Similarly, while there
is a significant tendency for those in middle aged households to be more exposed to
multiple deprivation and consumption deprivation, this expectation is reversed in
substantial impact. For cluster 5, combing health with housing facilities and
neighbourhood environment, income is still as significant factor but rather less so than
life cycle stage and rural public sector tenancy. The latter factors also play a
distinctive role in relation to membership of cluster 6 relating solely to health
deprivation. Finally, neigbourhood environment deprivation, detached from other
forms, is influenced by a distinct set of influences.
Shifting our focus to differentiation within macro clusters, in Tables 3 and 4 we show
the impact of age group and urban-rural location. The findings show that in terms of
micro cluster membership urban location is associated with greater likelihood of
being located in 1 v 3, 2 v 4, 5 v 15, 6 v 7, 6 v 16. The odds ratios vary from 2.3 to
3.7. In contrast for 8 v11 the odds ratio is 0.32 and for 9 v 10 and 12 v 13 it plays no
significant role. In terms of life cycle effects, for 1 v 3 the major contrast is between
the case where the HRP is 65 or over and all others. In contrast for 2 v 4 a positive age
gradient is observed and for 8 v 11 and 9 v 10 similar but less pronounced
relationships are found. In contrast, for the comparison involving 5 v 15 the age effect
is in the opposite direction. While we do not intend to operate detailed interpretations
of these effects they do appear to entirely consistent with the impact of both tastes and
the opportunities and constraints associated with particular locations and life cycle
Table 3: Logistic Regression within Macro SOM Clusters (Other than Consumption) by Urban-Rural Location and HRP Age Group
Cluster 1 v 3 Cluster 2 v 4 Cluster 5 v 15 Cluster 8 v 11 Cluster 9 v 10 Cluster 12 v 13 Odds
ratio
Sig> Odds ratio
Sig> Odds ratio
Sig> Odds ratio
Sig> Odds ratio
Sig> Odds ratio
Sig>
Urban 3.711 ** 3.187 ** 2.327 0.320 *** 1.279 1.027
<29 3.854 66.928 *** 1.132 13.058 ** 7.513 *** 0.569
30-49 3.643 * 36.183 *** 2.658 1.957 2.151 *** 1.914 *
50-64 2.947 7.444 *** 10.870 1.307 1.439 * 1.418
Nagelkerke R2 0.151 0.482 0.191 0.099 0.048 .011
Reduction in Log Likelihood Ratio
48.2 132.9 113.4 56.8 73.0 25.8
Df 4 4 4 4 4 4
N 384 326 719 1,026 2,172 6,670
*** p<0.01, ** p<0.05, * p<0.1
Table 4: Multinomial Regression within Macro SOM Consumption Cluster (6,7,16)by Urban-Rural Location and HRP Age Group
Cluster 16 v 6 Cluster 7 v 6
Odds ratio Sig. Odds ratio Sig.
Urban 2.284 ** 1.033
<29 2.854 * 2.351
30-49 2.649 ** 0.971
50-64 5.966 *** 0.545
Nagelkerke R2
Reduction in Log Likelihood Ratio 150.6
[image:21.595.64.796.319.469.2]Multiple Deprivation and Economic Stress
In order to further develop our understanding of the patterns of multiple deprivation
revealed by the SOM analysis, in this section we examine the extent to which
individuals’ experience of economic stress is affected by their cluster membership. In
pursuing this issue we make use of two subjective indicators. The first item captures
whether an individual is located in a household that is “experiencing difficulty in
making ends meet” where we distinguish individuals in households experiencing
“great difficulty” or “difficulty”. The second item identifies individuals living in
households that are unable to cope with unanticipated expenses. We have combined
these items to form a scale of economic stress that runs from 0 where none of these
problems is experienced to 2 where both apply.
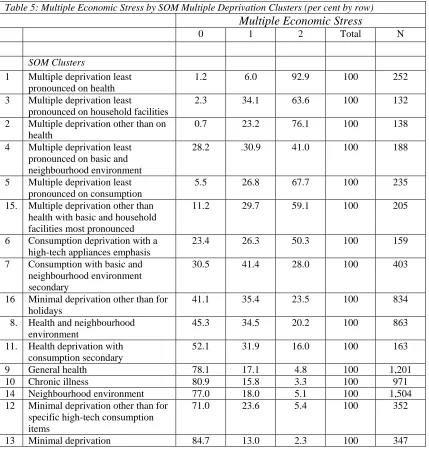
In assessing the extent to which the SOM typology discriminates in relation to such
experiences, we need to take into account both absolute and relative stress levels. In
Table 5 we show the breakdown of levels of multiple economic stress across the
detailed SOM clusters. The number experiencing both forms of stress goes from 92.9
per cent in the cluster 1 characterised by multiple deprivation that is least pronounced
on health to 2.3 per cent for cluster 13 involving minimal deprivation. Conversely, the
number experiencing neither form of stress goes from 1.2 to 84.7 per cent for the
same clusters. For the six clusters identifying forms of multiple deprivation a
substantial majority report multiple economic stress with the figure ranging from 92.9
to 59.1 per cent. Within this group, the ranking is broadly in line with our earlier
findings regarding the relationship between income and clusters membership. Within
such clusters, a pattern of differentiation emerges whereby economic stress levels are
somewhat lower for clusters where health plays a more prominent role.
Outside the multiple deprivation clusters, the highest level of economic stress is found
for cluster 7 involving consumption deprivation with a high tech emphasis where the
figure is 50.3 per cent. For the other forms of consumption deprivation associated
with clusters 7 and 16, the relevant figure falls to 28.0 and 23.5 per cent respectively.
For clusters 8 and 11, which combine health deprivation with neighbourhood
environment deprivation and consumption, multiple stress level falls to 20.2 and 16
per cent respectively. Finally, for the remaining five clusters the levels decline
Table 5: Multiple Economic Stress by SOM Multiple Deprivation Clusters (per cent by row)
Multiple Economic Stress
0 1 2 Total N
SOM Clusters
1 Multiple deprivation least pronounced on health
1.2 6.0 92.9 100 252
3 Multiple deprivation least
pronounced on household facilities
2.3 34.1 63.6 100 132
2 Multiple deprivation other than on health
0.7 23.2 76.1 100 138
4 Multiple deprivation least pronounced on basic and neighbourhood environment
28.2 .30.9 41.0 100 188
5 Multiple deprivation least pronounced on consumption
5.5 26.8 67.7 100 235
15. Multiple deprivation other than health with basic and household facilities most pronounced
11.2 29.7 59.1 100 205
6 Consumption deprivation with a high-tech appliances emphasis
23.4 26.3 50.3 100 159
7 Consumption with basic and neighbourhood environment secondary
30.5 41.4 28.0 100 403
16 Minimal deprivation other than for holidays
41.1 35.4 23.5 100 834
8. Health and neighbourhood environment
45.3 34.5 20.2 100 863
11. Health deprivation with consumption secondary
52.1 31.9 16.0 100 163
9 General health 78.1 17.1 4.8 100 1,201 10 Chronic illness 80.9 15.8 3.3 100 971 14 Neighbourhood environment 77.0 18.0 5.1 100 1,504 12 Minimal deprivation other than for
specific high-tech consumption items
71.0 23.6 5.4 100 352
13 Minimal deprivation 84.7 13.0 2.3 100 347
At this point we shift our focus to relativities in relation to economic stress and in
Table 6 we present the results deriving from a set of ordered logistic regressions.
Equation (i) looks at the impact of SOM cluster membership. The full set of dummies
produces a Nagelkerke R2 0.380 and leads to a reduction in the log likelihood ratio of
5,284.2for 15 degrees of freedom. By far the largest odds ratio of 393 is observed for
cluster involving multiple deprivation that is least pronounced on health. It is followed
by cluster 2 involving multiple deprivation other than health with a value of 93. For
multiple deprivation clusters 3, 5 and 15 it ranges between 53 and 63 while for cluster
4 it falls to 22. For the consumption clusters it declines from 25 to 8 as one goes from
deprivation on other dimensions, the odds ratio declines to 7 and 5 respectively.
Finally for the remaining clusters it does not rise above 2.
The SOM typology of multiple deprivation succeeds in distinguishing groups a
substantial majority of whom are experiencing multiple economic stress and in
providing a differentiated pattern in relation to relative risk of such stress. Further
analysis shows that the vast bulk of such differentiation relates to variation between
the eight macro SOM clusters identified earlier. Moving from the 8 to the 16 category
classification increases the Nagelkerke R2 by 0.015 and reduces the log likelihood
ratio by 236.4 for 8 degrees of freedom. Further differentiation within these macro
clusters may be related to between group differentiation in terms of income, age and
urban-rural location. However, the general pattern remains even when controlling for
these factors. It appears that different patterns of deprivation have somewhat different
consequences for economic stress and that in, particular, forms of health deprivation
that are relatively isolated from other forms of deprivation have modest effects on
economic stress.
As a final test of the discriminatory power of the SOM typology we proceed to
compare its ability to identify those experiencing economic stress in comparison with
the latent class typology referred to earlier. Whelan and Maître (2007) found that for
the 42 items utilized in our SOM analysis the best fitting latent class solution involved
4 latent classes which they labeled as follows.
1. Maximally Deprived incorporating 6.8 per cent of the sample.
2. Deprived in terms of current living standards involving 6.2 per cent of the
sample.
3. Health and Housing Deprived. This group makes up 4.5 per cent of the
sample.
4. Minimally Deprived on all 5 dimensions. This comprises 82.6 per cent of the
sample.
From equation (ii) in Table 6, we can see that the set of dummies defining this
variable produces a Nagelkerke R2 of 0.268 and reduces the log likelihood ratio by
3,525.8 for 3 degrees of freedom. The highest odds ratio of 24 relates to the
consumption and the maximal deprivation clusters.. The value then falls sharply to 2
class variables and this produces a Nagelkerke R2 of 0.395 and reduces the log
[image:25.595.85.514.131.670.2]likelihood ratio by 5,557.5 for 18 degrees of freedom.
Table 6: Ordered Logit of Economic Stress with SOM Macro Clusters and Latent Class Clusters
Odds Ratio Sig Odds Ratio Sig Odds Ratio Sig SOM Clusters
1 Multiple deprivation least pronounced on health
392.977 *** 115.024 ***
3 Multiple deprivation least
pronounced on household facilities
63.198 *** 18.061 ***
2 Multiple deprivation other than on health
93.511 *** 28.156 ***
4 Multiple deprivation least pronounced on basic and neighbourhood environment
22.444 *** 8.047 ***
5 Multiple deprivation least pronounced on consumption
79.315 *** 28.239 ***
15. Multiple deprivation other than health with basic and household facilities most pronounced
52.915 *** 30.838 ***
6 Consumption deprivation with a high-tech appliances emphasis
25.423 *** 15.630 ***
7 Consumption with basic and neighbourhood environment secondary
13.627 *** 7.982 ***
16 Minimal deprivation other than for holidays
7.846 *** 7.305 ***
8. Health and neighbourhood environment
6.817 *** 5.190 ***
11. Health deprivation with consumption secondary
4.530 *** 3.784 ***
9 General health 1.808 *** 1.724 ** 10 Chronic illness 1.523 *** 1.525 ** 14 Neighbourhood environment 1.940 *** 1.890 *** 12 Minimal deprivation other than for
specific high-tech consumption items
2.464 *** 2.436 ***
Latent Class Clusters
1 Maximal 23.905 *** 3.438 ***
2 Current Lifestyle 24.422 *** 4.009 *** 3 Health & Housing 2.044 *** 1.347
Ref: Maximal
Nagelkerke R2 0.380 0.268 0.395 Reduction in Log Likelihood Ratio 5,284.261 3,525.84 5,557.504
Df 15 3 18
N 14,230
*** p<0.01, ** p<0.05, * p<0.1
Entering the latent class variable after the SOM typology increases the Nagelkerke R2
of 0.015 and reduces the log likelihood ratio by for 273.2 degrees of freedom. In
likelihood ratio by 2,031.7 for 15 degrees of freedom. The SOM typology clearly
offers substantial additional discriminatory capacity. This conclusion is confirmed by
an examination of the net coefficient. The odds ration for SOM cluster 1 is 115 and
four of the six multiple deprivation clusters have values above 20. For the latent class
maximal and current living conditions clusters the net coefficients fall to 3 and 4
respectively.
Conclusions
In this paper we have sought to contribute to recent efforts to develop and apply
appropriate methodological tools for the multidimensional analysis of poverty and
social exclusion. As we have argued, despite the compelling conceptual case for a
multidimensional approach its value needs to be empirically established. Our
particular focus has been on multi-dimensional deprivation and the extent to which
the SOM approach, by allowing us to extract meaningful patterns from complex data
and display them in an orderly fashion, can advance our understanding of such
deprivation. Our analysis has involved a number of stages. The first has involved the
identification and description of sixteen clusters or profiles of multiple deprivation
that allow us to provide a detailed account of such deprivation in contemporary
Ireland.
In seeking to go beyond this mapping stage we have considered both patterns of
socio-economic differentiation in relation to cluster membership and the extent to
which such membership contributes to our understanding of the manner in which
individuals experience their economic circumstances. In pursuing these goals, it has
been necessary to take into account both the advantages and limitations of the SOM
approach. As we have seen, while minimising the need for a priori assumptions, the
SOM approach allows us to identify and visualise complex patterns of differentiation
and capture important distinctions that may be concealed within more aggregated
typologies such as those that have typically emerged from latent class analysis of
deprivation patterns. However, while the SOM approach achieves an enormously
parsimonious reduction of the complexity of the original input relating to complex
deprivation profiles relating to large numbers of individuals, it presents us with
formidable post hoc problems of interpretation. Informed by an understanding of
between clusters have varying substantive significance and likely to be accounted for
by somewhat different socio-economic influences.
Pursuing this logic we distinguished between influences such as income, social class,
acute life events and housing tenure that are likely to capture command over
economic resources and factors such as life cycle stage and urban-location that may
reflect both tastes and preferences and non-economic restrictions or facilitation of
particular forms of consumption or activities. Of course any such distinction is an
over simplification and the distinction is a relative rather than an absolute one.
However, guided by it we proceeded to aggregate the original 16 SOM micro clusters
into a set of 8 macro clusters. An analysis of the factors discriminating between these
clusters, revealed a striking reduction in the importance of resource related variables
as one moves from the more to the less extreme forms of multiple deprivation, to
consumption deprivation, forms of health deprivation accompanied by secondary
aspects of other dimensions, relatively pure forms of health deprivation,
neighbourhood environment deprivation and finally minimal deprivation. Other
factors such as lone parenthood, marital status, housing tenure and its interaction with
urban-rural location impact on some forms of multiple deprivation than on others.
Similarly, while there is a clear tendency for older people to be relatively insulated
from multiple deprivation, specific forms of such deprivation are associated with
different distributions across the life cycle. The extent to which health deprivation is
an important element in defining a cluster is obviously a crucial element and for the
health cluster life cycle stage takes on a crucial significance.
Focusing on the macro clusters, while highly revealing in terms of resource related
variation in patterns of multiple deprivation, obscures within cluster variation that
may prove extremely significant from other perspectives. A consideration of
differentiation within macro clusters reveals the important role of life cycle factors
and urban-rural location. The role of health elements is important once again but so
too it appears are tastes/preferences and constraints/opportunities in relation to
specific forms of consumption and activities.
Our analysis make clear the continuing importance of traditional forms of
stratification relating to factors such as income, social class and housing tenure in
acute life events and life cycle and location influences. It suggests that debates
relating to the extent to which poverty and social exclusion have become
individualized should take particular care to distinguish between different kinds of
outcomes.
Switching our attention to the consequences of forms of multiple deprivation, our
analysis showed that while differentiation was evident across the 16 cluster SOM
typology in levels of economic stress, the vast bulk of such variation was accounted
for by membership of the 8 macro clusters. Finally a comparison of results deriving
from the SOM approach with those resulting from a comparable latent class analysis
revealed that the former was considerably more efficient in identifying those exposed
to multiple economic stress. This finding, combined with the earlier evidence relating
to the role of socio-economic factors in accounting for cluster membership, confirms
that if our interest lies in broad patterns stratification a focus on the SOM macro
clusters seems most appropriate. For other purposes differentiation within clusters
which clearly takes a systematic form may prove to be crucial.
Our analysis provides considerable evidence that a theoretically informed application
of the SOM approach has considerable potential in advancing our understanding of
patterns of multiple deprivation, their socio economic distribution and the manner in
which they are experienced.
Acknowledgements
This paper forms part of activities undertaken by the authors as participants in the
Economic Change, Quality of Life and Social Cohesion (EQUALSOC) network of
Excellence funded by the European Commission (DG Research) as part of the Sixth
framework Programme, and as part of a research programme on “The Impact of the
‘New Economy’ on the Labour Market, Inequality, Poverty and Well-being in
Ireland“ funded by the Irish Research Council for the Humanities and Social Sciences
References
Allinson, Nigel, Yin, Huyun, Allinson, Lesley, Slack, Jon (Eds.), 2001. Advances in
Self-Organising Maps. Springer, Berlin.
Central Statistics Office, 2005. EU Survey on Income and Living Conditions
(EU-SILC); First Results 2003, Statistical Release 24 January, SO: Dublin/Cork.
Dewilde, Caroline, 2004. The multidimensional measurement of poverty in Belgium
and Britain: A categorical approach. Social Indicators Research 68, 331-369.
Dewilde, Caroline, 2008. Multdimensional poverty in Europe: Institutional and
individual determinants. Social Indicators Research, 83, 233-256.
Dominy, Nicola, Kempson, Elaine, 2006. Understanding Older People’s Experiences
of Material Deprivation. UK Department of Work and Pensions, Research Report No.
363.
Eurostat (2000), European Social Statistics: Income Poverty & Social Exclusion (1st
Report), Office for Official Publications of the European Communities: Luxembourg.
Eurostat (2003), European Social Statistics: Income Poverty and Social Exclusion (2nd
Report), Office for Official Publications of the European Communities, Luxembourg
Gordon, D. Adelman, L., Ashworth, K., Bradshaw, J., Levitas, R., Middleton, S.,
Pantazis, C., Patsios, D., Payne, S., Townsend, P. and Williams, J. (2000), Poverty
and Social Exclusion in Britain, Joseph Rowntree Foundation: York.
Grusky, David B., Weeden, Kim A., 2007. Measuring poverty: The case for a
sociological approach. In: Kakawani, N., Silber, J. (Eds.), The Many Dimensions of
Poverty. Palgrave Macmillan, Basingstoke.
Halleröd, B. (1995), ‘The Truly Poor: Direct and Indirect Measurement of Consensual
Halleröd, Björn, 2006. Sour grapes: Relative deprivation, adaptive preferences and the
measurement of poverty. Journal of Social Policy 35, 371-390.
Kakwani, Nanak, Silber, Jacques, 2007. Introduction. In: Kakwani, N., Silber, J.
(Eds.), The Many Dimensions of Poverty. Palgrave Macmillan, Basingstoke.
Kaufman, Leonard, Rousseeuw, Peter J., 1990. Finding Groups in Data: An
Introduction to Cluster Analysis. Wiley, New York.
Kohonen, Teuvo, 1982. Self-organized formation of topologically correct feature
maps. Biological Cybernetics 43, 59-69.
Kohonen, Teuvo, 2001. Self-Organizing Maps, third ed. Springer, Berlin.
Lucchini, Mario, Sarti, Simone, 2005. Il benessere e la deprivazione delle famiglie
italiane: un approccio multidimensionale e multilivello. Stato e mercato 74, 231-265.
Lucchini, Mario, Pisati, Maurizio, Schizzerotto, Antonio, 2007. Stati di deprivazione e
di benessere nell’Italia contemporanea: Un’analisi multidimensionale. In: Brandolini,
A., Saraceno, C. (Eds.), Povertà e benessere: Una geografia delle disuguaglianze in
Italia. il Mulino, Bologna, pp. 271-303.
Mayer, S. and Jencks, C. (1989), ‘Poverty and the Distribution of Material
Hardship’, Journal of Human Resources, vol. 24, no. 1, pp. 88-114.
Mayer, S., (1993). “Living Conditions Among the Poor in Four Rich Countries”,
Journal of Population Economics, 6, 261-86.
Maître, Bertrand, Nolan, Brian, Whelan, Christopher T., 2006. Reconfiguring the
Measurement of Deprivation and Poverty in Ireland, Economic and Social Research
McKay, Stephen, 2004. Poverty or preference: What do ‘consensual deprivation
indicators’ really measure?. Fiscal Studies 2, 201-223.
Mitchell, Melanie, 1996. An Introduction to Genetic Algorithms. The MIT Press,
Cambridge, MA.
Moisio, Pasi, 2004. A latent class application to the multidimensional measurement of
poverty, Quantity and Quality 38, 703-717.
Nolan, Brian, Whelan, Christopher T., 2007. On the multidimensionality of poverty
and social exclusion. In: Micklewright, J., Jenkins, S. (Eds.), Poverty and Inequality:
New Directions. Oxford University Press, Oxford.
Pantazis, C., D. Gordon and R. Levitas eds. (2006) Poverty and Social Exclusion in
Britain: The Millennium Survey, Policy Press, Bristol
Sen, Amartya, 2000. Social Exclusion: Concept, Application and Scrutiny. Social
Development Papers No. 1, Office of Environment and Social Development, Asian
Development Bank, Manila.
StataCorp, 2007. Stata Statistical Software: Release 10. StataCorp LP, College
Station, TX.
Thorbecke, Erik, 2007. Multidimensional poverty: Conceptual and measurement
issues. In: Kakwani, N., Silber, J. (Eds.), The Many Dimensions of Poverty. Palgrave
Macmillan, Basingstoke.
Torgerson, Warren S., 1952. Multidimensional scaling: I. Theory and method.
Psychometrika 17, 401-419.
Tsakloglou, P. and Papadopoulous, F. (2002) ‘Aggregate level and determining
factors of social exclusion in twelve European countries’, Journal of European Social
Policy, 12 (3): 211-25.
Vesanto, Juha, Alhoniemi, Esa, 2000. Clustering of the self-organizing map. IEEE
Transactions on Neural Networks 11, 586-600.
Whelan, Christopher T., Maître, Bertrand, 2005. Economic vulnerability,
multi-dimensional deprivation and social cohesion in an enlarged European Union.
International Journal of Comparative Sociology 46, 215-239.
Whelan, Christopher T., Maître, Bertrand, 2007. Levels and patterns of multiple
deprivation in Ireland: After the Celtic Tiger, European Sociological Review 23,